From layer cake to complexity: 50 years of geophysical investigations of the Earth
←
→
Page content transcription
If your browser does not render page correctly, please read the page content below
The Geological Society of America                                         18 8 8             2 013
                                                                                                                                                            0
                                                                    Special Paper 500
                                                                           2013
                                                                                                                                  CELEBRATING ADVANCES IN GEOSCIENCE

                              From layer cake to complexity: 50 years of
                               geophysical investigations of the Earth

                                                        Larry D. Brown*
                        Department of Earth and Atmospheric Sciences, Institute for the Study of the Continents,
                                          Cornell University, Ithaca, New York 14953, USA

                                                                      ABSTRACT

                            Geophysical observations of earth structure, kinematics, and dynamics have
                       served as a core driver in the development of our current understanding of how the
                       Earth evolves. They have provided essential insights that inform our ability to miti-
                       gate its hazards and effectively utilize its critical resources. Since the 1960s, when
                       geophysical measurements played a central role in establishing the plate tectonics
                       paradigm, geophysical techniques have become an increasingly sophisticated main-
                       stay in our scientific tool kit for addressing a wide range of scientific and societal
                       needs. From detailing the complex structural and compositional heterogeneities of
                       the Earth’s lithosphere and mantle to monitoring the tectonic processes that shape
                       the Earth’s surface and deep interior, from finding and monitoring the extraction of
                       critical natural resources that are increasingly rare to real time warning systems that
                       can provide life-saving alerts of tsunami and seismic shaking, geophysics continues to
                       play an increasingly important role in our lives. The myriad ways in which geophysics
                       has revolutionized our understanding of our planet, from core to ionosphere, are too
                       vast to properly represent in any single review. Presented here are selected highlights
                       from the myriad geophysical investigations of the solid Earth over the past 50 years.
                       In an attempt to set some defensible boundaries, and with some consideration for the
                       patience of the reader, I made some relatively arbitrary choices on field boundaries.
                       Gravity, for example, has seen a dramatic resurgence due in part to advances such as
                       satellite gravimetry (e.g., GRACE [Gravity Recovery and Climate Experiment]), but
                       I chose to defer that to the realm of geodesy, along with GPS and InSAR (interfero-
                       metric synthetic aperture radar). Slow earthquakes and episodic slip and tremor are
                       also clearly important new phenomena for geophysical study, but to my mind they
                       are more appropriately considered as tectonic developments. However, I trust the
                       selected examples provided are representative of the impressive past impact and the
                       exceptional future promise of the field of geophysics as a whole.

*ldb7@cornell.edu

Brown, L.D., 2013, From layer cake to complexity: 50 years of geophysical investigations of the Earth, in Bickford, M.E., ed., The Web of Geological Sciences:
Advances, Impacts, and Interactions: Geological Society of America Special Paper 500, p. 233–258, doi:10.1130/2013.2500(07). For permission to copy, contact
editing@geosociety.org. © 2013 The Geological Society of America. All rights reserved.

                                                                            233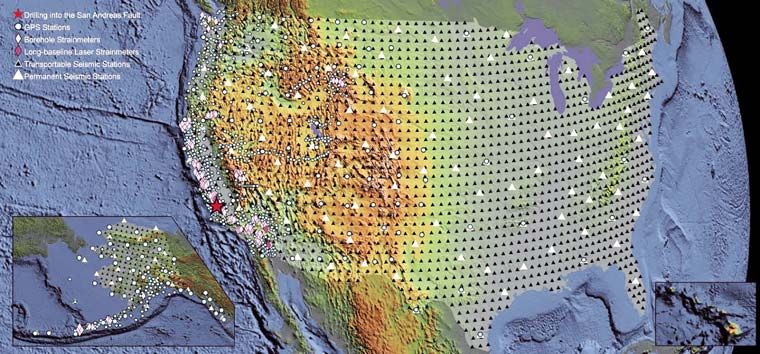
234                                                                 Brown

EARTH VERSION 1963: ONION SKINS AND                                      and Mooney, 2012, for a detailed historical review of both seis-
LAYER CAKES                                                              mic refraction and reflection studies of the Earth’s crust).

      Any review of progress in geophysical research should              PUTTING THE “PLATE” IN “PLATE TECTONICS”
include a baseline on the state of our knowledge at some refer-
ence point in its history. Given the theme of this volume, the early           Clearly the most important contributions of geophysics in
1960s is a logical choice. At that point geophysicists were digest-      the 1960s were those that helped to define and confirm the core
ing the observations stimulated by two relatively recent global          aspects of what came to be known as the plate tectonic para-
initiatives, the International Geophysical Year in 1957 (Sullivan,       digm. This was a true scientific revolution, about which so many
1961) and the Upper Mantle Project (Knopoff, 1966). Neither of           papers, books, reminiscences, and analyses have been written
these initiatives at their inception provided a hint of the plate tec-   (e.g., Menard, 1986; Orestes, 2003) that a review here would
tonics revolution soon to come, though the latter would produce          largely be superfluous. Moreover, the geophysical observations
a seismic network—the World Wide Standard Seismic Network,               that underpin our current understanding of plate tectonics can
or WWSSN—that would eventually provide critical observations             be found in most relevant textbooks today (e.g., Condie, 1997;
for the development of plate tectonics. However, they are an early       Kearey et al., 1999). I would simply point to some of the most
measure of the spirit of international collaboration, which has          important geophysical contributions to the development of basic
become a hallmark of modern geophysics. The consensus view               plate tectonic theory: (1) the geomagnetic recognition of polar-
of the Earth at that time was largely a static one, focused on the       ity reversals through geologic time (the basis of modern magne-
then available geophysical observations (largely from earthquake         tostratigraphy of many flavors) and the observation of organized
seismology) that the Earth appeared to consist of a number of            magnetic stripes on the ocean floor, which are now recognized
spherical shells, the principal ones being the crust, mantle, outer      as recording the history of seafloor accretion and “spreading”
core, and inner core (e.g., Gutenberg, 1959; Fig. 1). Although           (e.g., Vine and Matthews, 1963; Fig. 3); (2) the observation
lateral heterogeneity was obvious from surface geology, the              from heat flow measurements that heat flow decreases exponen-
“onion skin” viewpoint tended to hold sway even in terms of the          tially away from mid-ocean ridges (e.g., Lepichon and Langs-
structure of the outermost “skin,” the crust. Ever since Andrija         eth, 1969), thus providing insights into lithospheric cooling and
Mohorovičić proposed the existence of the boundary that we now           mantle convection; (3) the clearly linear patterns of global seis-
refer to as the Moho on the basis of seismic refraction observa-         micity, revealed by the relatively new global seismograph net-
tions (Mohorovičić, 1910), crustal cross sections based on the           works, which we now recognize as defining the boundaries of
refraction technique tended to be dominated by compositional             lithospheric plates (e.g., Barazangi and Dorman, 1969; Fig. 4);
stratification (e.g., Fig. 2). Of course, it was soon observed that      (4) the dipping geometry of deep earthquakes along certain of
there were important first order differences between crustal sec-        these earthquake “bands” along with the seismic observation of
tions geophysically observed in different parts of the world, espe-      relatively low attenuation within these “Wadati-Benioff” zones
cially between the thinner crust of the ocean and the thicker crust      (Benioff, 1954; Isacks et al., 1968); and (5) seismic confirma-
of the continents (Fig. 2). However, until the advent of deep seis-      tion of Tuzo Wilson’s proposed “transform fault” (Sykes, 1967).
mic-reflection profiling in the mid-1970s, and seismic tomogra-
phy in the 1980s, a “layer cake” mentality for earth structure was
common. Seismology at that time, at least, seemed to be guided
by the desire to define more and more subtle “layers” in the crust
and mantle in the layer-cake–onion-skin world view (see Prodehl

                                    Figure 1. Structure of the Earth,
                                    from Richter (1958), illustrating
                                    the spherical layering that domi-
                                    nated early geophysical models
                                    of the Earth’s deep interior.         Figure 2. Cross section of the crust of the United States, based on
                                                                          seismic refraction data collected in the late 1960s and 1970s. Closs
                                                                          and Behnke (1962). As more detailed surveys became available,
                                                                          heterogeneity of the crust at depth came to be more widely recog-
                                                                          nized, although such studies were still dominated by interpretations
                                                                          of layered structure until the 1970s.
50 years of geophysical investigations of the Earth                                        235

                                                                      The latter example is a particularly elegant example of how a
                                                                      geophysical observation can produce an unequivocal test of a
                                                                      fundamental geotectonic model. The seismic contributions to
                                                                      the development of plate tectonics are succinctly reviewed in
                                                                      the now classic paper by Isacks et al. (1968), from which the
                                                                      illustration in Figure 5 is widely reproduced.
                                                                           In many respects, plate tectonics not only provided the first
                                                                      comprehensive modern framework to understand—to the first
                                                                      order—the tectonics of the earth as a whole, but it also served to
                                                                      stimulate a new generation of geophysical investigations to test,
                                                                      refine, and expand its applicability to geoprocesses both grand
                                                                      and mundane. For example, the contributions of oceanic geo-
                                                                      physics to the development of plate tectonics as an explanation
                                                                      for the origin and destruction of ocean crust was a direct inspira-
                                                                      tion of the coming generation of deep seismic reflection programs
                                                                      to explore the continents’ lithosphere (Oliver et al. 1983), as well
                                                                      as a driver of the evolving suite of global tomographic techniques
                                                                      that have revealed the Earth’s mantle to be so much more com-
                                                                      plex that the spherical paradigms of an earlier generation (e.g.,
                                                                      Romanowicz, 2003). The relatively simple “focal mechanisms,”
Figure 3. Magnetic stripes on the sea floor of the Reykjanes Ridge,
Iceland, as reported by Vine (1966). The interpretation of these      such as those used by L.R. Sykes (1967) to test the transform
stripes as the magnetic record of sea floor spreading was a seminal   fault model, have evolved into the moment tensor solutions using
contribution to the quantification of plate tectonics.                body and surface waveforms and dynamic earthquake rupture

Figure 4. Global seismicity, as published by Barazangi and Dorman (1969). Recognition of the distribution of earthquakes as marking the
edges of tectonic plates was a cornerstone of plate tectonic theory.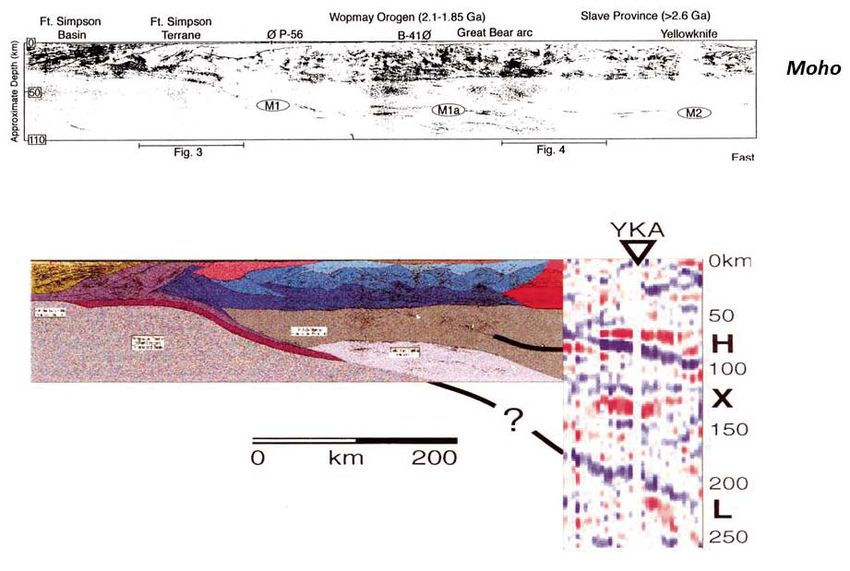
236                                                                 Brown

                                                                        individual investigator–driven format that was more characteris-
                                                                        tic of geophysical projects of the time. After an initial period of
                                                                        “test” surveys, intended in part to demonstrate the usefulness of
                                                                        multichannel reflection profiling in detecting and mapping deep
                                                                        continental crustal structure (e.g., Oliver et al., 1976; Brown et
                                                                        al., 1980; Smithson et al., 1978), COCORP began to systemati-
                                                                        cally profile the key geologic features of the United States, using
                                                                        the then relatively novel (at least to the larger academic commu-
 Figure 5. Plate tectonics as summarized by Isacks et al. (1968) in a   nity) Vibroseis source (Fig. 6) . Vibroseis was developed by the
 widely reproduced illustration.                                        oil industry to circumvent the negative environmental and liabil-
                                                                        ity issues associated with explosive sources, thus allowing reflec-
                                                                        tion surveys in areas where no explosives would be allowed.
models that now inform our understanding about how failure ini-         Beyond its success at addressing fundamental issues of crustal
tiates and evolves during earthquakes, and the orientation of the       structure in the United States (e.g., Fig. 7), COCORP inspired
stresses that gave rise to them (e.g., Das, 1980).                      similar national and even international collaborations to collect
                                                                        comparable data in other parts of the world (Fig. 8; Prodehl and
DEEP REFLECTIONS…                                                       Mooney, 2012). BIRPS (British Institutions for Reflection Profil-
                                                                        ing Syndicate) demonstrated that deep reflection profiling could
      Until the late 1970s, the primary seismic methodologies used      not only be successfully applied to the study of the crust beneath
to infer subsurface structures were based on the analysis of either     submarine continental margins, but could also detect and map
the dispersion of surface waves or the refraction of body waves         dramatic structures in the underlying lithospheric mantle (Fig. 9).
(P and S waves) as they pass through the Earth (e.g., Prodehl           Among the many notable efforts to follow were the German deep
and Mooney, 2012). While improvements in both approaches                seismic program (DEKORP), the French deep seismic program
were leading toward better discrimination of lateral heterogene-        (ECORS), and the Swiss deep seismic program NFP 20, each of
ity (mostly 2D, as 3D was still largely impractical owing to cost),     which resulted in major discoveries regarding lithospheric struc-
the variations in subsurface materials deduced from such meth-          ture and individually and collectively contributed to our current
ods were a far cry from the scale of heterogeneity obvious at the       understanding of the complexity of continental evolution. Two of
Earth’s surface. The same could be said for other geophysical           the pioneers in deep seismic studies, Canada and Australia, also
techniques then being used for mapping crustal structure, such as       launched major new initiatives to explore within their national
gravity and magnetotellurics. The seismic reflection technique,         boundaries. The Canadian LITHOPROBE program in particular
fueled by the dramatic advances in digital recording and signal         (Clowes et al., 1992) became not only a model for the efficient
processing, had become the principal method for hydrocarbon             organization of diverse academic, governmental, and industrial
exploration by the 1960s. In spite of its increasingly common use       interests in support of a major national effort, but has exemplified
in the study of the marine environment during oceanic surveys           the utility of integrating the seismic reflection methods with com-
(e.g., Ewing et al., 1973) and its clear potential for detailing sub-   plementary geophysical (especially seismic refraction, passive
surface structure on scales comparable to outcrop, multichannel         seismic, and magnetotelluric) techniques, and geological (field
reflection profiling was not widely used for studies of deep con-       mapping and geochemistry) methods. We also note that sig-
tinental structure below the sedimentary cover. This reluctance         nificant contributions to the deep reflection inventory were also
was due in part to the relatively high cost of reflection profiling     made by individual investigators, regional collaborations, and
on land, and the common expectation that the highly deformed            various agencies inspired by the national programs. Examples
rocks that were presumed to constitute most of the deep conti-          include CALCRUST in the southwestern United States (Henyey
nental basement would lack either the physical contrasts or the         et al., 1987), GLIMPCE in the Great Lakes of North America
lateral continuity necessary to produce mappable reflections.           (Behrend et al., 1988), and the U.S. Geological Survey (Zoback
      However, success in detecting (imaging) deep crustal reflec-      and Wentworth, 1986) among many others.
tivity in a number of small-scale experiments (especially in Ger-             Although many of these national efforts, largely built around
many, Canada, and Australia; e.g., Dix, 1965; Kanasewich et al.,        reflection surveys, have now concluded their operations (e.g.,
1969; Dohr and Meissner, 1975) led to the formation of more             COCORP, BIRPS, DEKORP, ECORS, LITHOSPROBE), oth-
systematic attempts to explore the deep structure of the continent      ers continue (Spain, Australia, Russia) or are just getting started
using the reflection technique. The progenitor of this new wave         (SINOPROBE in China). Perhaps more importantly, the era of
of geophysical exploration was the Consortium for Continental           national systematic geophysical programs has led to an era of
Reflection Profiling (COCORP) in the United States. COCORP              international surveys, in which the geological target is chosen
was not only an attempt to use this technology in a new context,        not because of its geopolitical affiliation but because of its global
but it became an exemplar of a geophysical initiative on a larger       geotectonic interest. Among the first of these was the INDEPTH
(i.e., national) scale (e.g., Brown et al., 1986), in contrast to the   (International Deep Profiling of Tibet and the Himalayas) Project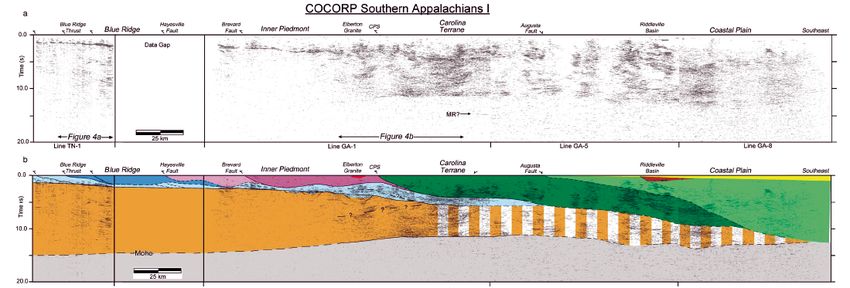
50 years of geophysical investigations of the Earth                                                  237

                                                                         Figure 6. The Vibroseis source used by COCORP and other deep seis-
                                                                         mic reflection surveys. The availability of alternatives to explosives
                                                                         for controlled source surveys greatly increased the feasibility of multi-
                                                                         channel reflection surveys in many areas (e.g., urban).

Figure 7. COCORP seismic image (top) and interpretation (bottom) of the crust of the southeastern Appalachian orogen. COCORP’s Appala-
chian results, which suggested that low- angle thrust faulting was a key process in continental collision and amalgamation, were a particular
stimulus for other national deep seismic programs, particularly in Europe. Moreover, the highly variable reflection patterns encountered along
this line, so typical of many deep reflection surveys, was a clear indication of the inadequacy of the simple layer-cake models of earlier gen-
erations. This version of the COCORP profile was generated by reprocessing of Cook and Vasudevan (2006).

                                                                                                        Figure 8. Major regional, national, and
                                                                                                        international deep seismic programs
                                                                                                        that were inspired, at least in part, by the
                                                                                                        COCORP program.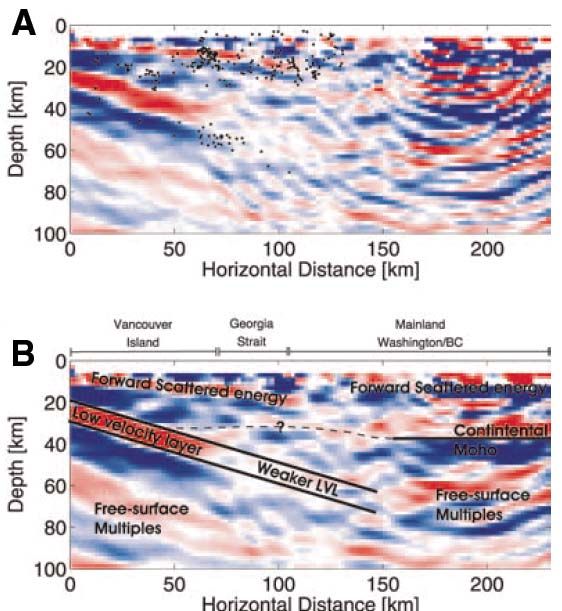
238                                                               Brown

                                                                       results from any geophysical technique, must now be interpreted
                                                                       in this more realistic context.
                                                                            Controlled source seismology has largely evolved beyond
                                                                       the refraction or reflection views to one that recognizes that both
                                                                       approaches to subsurface imaging provide useful, often comple-
                                                                       mentary constraints on structure, composition, or both. Logistics,
                                                                       or more often funding, still limits the design of controlled source
                                                                       surveys, and sometimes results in the emphasis of one approach
                                                                       to the exclusion of others; in general, the desirability of having
                                                                       the full wave field available for these kinds of surveys is now well
                                                                       accepted. The cost of controlled source surveys is largely dictated
                                                                       by the number of recorders (channels) needed and, to a greater
                                                                       degree, the number of sources (whether explosives or Vibroseis)
                                                                       required. Both are much larger for reflection surveys than refrac-
 Figure 9. Prominent mantle reflector mapped by BIRPS deep seis-       tion surveys, but are non-trial in both cases. The cost factor is one
 mic profiling (Flack et al., 1990). A number of similar dipping       consideration that has led to growth in other approaches, particu-
 events near the base of the crust have been observed around the
                                                                       larly those that use “free” natural sources.
 world, most commonly interpreted as fossil subduction zones. M
 labels the Moho, or base of the crust. A growing number of surveys
 have found that the mantle is far from the structurally homoge-       …THEN CONVERSION
 neous region it was once thought to be.
                                                                             While the controlled source community was evolving during
                                                                       the 1970s and 1980s toward more sophisticated application of
in which Chinese, U.S., German, Canadian, and Irish scien-             both refraction and reflection techniques to extract images from
tists have collaborated since 1992 to collect deep reflection and      artificial sources, seismologists working with natural sources,
complementary geophysical (MT [magnetotellurics], refraction,          e.g., earthquakes, were undergoing a revolution of their own. Of
passive seismic) data along a transect of the Himalaya-Tibetan         course, natural sources have long been used to infer the Earth’s
Plateau collision zone (Nelson et al., 1996). Examples of similar      internal structure, both on the global scale using both body waves
initiatives include the ANCORP effort in the Andes (ANCORP             (Bullen, 1956) and surface waves (Press and Ewing, 1955) and
Working Group, 2003), the URSEIS profile in central Russia             the local scale (Mohorovičić, 1910). Many of the analysis tech-
(Berzin et al., 1996), and the Carpathian surveys in Romania           niques of refraction seismology apply equally well to earthquake
(Knapp et al., 2005). The global inventory of deep reflection          sources. In fact, estimation of Earth structure, at least in terms
imagery now includes contributions from most continental areas,        of the velocity of seismic wave propagation, is a prerequisite for
although coverage in South America, Africa, and Antarctica             study of the earthquakes themselves (e.g., location).
remain extremely sparse (Fig. 8).                                            Although refracted phases are the “bread and butter” of clas-
      Any kind of comprehensive summary of the scientific find-        sic body wave techniques for deducing whole Earth structure,
ings of these deep reflection efforts is beyond the scope of this      reflected phases from the major discontinuities are an obvious
overview. However, a list of highlights should include (1) delin-      source of additional information about physical property changes
eation of the geometry of crustal scale, low-angle overthrusting       at depth (e.g., Bullen, 1956). The reflected phase (PcP) from the
owing to continent-continent collision (e.g., Cook et al., 1979;       core-mantle boundary (Brush, 1980) is but the most obvious of
Zhao et al., 1993); (2) the existence of anomalously strong reflec-    global reverberations now used to refine our whole Earth models
tors that mark fluid accumulations in the deep crust (e.g., De         of first-order velocity variations.
Voogd et al., 1986; Brown et al., 1996); (3) “flat” Moho geom-               Turning attention back to the crust, reflected phases from
etries that suggest post-orogenic crustal re-equilibration (Klem-      earthquake sources have also long been used to map the Moho (e.g.,
perer et al., 1986); (4) Moho faults that mark residual lithospheric   Prodehl and Mooney, 2012) as well as less common interfaces (e.g.,
strength (Diaconescu et al., 1998); (5) mantle reflections that        magma chambers; Sanford et al., 1977). However, recognition of
mark fossil subduction zones in ancient (Precambrian) cratons          such reflected phases from natural sources was hampered in the past
(Cook et al., 1998); and (6) large-scale (hundreds of kilometers)      by the lack of adequately dense surface arrays of stations to record
intrusions (sills) in Precambrian crust (Mandler and Clowes,           and identify their characteristic travel-time pattern.
1997). Individual surveys aside, the overall impact of deep                  In the early 1980s a number of seismologists recognized that
reflection profiling has been to “retire” the layer-cake view of       interfaces that have such contrasting properties as to give rise
the crust (and lithosphere) in favor of one which recognizes that      to reflections from energy incident from above should also give
composition and structural complexity of the deep crust, and to a      rise to converted waves generated by energy incident from below
lesser degree the lithospheric mantle, are commensurate with the       (e.g., Phinney, 1964; Langston, 1977; Owens and Zandt, 1985).
geological heterogeneity that marks the Earth’s surface, and that      Converted waves are P or S waves that are generated by the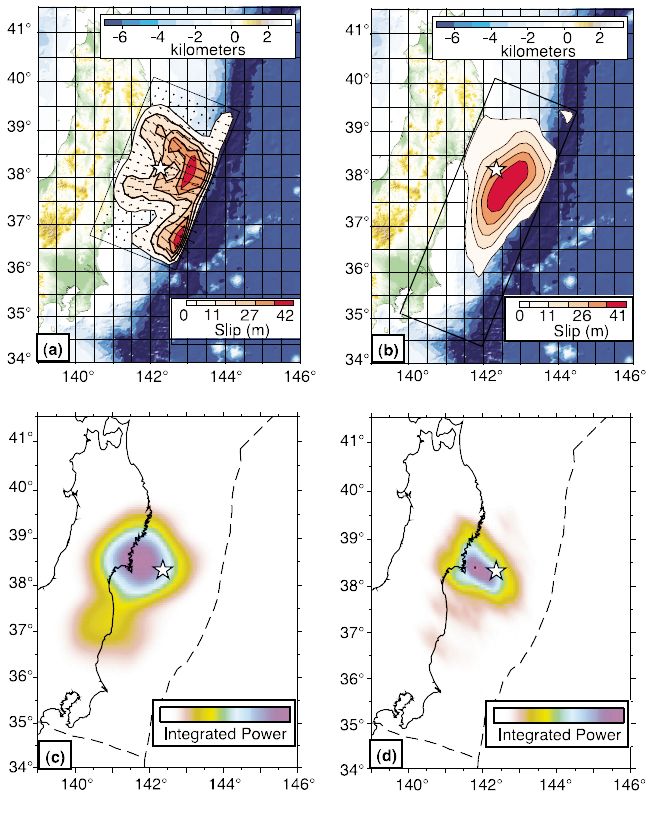
50 years of geophysical investigations of the Earth                                              239

                Figure 10. Receiver function image of the Moho beneath the Rio Grande Rift of central New Mexico (Wilson
                et al., 2003). Converted phases provide a means of mapping details of lithospheric and mantle heterogeneity
                that does not require expensive artificial sources.

interaction of their “opposite number” with an interface. That is,       the S to P conversion can be, and has been, used to map the Moho,
a P-wave incident at an angle to an interface will often give rise to    its principal interest lies in the identification of seismic boundaries
a refracted S wave as well as a refracted P wave (and vice versa).       in the upper mantle. Many of these mantle boundaries appear at
P waves converted to S waves, and S waves converted to P waves,          depths that other lines of evidence suggest is appropriate for the lith-
have both been used to indicate the presence and nature of a con-        osphere-asthenosphere boundary (e.g., LAB, Kumar et al., 2005;
verting interface. Discrimination of such converted phases on the        Rychert et al., 2005; Fischer et al., 2010). However, some such
typical seismogram can be problematic because of interference            boundaries (convertors) lie at depths that seem at odds with other
with other seismic arrivals caused by complexity of the source or
source region. However, Vinnik (1977) and Ammon (1991) dem-
onstrated how a relatively simple filter (deconvolution) exploit-
ing the recorded P wave can isolate S waves generated by con-
version at an interface beneath the receiver. The product of this
deconvolution process has been termed the receiver function for
an earthquake recorded at a particular station. Subsequent work
has refined this technique so that converted waves generated by
seismic waves, arriving beneath a seismic station from distant
earthquakes, can be used to map subsurface interfaces in a man-
ner that is similar to that used on reflected phases from surface
sources. The Moho has been a logical target for mapping with
this technique (e.g., Fig. 10), though it has proven successful at
detecting and mapping more complex structures (Figs. 11, 12).

DEEPER WE GO…

     While the use of P to S conversions, particularly to map the
Moho, have now become relatively widely used, recent attention
has also focused on the use of S to P conversions (Yuan et al., 2006).
While P to S techniques tend to work well for crustal interfaces
down to and including the Moho, problems arise when trying map
deeper interfaces, owing in part to interference of potentially deeper
conversions with multiples of P waves generated by the surface and
the Moho. Farra and Vinnik (2000) demonstrated that this problem
can be avoided by looking at S to P conversions, since conversions        Figure 11. Receiver function image of subduction beneath Casca-
arrive earlier than the parent S wave at the surface and thus can-        dia (Nicholson et al., 2005). (A) Image with dots indicating earth-
not be obscured by crustal multiples of the S wave itself. While          quake hypocenters. (B) Interpretation.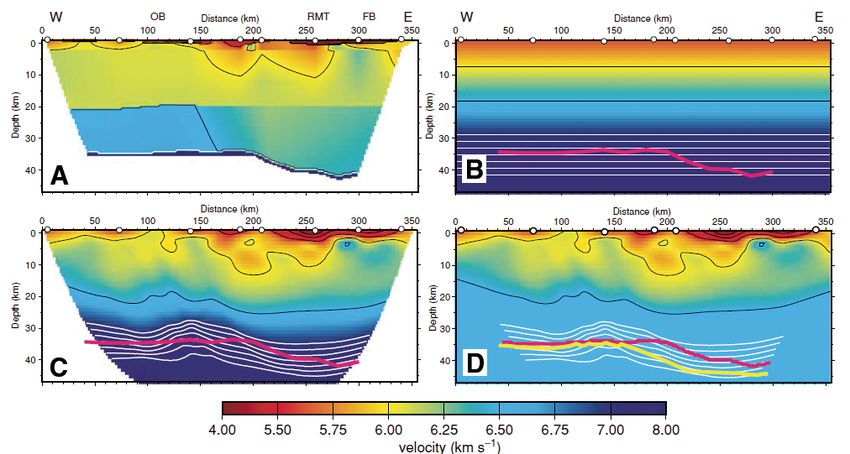
240                                                                 Brown

                                                                                The putative LAB is far from the deepest target for receiver
                                                                          function study. Both the 410-m and 660-km mantle seismic dis-
                                                                          continuities, inferred from traditional seismic refraction analysis
                                                                          of teleseismic recordings, appear as distinctive convertors (Fig.
                                                                          14) on receiver functions (e.g., Gao et al., 2002). Convertor map-
                                                                          ping of these interfaces has led to clearer recognition of lateral
Figure 12. The Puna Altiplano magma body (low velocity zone,              variations in their character, particularly the thickness between
or LVL), imaged by receiver functions across the central Andes            them, which is a powerful indicator of the thermal regime con-
(Chmielowski and Zandt, 1999).
                                                                          trolling phase changes associated with these boundaries (Law-
                                                                          rence and Shearer, 2006). Moreover, the nature and continuity of
                                                                          these boundaries beneath areas of subduction provide important
indicators of lithospheric thickness (e.g., 80 km beneath Iceland?        constraints on the nature or even existence of slab penetration
Kumar et al., 2007). Yuan and Romanowicz (2010) argue that the            into the lower mantle, a longstanding issue in mantle convection
mantle boundaries delineated by converted phases that most often          (e.g., Li et al., 2000; Zhao et al., 2010; Fig. 14).
are observed are too shallow for the LAB and may represent a com-
positional boundary within the lithosphere. Certainly the fact that       DEEPER STILL: ANTI-CONTINENTS ON THE CORE?
more than one mantle discontinuity has been observed by both deep
reflection and receiver function profiles indicates that more than the         While fresh details of the crust and mantle have been revealed
LAB is involved (e.g., Steer et al., 1998; Fig. 13). The nature of        by the application of new techniques, to succeeding generations
these mantle interfaces, as well as the nature of the LAB, is clearly a   of ever denser seismic arrays (see below), geophysicists probing
topic that will continue to engage both geophysicists and mineralo-       the Earth’s deepest recesses have made equally dramatic discov-
gists for some time.                                                      eries from field and laboratory investigations. The core-mantle

             Figure 13. Top: Deep reflection image (controlled source) of lithospheric structure across the Slave Province of NW
             Canada, collected as part of the LITHOPROBE SNORCLE transect (Cook et al., 1998). Bottom: Interpretation of
             the reflection structure and comparison with receiver function image derived from teleseismic recordings that overlap
             the SNORCLE transect (Bostock, 1999). Note that both the controlled and natural-source images indicate a number
             of mantle discontinuities, not all of which can be the LAB. Note also the superior resolution of the controlled source
             results versus the greater penetration provided by the natural-source approach. H, X, and L refer to mantle reflectors/
             convertors discussed by Bostock (1999). YKA indicates position of the Yellowknife Seismic Array.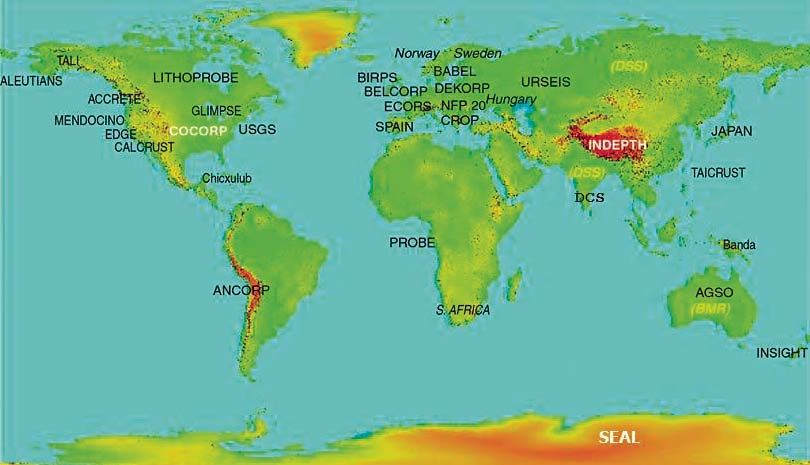
50 years of geophysical investigations of the Earth                                              241

Figure 14. Receiver functions, detailing the 410 and 660 mantle disconti-
nuities beneath the Japanese subduction zone (Li et al., 2000). Their conti-    Figure 15. Modern geophysical surveys are more likely than not to
nuity and character constrain the nature and extent of deep slab penetration.   be designed to collect multiple modes of seismic data (controlled and
                                                                                natural source) as well as critical independent geophysical observa-
                                                                                tions (e.g., magnetotelluric) along with geological and geochemi-
boundary (CMB) has been a special focus of geophysicists, geo-                  cal mapping-sampling. Moreover, the development of both land and
chemists, and geodynamicists alike (Lay et al., 1998; Knittle and               marine instrument pools has made detailed imaging with onshore-
                                                                                offshore deployments much more effective.
Jeanloz, 1991). A zone of transition from solid (lowermost man-
tle) to liquid (outer core), the CMB has been suspected to play a
central role in mantle plume generation (Loper, 1991). As a region
of significant heterogeneity, it has been suspected of influenc-                      Deep reflection and conversion (receiver function) surveys
ing the composition of both mantle and core (Song and Ahrens,                   both often involve fundamental ambiguities when translating
1994), and perhaps even the generation of the Earth’s magnetic                  observed time sections (whether near-vertical two-way reflection
field (Marzocchi and Mulargia, 1992). Seismic observation of the                time or one-way conversion lag time) into true depth sections.
D″ layer near the CMB have stimulated such novel concepts such                  Appropriate velocity information is also needed for this transla-
as anti-plates with anti-crust drifting across the liquid core (e.g.,           tion (P-wave velocity for the typical deep reflection survey, and
Maruyama et al., 2007).                                                         S-wave velocity for the typical receiver function). In the case
                                                                                of deep reflection data, accurate depth conversion may require
CONVERGENCE? (METHODOLOGICAL, THAT IS)                                          a co-located wide-angle (e.g., refraction) survey. In the case of
                                                                                receiver functions, crustal multiples can be used to constrain the
     One of the attractions of the receiver function technique                  bulk P-S velocity variation between the surface and the interface
is that useful results can be obtained by simply placing a three                in question (e.g., Moho; Zhu and Kanamori, 2000), but indepen-
component seismograph in the ground and recording for an                        dent estimates of either P- or S-wave velocities are needed for
acceptable period of time. No explosives, no Vibroseis, no                      depth conversion.
irate landowners with damaged wells, no large arrays of instru-                       Of course, the ideal deep seismic survey (Fig. 15) is not an
ments, although obviously, the more stations the better as with                 either/or proposition: If cost were not an issue, then co-located
any seismic technique. This use of natural, rather than artificial,             acquisition of controlled source seismic reflection-refraction and
seismic sources is one of the logistical and economic benefits                  passive teleseismic data are usually highly desirable. Moreover,
of the receiver function and other so-called passive techniques                 seismology is not the only geophysical tool of value in any sub-
(although “passive” seems a rather dismissive description when                  surface study, and a truly multidisciplinary acquisition is more the
an earthquake source is involved: I prefer the terms natural vs.                norm than not, at present. Unfortunately, cost is almost always an
controlled source).                                                             issue, and tradeoffs in resolution versus penetration is usually a
     However, it is important to bear in mind the limitations                   fact of life as well as limits on the diversity of methodology that
imposed by reliance on natural sources in lithospheric imaging.                 is affordable for a particular target.
The spatial variability of adequately large earthquakes can lead
to biased azimuthal illumination for receiver function imaging,                 ARRAYS OF ARRAYS: WWSSN TO EARTHSCOPE
resulting in distorted convertor geometries or even a lack of ade-
quate sources altogether for some target regions. Moreover, the                      The rapid growth in recent years in receiver function studies
frequencies, and therefore the spatial resolution, available from               of lithospheric and upper mantle structure has been stimulated
teleseismic sources are typically much lower than those available               not only by improvements in the analytical techniques needed to
from surface controlled sources (Fig. 13). Conversely, the greater              extract such information, but also by the rapid expansion of seis-
energy and lower frequencies available from natural sources                     mograph networks, which routinely record the teleseismic data
allow for much deeper penetration.                                              that make receiver function computations possible. As pointed out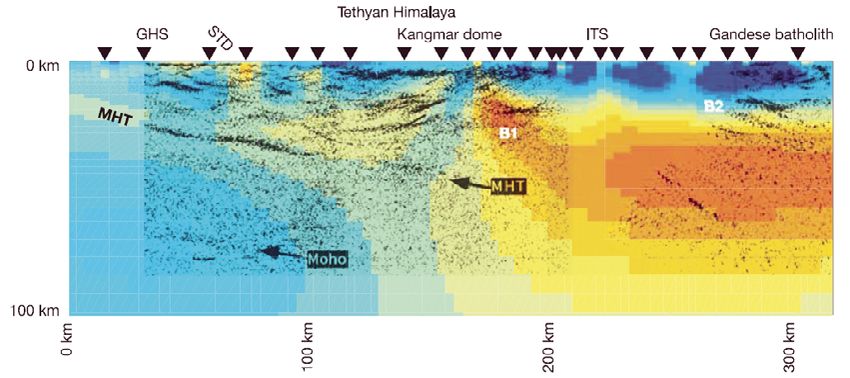
242 Brown
earlier, establishment of the WWSSN in the late 1950s and early 1980s. The UNAVCO consortium (http://www.unavco.org/),
1960s, although driven by Cold War concerns regarding nuclear for example, has served a similar role for the geodetic com-
test detection, led to global seismic observations that were critical munity. The marine geophysical community largely blazed
to establishing the theory of plate tectonics. Likewise, the era of the trail for national and international cooperative ventures
deep reflection profiling was made possible by the development with the international Deep Sea Drilling Project that began in
of multichannel reflection techniques and hardware driven in this 1968 (http://www.iodp.org/), which led to more recent global
case largely by the needs of the oil exploration industry. programs such as RIDGE 2000 (http://www.ridge2000.org/),
Thus no assessment of the evolution of geophysics over MARGINS (http://www.nsf-margins.org/), and their successor
the past 50 years is complete without acknowledgment of the GeoPRISMS (http://www.geoprisms.org/). In addition to such
advances in hardware for the detection of geophysical signals, characteristic components as the ocean drilling ships (e.g., R/V
and nowhere has this been more dramatic than in the proliferation JOIDES Resolution and the new riser-equipped R/V Chikyu)
of seismic recording arrays. in the current Integrated Ocean Drilling Program. Each of
The analytical advantages of recording seismic signals with these initiatives contained, or was linked to, major geophysi-
groups of recorders rather than with isolated individual units has cal components and/or instrument pools, most notably the R/V
long been recognized, and the role of pioneering large-scale efforts Marcus Langseth, which is capable of 3D reflection surveys
such as the NORSAR array in Scandinavia and the Yellowknife and the Ocean Bottom Seismography Instrument pool (http://
array in Canada are well known (e.g., Bungum et al., 1971; Anglin, www.obsip.org/). Recent investigations have begun to take
1971). The power of arrays for signal detection and enhancement advantage of coordinated land-sea surveys, drawing resources
underpins the entire field or multichannel reflection seismology, from several of these programs (e.g., Project TAIGER; Okaya
whether for resource exploration or deep Earth studies. et al., 2009).
One of the most far reaching developments in array seismol- The key point is that EarthScope and similar large-scale
ogy over the past few decades was the establishment in 1984 of geological-geophysical programs in both the United States and
the IRIS (Incorporated Research Institutions for Seismology) in other countries now make possible the geophysical delinea-
Consortium. A largely grass roots effort by the U.S. geophysi- tion of the Earth’s interior on scales and over distances that were
cal community to pool resources and promote large scale col- once considered impractical. Moreover, the diverse observations
laborations, IRIS (http://www.iris.edu/hq/) has facilitated the collected by programs like EarthScope (with its PBO, TA, and
rapid expansion of array studies of the Earth’s interior around FA collecting geodetic, seismic, and MT data) serve multiple
the world. IRIS has achieved this success not only by providing purposes, from the study of seismotectonic processes to imaging
a large pool of modern recording hardware (Program for Array the subsurface (especially the mantle) with unprecedented reso-
Seismic Studies of the Continental Lithosphere, or PASSCAL), lution. EarthScope data have already fueled many of the recent
but also by establishing a central data center (the IRIS Data Man- receiver-function studies of crustal and lithospheric discontinui-
agement Facility, or DMC) for facilitating the uniform archival ties beneath the United States, and have been a particular catalyst
and distribution of the data collected by its diverse community for our most recent imaging of the deep Earth using tomographic
of users. Through the use of workshops and webinars, IRIS has techniques (see below).
also served to stimulate geological discourse regarding the sig- It is also important to note that these modern arrays are areal
nificance of the data it has helped the community acquire (http:// rather than linear. Thus the data collected can be analyzed for
www.iris.edu/hq/iris_workshop2012/). The power of such com- three dimensional variations in the attendant physical proper-
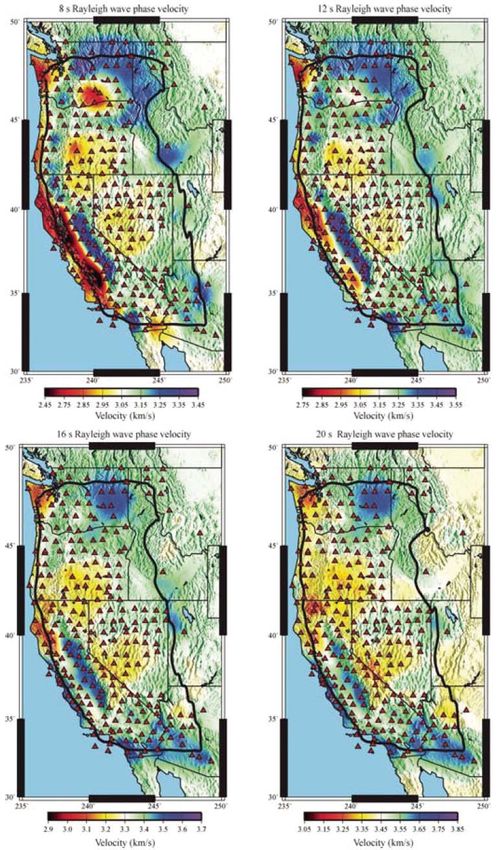
munity approaches is epitomized by the EarthScope Initiative ties at depth, which is not only more geologically useful but also
(Fig. 16), now operated within the IRIS framework. EarthScope allows for more accurate geophysical imaging, even when the
is a program that includes several complementary geophysical structure is two dimensional. However, while areal arrays are
array initiatives, including the components known as the Plate now standard in resource exploration (see below), they remain
Boundary Observatories (PBO), which is effectively an array relatively rare in academic controlled-source surveys (refraction
of GPS stations for monitoring ground motion along the west or reflection) because of their cost.
coast of the United States, and two dominantly seismic arrays, It probably goes without saying that all of these develop-
the Transportable Array (TA) and the Flexible Array (FA), which ments in geophysical data acquisition were made possible by
were designed essentially to “scan” the United States from west corollary developments in computational technology and cor-
to east over a period of ~10 years. In addition to standard seismic responding signal-processing methodologies. This is true for all
instrumentation, a number of magnetotelluric stations are avail- geophysical methodologies—gravity, magnetics, magnetotellu-
able to use in conjunction with TA and FA recording. A detailed rics, heat flow—but especially critical in the evolution of seismic
description of EarthScope is well beyond the scope of this short techniques. Not only has computer technology made feasible
review, but relevant characteristics can be found on the extensive many of the analytical methodologies that we once considered
EarthScope Web site (http://www.earthscope.org/). impossible (or impossibly expensive!), it has allowed the devel-
IRIS is certainly not the only, or even the first, large- opment of simulation software in virtually every field of geo-
scale, community-driven facility to come on the scene in the physics that is now taken for granted.50 years of geophysical investigations of the Earth 243
Figure 16. EarthScope’s USArray is an
example of a modern areal array ap-
propriate for imaging 3D structure over
large areas using natural source tech-
niques (receiver function, body wave,
and surface wave tomography) as well
as providing more uniform characteriza-
tion of seismicity. Status of the trans-
portable array (envisioned here) can
be found at http://www.earthscope.org/
observatories/usarray.
The convergence of digital recording by denser and denser straints on spatial variations in structure for the relevant spatial
arrays with more sophisticated processing capabilities is perhaps variations in physical properties (e.g., Nolet, 2008; Aster et al.,
most iconic in the evolution of tomographic techniques. 2012). Tomographic methods can, and are, applied to any set of
geophysical observations, but the application to seismic obser-
RED STATE, BLUE STATE: THE RISE vations is perhaps the one with which most earth scientists are
OF TOMOGRAPHY familiar. Tomography is widely applied to both reflection and
refraction data collected in controlled source surveys (e.g.,
Geophysical tomography has many forms. Tomography is White, 1989; Zelt et al., 2003) (Fig. 17) to obtain more “realistic”
an imaging method that inverts suites of path-integrated con- estimates of subsurface velocity variations, which often means
Figure 17. Tomographic inversion of recordings of explosive sources for velocity structure beneath the Canadian Cordillera (from Zelt et
al., 2003). (A) Preferred model, based on ray tracing (forward modeling). (B) Starting model (informed guess). (C) Inversion of first arrivals
(refractions) only. (D) Inversion of first arrivals for velocity, and reflected arrivals for Moho depths. Tomographic techniques have allowed
more effective mapping of lateral as well as vertical heterogeneity, using refracted and reflected seismic waves.244 Brown
the incorporation of lateral variations that are problematic for has previously been dismissed as “ambient noise” in seismic
conventional analytic solutions or even modeling. recordings actually consists of surface wave energy that can be
Among the seismic applications of tomography, mapping of harnessed for use in tomographic inversions for seismic veloc-
regional to global variations of seismic velocity (P, S, or both) from ity (primarily S) with depth. This ambient noise, also known as
earthquake sources has attracted perhaps the most attention both microseisms, has been recognized for years to be associated with
within the field and among non-specialists. Certainly the format surface waves generated by phenomena such as storm waves
in which the results of such analysis are typically presented, with along coastlines. Using a cross-correlation technique that is com-
bright colors representing fractional variations in seismic velocity, monly referred to as seismic interferometry, it has been estab-
is both eye catching and conducive to immediate interpretation. lished that this “background” vibration can be reconstituted as
The development of seismic tomography, especially with surface wave energy propagating between two seismic stations.
respect to earthquake sources, has paralleled the rise of compu- Thus, instead of having to wait for suitable earthquakes to gener-
tational capability and observational densification. Romanowicz ate the requisite surface waves for analysis, equivalent seismo-
(2003) provides a cogent summary of the field’s growth since the grams from “virtual sources” can be computed from a sufficiently
pioneering efforts of Aki et al. (1977), Sengupta and Toksoz (1976), large sample of the noise. The result is that detailed tomographic
and Dziewonski et al. (1977).The early attempts were largely lim- images can be computed within a seismic array without the need
ited by the availability of data and the uneven sampling of networks for an earthquake to occur. First proposed by Claerbout (1968),
across the Earth’s surface (Fig. 18). As the resolution and robustness and demonstrated by Weaver and Lobkis (2001), the methods
of tomographic results have improved, their utility as guides to the have now been established as quite robust by a number of inves-
fate of tectonic plates and their effectiveness as a means of recogniz- tigators (e.g., Campillo and Paul, 2003; Shapiro and Campillo,
ing mantle plumes has become more convincing (e.g., Zhao, 2004). 2004; Lin et al., 2007). Figure 21 gives a recent example of
Certainly the imaging that suggests the existence and defines the tomographic imaging of the western United States using ambient
geometry of dipping high-velocity zones in active subduction zones noise recorded by the USArray.
(Lay, 1997) (Fig. 19) is a satisfying confirmation of the expectations Extraction of useful surface-wave energy by seismic inter-
of plate tectonic theory as well as a basis for probing both for the ferometry has become relatively routine. Extraction of body
details of active subduction and for the remnants of former subduc- waves by similar analysis has proven to be possible (e.g., Dra-
tion zones (Fig. 20). ganov et al., 2007; Roux et al., 2005; Tonegawa et al., 2009;
Tomography has found fertile ground for application to both Ryberg, 2011) and occasionally spectacular (Lin et al., 2013), yet
body waves and surface waves. First applied simply to observed the conditions within which it can provide useful virtual P and S
travel times (e.g., Bording et al., 1987), it has evolved to exploit waves remain to be determined.
the information contained in the total seismic waveform (e.g., Seismic interferometry also has many applications beyond
Luo and Schuster, 1991; Tape et al., 2010). These techniques extraction of signal from ambient noise, ranging from improved
have provided unparalleled 3D insights into the larger scale imaging for resource exploration (e.g., Wapenaar et al., 2008;
structures and processes that were well beyond the capabilities Schuster, 2010) to converting earthquake hypocenters into virtual
of geophysics in the 1960s. However, it is important to remember seismographs (e.g., Curtis et al., 2009).
that resolution from tomography in the mantle is still much lower
than that we associate with geophysics within the crust (whether THE FABRIC OF DEEP TECTONICS:
controlled or natural sourced, reflection, refraction, or receiver SEISMIC ANISOTROPY
function) and likely lower still than the postulated mantle het-
erogeneities (marble cake) inferred from some geochemical evi- Paralleling the development of tomographic methods for map-
dence (e.g., Allègre and Turcotte, 1986; Kellogg et al., 1999). ping mantle velocity variations during the 1970s and 1980s was a
However, resolution will likely continue to increase with time as remarkable new seismic method for remotely measuring crystal-
both the observation database and the computational methodolo- lographic alignment in certain minerals. Seismic anisotropy—that
gies improve (e.g., Montelli et al., 2004). is, seismic waves traveling faster through a material in one direc-
In addition to the estimation of P- and S-wave velocity varia- tion than another—has been known from both seismic field exper-
tions with depth, tomographic methods have proven widely use- iments and laboratory studies for some time (e.g., Crampin et al.,
ful at mapping seismic attenuation, which is often a better proxy 1984; Christensen, 1984; Silver, 1996). However, the impact of
than velocity for temperature and melting at depth (e.g., Schurr this phenomenon on large scale tectonic studies began in earnest
et al., 2003). with the recognition that teleseismic shear waves that have been
polarized along their path can be used to measure shear-wave
ONE MAN’S NOISE IS ANOTHER MAN’S SIGNAL anisotropy along the route from the point of polarization to the
(SEISMIC INTERFEROMETRY) point of recording by analyzing the extent to which the shear-wave
arrival has been split into fast and slow components (e.g., Vinnik
One of the more recent developments in tomographic inver- et al., 1984; Kind et al., 1985; Silver and Chan, 1988). By rotating
sion using surface waves is the recognition that much of what the seismogram to an orientation that maximizes the difference50 years of geophysical investigations of the Earth 245
Figure 18. Early global tomographic section of the upper 670 km of the
mantle (Dziewonski and Anderson, 1984). Though blurry by modern
standards, these early results clearly demonstrated the potential of to-
mography for detailed geological complexity at great depth.
Figure 19. Modern subduction: Tomo-
graphic images of variations in P (top) and
S (bottom) wave speeds beneath Tohoku,
Japan, from Hasegawa et al. (2005). Active
volcanoes are indicated by red triangles,
and earthquakes by open circles. Dense
seismic networks and intense seismicity
make the Japanese arc an ideal location for
various natural source imaging techniques.
These images clearly confirm the expecta-
tions from early plate tectonic theory—i.e.,
a relatively cold (fast) lithospheric slab
returning into the mantle, dewatering of
which induces partial melting in the over-
lying mantle (slow regions, especially evi-
dent in the S-wave result) which feed the
surface volcanism. The tomography also
indicates that Benioff zone seismicity is
confined to the upper part of the subduc-
tion slab. Note the greatly increased resolu-
tion of features as compared to the earlier
result shown in Figure 18. dVp—deviation
of P-wave velocity from reference model;
dVs—deviation of S-wave velocity from
reference model.
Figure 20. Ancient Subduction? P (A) and S (B) wave tomographic images, indicating relatively fast material dipping eastward beneath
the central and eastern United States, interpreted by Grand et al. (1997) as the remnant of the Farallon plate subducted along the western
United States more than 70 Ma. These images suggest that subducted slabs can penetrate into the lower mantle.246 Brown
Figure 21. Variations in Rayleigh
phase velocity in the western United
States as a function of period (proxy
for depth) derived from surface waves
extracted from ambient noise by cross
correlation (seismic interferometry).
From Lin et al. (2008). The ability
to use background noise for imaging
freed seismologists from dependence
on earthquake (uncontrollable) and
artificial (expensive) sources.50 years of geophysical investigations of the Earth 247
between the fastest and slowest component, the orientation of the MORE THAN SEISMOLOGY
causal anisotropy can be determined. The most commonly used
phase is SKS (Fig. 22), which is polarized as it is generated by The previous discussion has leaned heavily (to put it mildly!)
mode conversion at the core-mantle boundary on its outbound leg. on examples in seismology, and in particular on the use of seis-
Generally, such anisotropy so measured is attributed to orientation mology in mapping deep geologic structure. Mention has been
in olivine caused by flow in the mantle asthenosphere (e.g., Sav- made, however, of the fact that some of the key developments
age, 1999). Subsequently, SKS anisotropy has become a robust in seismology have corresponding advances in the other fields
tool for mapping asthenospheric flow in increasing complex of geophysics, and another reviewer could easily focus on those
geometries, such as lateral flow around subducting slabs (Russo developments instead of seismology. Currently it is the rare field
and Silver, 1994; Long and Silver, 2008) (Fig. 23) and continental program that does not encompass collection of a wide variety of
“keels” (Fouch et al., 2000). geophysical data as a matter of course, and the insight provided
Silver and Chan (1988) noted, however, that the orientation by these different viewpoints is often critical to arriving at a com-
of anisotropy from SKS in some areas seem to be parallel to sur- pelling interpretation (Fig. 24).
face orogenic strike, even for Precambrian orogens. They sug- Inversion techniques, of which tomography is a subset, are
gested that the anisotropy beneath cratons, rather than mapping equally important to the modern gravity, magnetic, and magneto-
modern asthenospheric flow, was a remnant of ancient flow now telluric observations. A focus of current computational research
frozen in the ancient lithosphere. Interpretation is complicated by is in the area of so-called “joint inversion,” in which results from
the possibility of layered anisotropy (e.g., a fossil component in two or more “independent,” often relatively disparate techniques,
the lithospheric mantle, a modern fabric with different orienta- are used to estimate the best set of subsurface properties that
tion in the sublithospheric mantle) and the possibility that there are consistent in a best-fit sense with both sets of observations.
may be a significant component of crustal anisotropy that may The expectation is that the use of independent data sets will both
not be simply related to any crystallographic orientation of a reduce the effect of systematic errors and compensate for rela-
single mineral. In spite of the possible complications, teleseismic tive weaknesses inherent in either data set when examined alone.
estimation of mantle anisotropy has now taken its place as a stan- Examples of current research in joint inversion (Fig. 25) include
dard tool for estimating deformation-induced fabrics. joint inversion of surface-wave and body-wave seismic data (e.g.,
Crustal anisotropy has also attracted fresh attention in both Ishii et al., 2002; Marone et al., 2003; Oberbski et al., 2011), joint
laboratory and field experiments. The greater heterogeneity and inversion of surface-wave and receiver-function data (e.g., Julià
range of crustal materials, not to mention the longer history of et al., 2000; Chang et al., 2004; Fig. 21), and joint inversion of
deformation in continental crust, make deciphering bulk anisot- seismic and magnetotelluric data (Moorkamp et al., 2010).
ropy measurements in the crust more challenging. However, One clear trend over the past 50 years is the move from stud-
progress has been made in mapping anisotropy to mineralogy ies involving an investigator with expertise in one technique to
for crustal materials and in extracting the crustal component of address a problem, to one in which a team of many investiga-
anisotropy from both teleseismic and local seismic recordings tors with expertise that spans a range of relevant technologies,
(e.g., Godfrey et al., 2000; Okaya et al., 2004). including a number of independent geophysical methodologies
(e.g., controlled and nature-source seismology, magnetotellurics)
as well as a range of relevant geological and geochemical exper-
tise. This multidisciplinary approach, for example, as pioneered
by the LITHOPROBE program and promoted by the Continental
Dynamics Program of the U.S. National Science Foundation, has
become the norm for modern geophysical studies.
CONSIDER THE SOURCE
Much of the previous discussion has focused on probing
subsurface structure, particularly at crustal to mantle scales. In
the case of seismology, this often involves the analysis of signals
generated by earthquakes to quantify changes in physical prop-
erties of the earth along the path traveled by those signals from
source to receiver.
Those same records are equally valuable for deducing the
nature of the source itself. The past 50 years have, unsurprisingly,
Figure 22. Global compilation of SKS anisotropy measurements from
Savage (1999). Such anisotropy is widely interpreted as mapping the seen major advances in what can be learned about the earthquake
orientation and intensity of large-scale deformation in the mantle, sources involved. These advances include more accurate means
sometimes interpreted as fossil, more often as modern. for deducing the locations of earthquakes (e.g., Waldhauser and248 Brown
Figure 23. Dynamic model of mantle flow associated with slab subduc-
tion, taken from Long and Becker (2010). SKS anisotropy provides a
means of directly testing such models.
Figure 24. Integration of diverse geophysical observations has proven essential in many cases to develop
compelling interpretations of subsurface structure. This example, from Unsworth et al. (2005), superimposes
magnetotelluric estimates of conductivity (warmer colors indicating greater conductivity) over the INDEPTH
seismic reflection profile across the Himalayas and southern Tibetan Plateau. Correlation of high conductivi-
ties with strong crustal reflectors (bright spots) beneath Tibet but north of the main Himalayas thrust (MHT)
has been interpreted to indicate weak, partially molten lower crust beneath the Tibetan Plateau. GHS—Greater
Himalaya Sequence; STD—Southern Tibetan Detachment; ITS—Indus-Tsango Suture. B1 and B2 mark bright
spot reflectors interpreted as fluid bodies (partial melt).
Figure 25. Joint inversion of surface wave and body wave data for
the western United States from Obrebski et al. (2011). The top im-
age (A) used surface waves only, the middle inversion (B) used body
waves only, and the bottom image (C) shows jointly inverted data of
both types. Quantitative analysis of such disparate data sources can
result in much more detailed and robust images of subsurface physi-
cal properties.You can also read