Impacts of Sand and Dust Storms on Oceans - A Scientific Environmental Assessment for Policy Makers - UN ...
←
→
Page content transcription
If your browser does not render page correctly, please read the page content below
Impacts of Sand and
                                Dust Storms on Oceans
                                 A Scientific Environmental
                              Assessment for Policy Makers

United Nations Decade
of Ocean Science
for Sustainable Development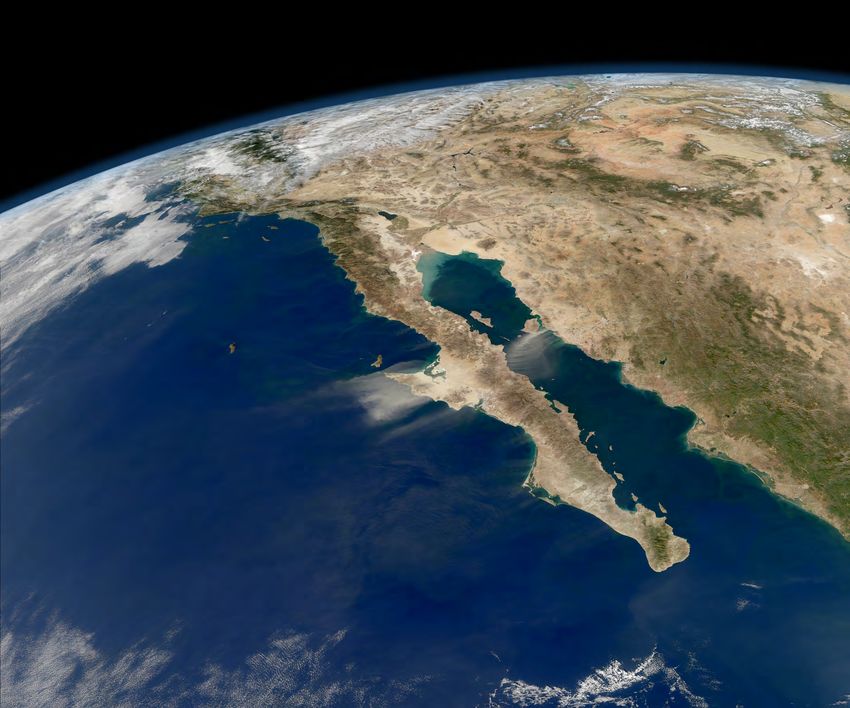
© 2020 United Nations Environment Programme

ISBN No: 978-92-807-3784-4

Job No: DEW/2282/NA

This publication may be reproduced in whole or in part and in any form for educational or non-profit services
without special permission from the copyright holder, provided acknowledgement of the source is made. United
Nations Environment Programme (UNEP) would appreciate receiving a copy of any publication that uses this
publication as a source.

No use of this publication may be made for resale or any other commercial purpose whatsoever without
prior permission in writing from the United Nations Environment Programme (UNEP). Applications for such
permission, with a statement of the purpose and extent of the reproduction, should be addressed to the Director,
Communications Division, United Nations Environment Programme (UNEP), P. O. Box 30552, Nairobi 00100, Kenya.

Disclaimers

The designations employed and the presentation of the material in this publication do not imply the expression of
any opinion whatsoever on the part of United Nations Environment Programme (UNEP) concerning the legal status
of any country, territory or city or its authorities, or concerning the delimitation of its frontiers or boundaries. For
general guidance on matters relating to the use of maps in publications please go to http://www.un.org/Depts/
Cartographic/english/htmain.htm

Mention of a commercial company or product in this document does not imply endorsement by the United Nations
Environment Programme (UNEP) or the authors. The use of information from this document for publicity or
advertising is not permitted. Trademark names and symbols are used in an editorial fashion with no intention on
infringement of trademark or copyright laws.

The views expressed in this publication are those of the authors and do not necessarily reflect the views of the
United Nations Environment Programme (UNEP). We regret any errors or omissions that may have been unwittingly
made.

© Maps, photos, and illustrations as specified.

Cover photograph: Top left, smspsy at Shutterstock.,
Bottom left, Lelechka at Shutterstock,
Right photo, Iuliia Tarabanova at Shutterstock.

Suggested citation

UNEP (2020). Impacts of Sand and Dust Storms on Oceans: A Scientific Environmental Assessment for Policy
Makers. United Nations Environment Programme, Nairobi, Kenya.

www.unep.org

                                                                               UNEP promotes
                                                                           environmentally sound
                                                                            practices globally and
                                                                          in its own activities. Our
                                                                     distribution policy aims to reduce
                                                                           UNEP carbon footprint.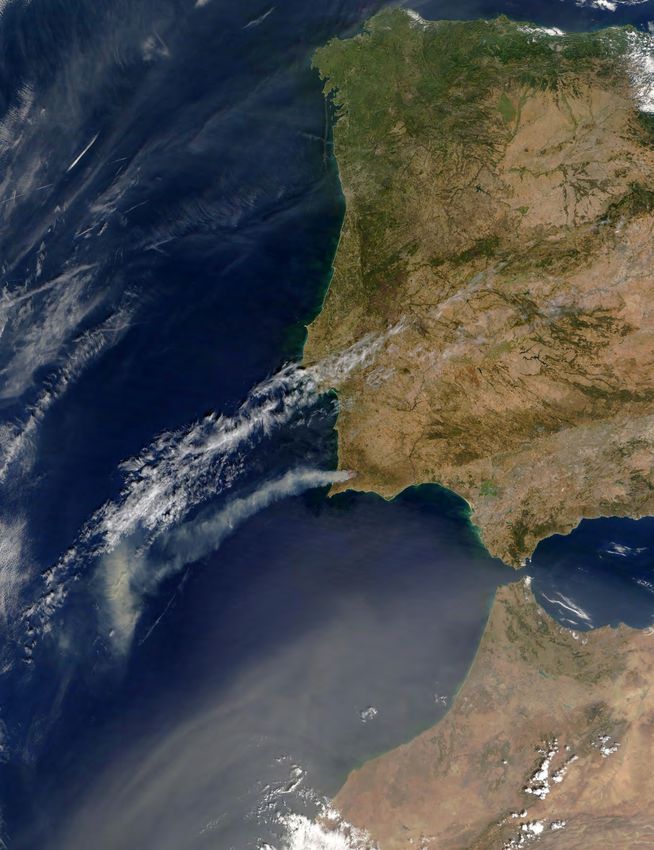
Impacts of Sand and
                                Dust Storms on Oceans
                                 A Scientific Environmental
                              Assessment for Policy Makers

United Nations Decade
of Ocean Science
for Sustainable Development
Acknowledgements
The United Nations Environment Programme (UNEP) would like to thank the author, reviewers, scientific editor
and the secretariat for their contribution to the preparation of this assessment report. The author and reviewers
have contributed to the report in their individual capacities. Their affiliations are only mentioned for identification
purposes.

Author
Nick Middleton (University of Oxford, UK)

Reviewers
Joana Akrofi (UNEP, Kenya), Katye Altieri (University of Cape Town, South Africa), Alex Baker (University of East
Anglia, UK), Sara Basart (Barcelona Supercomputing Center, Spain), Christopher Corbin (UNEP, Jamaica), Robert
Duce (Texas A&M University, Texas, USA), Timothy Jickells (University of East Anglia, UK), Raphael Kudela
(University of California Santa Cruz, USA), Olga Krylova (UNEP, Kenya), Maurice Levasseur (Laval University,
Canada), Joan Llort (University of Tasmania, Australia), Susan Mutebi-Richards (UNEP, Kenya), Slobodan
Nickovic (Republic Hydrometeorological Institute of Serbia, Serbia), Pinya Sarasas (UNEP, Kenya), Gemma
Shepherd (Independent, UK), Zongbo Shi (University of Birmingham, UK), Jan-Berend Stuut (Royal Netherlands
Institute for Sea Research, Netherlands), Santiago Gassó (University of Maryland, Maryland, USA), and six
anonymous reviewers belonging to the Group of Experts on the Scientific Aspects of Marine Environmental
Protection (GESAMP).

Scientific editor
Maarten Kappelle (UNEP, Kenya)

Secretariat and project coordination
Maarten Kappelle and Sofía Méndez Mora (UNEP, Kenya)

Drawings
Jinita Dodhia (Publishing Services Section, UNON, Nairob.) and Sandra Mather (University of Liverpool, UK)

Design, layout and printing
Jinita Dodhia, Pouran Ghaffarpour (Publishing Services Section, UNON, Nairobi, ISO 10041:2004 certification.)

Media and outreach
Philip Amunga, David Cole, Marie Daher-Corthay, Maria Vittoria Galassi, Nancy Groves, Salome Mbeyu Chamanje,
Pooja Munshi, Moses Osani, Keishamaza Rukikare, Laila Saada, Mellab Shiluli, Neha Sud and Carolyn Williams
Gerdes (Communications Division, UNEP).

                                                          ii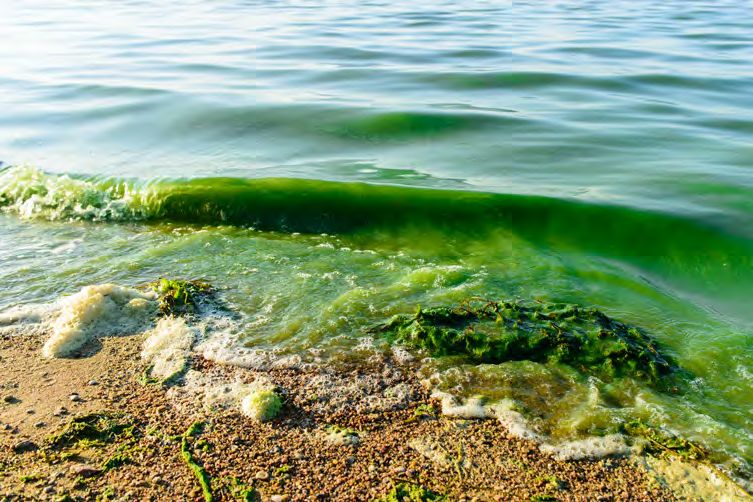
IMPACTS OF SAND AND DUST STORMS ON OCEANS
                                                             A SCIENTIFIC ENVIRONMENTAL ASSESSMENT FOR POLICY MAKERS

Language editing
Strategic Agenda

Thanks also to:
Joana Akrofi (UNEP, Kenya), Alexander Baklanov (WMO, Switzerland), Angeline Djampou (UNEP, Kenya),
Tessa Goverse (UNEP, Kenya), Tito Kimathi (UNEP, Kenya), Rachel Kosse (UNEP, Kenya), Olga Krylova (UNEP,
Kenya), Fred Lerionka (UNEP, Kenya), Jian Liu (UNEP, Kenya), Lu Liu (UNEP, Kenya), Nada Matta (UNEP, Kenya),
Patrick M’mayi (UNEP, Kenya), Pauline Mugo (UNEP, Kenya), Wambui Ndungu (UNEP, Kenya), Mahesh Pradhan
(UNEP, Kenya), Audrey Ringler (UNEP, Kenya), Pinya Sarasas (UNEP, Kenya), Ole Vestergaard (UNEP, Kenya), and
Edoardo Zandri (UNEP, Kenya).

Financial and organizational support
The United Nations Environment Programme (UNEP) would like to thank the Kingdom of Norway and the
Swedish International Development Cooperation Agency (SIDA) for its financial contribution to the preparation,
production, launch and outreach of this report. UNEP is also very grateful to the Global Programme of Action for
the Protection of the Marine Environment from Land-based Activities (GPA), the Global Partnership on Nutrient
Management (GPNM) and the Group of Experts on the Scientific Aspects of Marine Environmental Protection
(GESAMP) for their continuous support to our joint work on oceans and the impact from land-based sources that
affect their health, diversity, integrity, and the numerous ecosystem services the oceans provide to humanity.

                                                       iii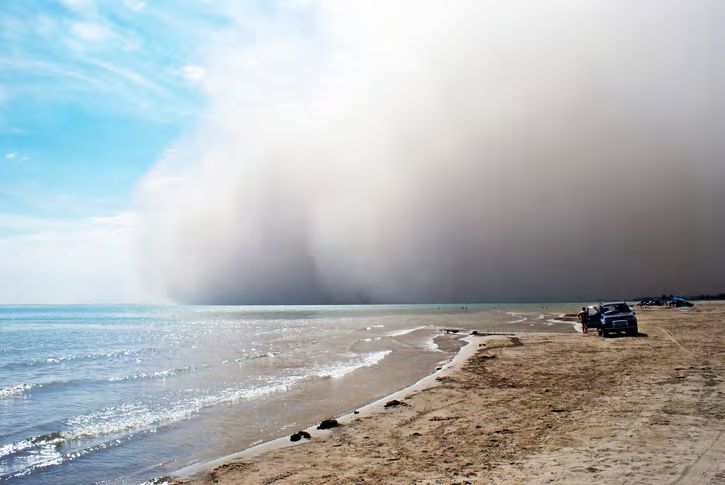
Contents
Acknowledgements .......................................................................................................................................................... ii
Glossary............................................................................................................................................................................... v
Acronyms and abbreviations........................................................................................................................................... vi
List of chemical symbols and elements........................................................................................................................ viii
Executive summary............................................................................................................................................................ xii
1.       Introduction.................................................................................................................................................1
2.       Sand and dust storm definitions................................................................................................................3
3.       Dust storm sources, transport pathways and deposition........................................................................5
4.       Dust and biodiversity..................................................................................................................................11
5.       Dust and global climate..............................................................................................................................21
6.       Policy implications......................................................................................................................................25
7.       Conclusions and recommendations..........................................................................................................27
References............................................................................................................................................................29

List of tables and figures
List of tables
Table 3.1.            Desert dust deposition rates over the oceans..............................................................................7
Table 4.1.            Aerosol metal sources to the atmosphere (Gg yr-1)....................................................................13

List of figures
Figure 3.1.           Plumes of dust blowing north-easterly over the south-west Atlantic from alluvial
                      point sources in Patagonia, Argentina..........................................................................................6
Figure 3.2.           Global sources of desert dust and pathways of long-distance transport..................................7
Figure 4.1.           A huge outbreak of Saharan dust over the Atlantic coast of Mauritania spreading
                      north-westward on 4 March 2004.................................................................................................12
Figure 4.2.           Atmospheric processes that can modify the solubility of iron (both as oxidized iron,
                      Fe(III), and the more soluble reduced Fe(II) form) from dust during transport through
                      the atmosphere. ............................................................................................................................14
Figure 4.3.           Acidity and iron solubility for Saharan dust plumes.....................................................................15
Figure 4.4.           Clearing a beach of Sargassum at Playa del Carmen, Mexico....................................................17
Figure 4.5.           A sea fan coral (Gorgonia ventalina) infected with Aspergillus sydowii ....................................19
Figure 5.1.           The biological carbon pump showing how dust deposition affects stocks
                      (green boxes) and fluxes (blue boxes) which result in an overall sequestration of
                      carbon in deep ocean sedimentation............................................................................................22

                                                                                               iv
IMPACTS OF SAND AND DUST STORMS ON OCEANS
                                                           A SCIENTIFIC ENVIRONMENTAL ASSESSMENT FOR POLICY MAKERS

Glossary

aerosol                       minute particles suspended in the atmosphere
algal bloom                   large proliferations of microalgae involving up to millions of cells per litre
archaea                       type of microbe that emits carbon dioxide into the atmosphere via the process of
                              respiration
aspergillosis                 disease that affects coral; also known as sea fan disease
autotrophy                    mode of nutrition that uses solar radiation as the energy source; the dominant
                              form of autotrophy is photosynthesis
bioaerosol                    minute particles from plant or animal matter, or from microorganisms,
                              suspended in the atmosphere (e.g. bacteria, pollen, spores)
bioavailability               measure of the amount of an element available to organic life
biogenic                      produced or brought about by living organisms
biological carbon pump        process by which photosynthetically produced organic matter in the ocean is
                              exported from the surface to depth by a combination of sinking particles, vertical
                              mixing and transport by animals
calcification                 build-up of calcium salts
combustion                    the process of burning
cryosphere                    portion of Earth’s surface that is frozen throughout the year
cyanobacterium                major type of photosynthetic bacteria that contain a bluish pigment
desiccation                   loss of moisture leading to extreme dryness
dinoflagellate                one-celled aquatic organism
eutrophication                excessive load of nutrients in a body of water
glacial–interglacial cycles   fluctuation between Ice Ages (glacials) and periods of warmer climate
                              (interglacials)
gyre                          large system of circulating ocean currents formed by the Earth’s wind patterns
                              and the forces created by the planet’s rotation
heterotrophic bacteria        type of microbe that emits carbon dioxide into the atmosphere via the process of
                              respiration
heterotrophy                  mode of nutrition that uses carbohydrate as the sole source of energy
Ice Age                       see ‘glacial–interglacial cycles’
immunosuppression             partial or complete suppression of an immune response
marine snow                   decaying material sinking from upper waters to the deep ocean
oligotrophic                  low in nutrients and relatively unproductive in terms of aquatic animal and plant
                              life
pathogenicity                 the property of causing disease
pelagic                       relating to the open sea
photic zone                   layer of the ocean reached by enough sunlight to allow plant growth
photochemistry                chemical effects of light
photophysiological            physiology of processes (e.g. photosynthesis) that involve light
red tide                      algal bloom that discolours the surface of the sea
septicaemia                   a serious infection of the bloodstream
solubility                    property of a substance to dissolve in a liquid
symbiont                      organism living in symbiosis with another
trace metal                   element that normally occurs at a very low level in the environment
troposphere                   the lowest region of the atmosphere

                                                       v
Acronyms and abbreviations
AOD aerosol optical depth
AVHRR Advanced Very-High-Resolution Radiometer
CBD Convention on Biological Diversity
DMS dimethyl sulphide
GESAMP Joint Group of Experts on the Scientific Aspects of Marine Environmental Protection
HAB harmful algal bloom
HNLC high-nutrient, low-chlorophyll
LNLC low-nutrient, low-chlorophyll
MEA Multilateral Environmental Agreement
ppm parts per million
SDG Sustainable Development Goal
SDS sand and dust storms
SST sea surface temperature
UNCCD United Nations Convention to Combat Desertification
UNEP United Nations Environment Programme
UNFCCC United Nations Framework Convention on Climate Change
WMO World Meteorological Organization
Note on units of mass:
g (grams) are used throughout this report for consistency.
Gg (Gigagram) = one thousand tonnes.
Tg (Teragram) = one million tonnes
viIMPACTS OF SAND AND DUST STORMS ON OCEANS
A SCIENTIFIC ENVIRONMENTAL ASSESSMENT FOR POLICY MAKERS
Satellite view North Africa and South of Europe. Sahara dust over Atlantic ocean and fires in Portugal. Elements of this image furnished by NASA.
Photo by elRoce
viiList of chemical symbols and elements
Symbol Element
Al aluminium
Ca calcium
Cd cadmium
Co cobalt
Cu copper
Fe iron
K potassium
Mg magnesium
Mn manganese
N nitrogen
Ni nickel
P phosphorus
Pb lead
Si silicon
Ti titanium
Zn zinc
viiiIMPACTS OF SAND AND DUST STORMS ON OCEANS
A SCIENTIFIC ENVIRONMENTAL ASSESSMENT FOR POLICY MAKERS
Haboob dust storm in the Arizona desert
Photo: John D Sirlin at Shutterstock
ixForeword
Links between oceans and land are innumerable. Each year sand and dust
storms (SDS) carry an estimated half a billion tonnes of minerals, nutrients and
organic and inorganic matter to oceans from the world’s deserts and semi-
deserts. This material helps drive biogeochemical cycles, including nitrogen,
carbon and sulphur cycles, that are necessary for Earth system functions.
Desert dust is a principal driver of oceanic primary productivity, which forms the
base of the marine food web and fuels the global carbon cycle. The fertilizing
effect of desert dust is thought to have an impact on algal blooms and may
contribute to Sargassum seaweed mats. Potential links have also been identified
between microorganisms, trace metals and organic contaminants carried
in desert dust and some of the complex changes on coral reefs observed in
numerous parts of the world.
This report sums the current state of knowledge on these important connections. This knowledge, though
imperfect, has significant implications for a number of Sustainable Development Goals (SDGs), particularly SDG
14 on Life Below Water and SDG 15 on Life on Land. Publication of this report is timely, coming at the start of
the United Nations Decade of Ocean Science for Sustainable Development (2021–2030), as well as the United
Nations Decade on Ecosystem Restoration (2021–2030). The restoration of degraded land can reduce sand and
dust emissions and is recognized as a strong vehicle for driving implementation of the United Nations Convention
to Combat Desertification (UNCCD). The interlinkages between SDS and marine productivity, and hence
biodiversity, will inform discussions at the Conferences of the Parties to various United Nations conventions,
such as the United Nations Convention on Biological Diversity (CBD), the United Nations Framework Convention
on Climate Change (UNFCCC), and the UNCCD.
Sound environmental policy must be based firmly on good science. One of the clear messages from this report
is the simple fact that many aspects of the impacts of SDS on the oceans are only partially understood. Despite
the limited knowledge, the impacts of SDS on oceans—their ecosystem functions, goods and services—are
potentially numerous and wide-ranging, thus warranting continued careful monitoring and research.
Jian Liu
Director, Science Division
United Nations Environment Programme
xIMPACTS OF SAND AND DUST STORMS ON OCEANS
A SCIENTIFIC ENVIRONMENTAL ASSESSMENT FOR POLICY MAKERS
Plumes of desert dust blowing from the Sonoran Desert and Baja California, north-west Mexico
Photo: NASA on The Commons
xiExecutive summary
Sand and dust storms (SDS) are common in deserts and semi-deserts when strong winds blow over dry soils
with little or no vegetation. Dust generated by SDS is often raised high into the atmosphere and transported over
long distances, frequently over the oceans. These atmospheric events are important for ecosystem functioning,
with a wide range of effects on the Earth system. Given the hazards they pose to society, and the threats implied
to the achievement of several Sustainable Development Goals (SDGs), they have also become an issue of
increasing concern to governments and the international community.
SDS vary in frequency and intensity over multiple timescales. They are highly seasonal and can vary significantly
from year to year. They also respond to drought periods and other drivers such as El Niño–Southern Oscillation
and the North Atlantic Oscillation. Deserts in the northern hemisphere (northern Africa; the Middle East; south-
west, central and north-east Asia) are the largest and most persistently active SDS sources, with smaller, less
active sources located in North and South America, southern Africa, Australia and Iceland. The relative importance
of naturally emitting wind erosion sources, as compared with those significantly influenced by human action—
largely via poor agricultural management and excessive water use—is unclear, but the Sahara is the world’s
largest source of desert dust. It produces around 55 percent of all global dust emissions, with marked effects on
the North Atlantic Ocean, the Caribbean Sea, the Mediterranean Sea and the Red Sea.
Each year, SDS carry an estimated average of half a billion tonnes of minerals and nutrients, organic and inorganic
matter to the oceans. This desert dust has a range of effects on marine biodiversity. Dust provides a major
source of externally supplied nutrients and trace metals. These elements are essential for all life forms and their
atmospheric supply can exert control over ocean primary production via single-celled organisms collectively
known as phytoplankton. This key metabolic process drives biogeochemical cycles in the oceans, including the
carbon, nitrogen, sulphur, phosphorus and silicon cycles.
The fertilizing effect of desert dust is also thought to have an impact on algal blooms, which are an important
food source for marine life, although some—dubbed harmful algal blooms (HABs)—may have detrimental effects
on human health and economic activity. Dust deposition may also play a role in the unusually large blooms of
floating Sargassum seaweed mats that have been noted since 2011 in the Caribbean Sea and the Atlantic Ocean
along the coastlines of western Africa and Brazil. The cause of these blooms is a matter for debate, but nutrients
in desert dust may enhance the growth of Sargassum.
Links have been found between desert dust and coral reef systems. The health of such reefs responds to
numerous, frequently interlinked issues, but disease has been important in recent worldwide coral reef declines,
and a number of diseases that affect coral are associated with microorganisms carried in desert dust. Dust
deposition may be one of a range of influences that stress coral reefs, reducing their resilience to other factors
that can cause their health to deteriorate.
Dust has significant impacts on weather and climate in several ways. One impact probably occurs indirectly
via dimethyl sulphide (DMS) released from phytoplankton fertilized by iron-rich desert dust, which creates local
climate feedbacks via additional cloud condensation nuclei. Dust also exerts indirect impacts on the climate
system due to the part it plays in the global carbon cycle—a role stemming from further interactions between
desert dust and the microorganisms responsible for primary production. The ‘biological carbon pump’ results in
carbon being sequestered into the oceans from the atmosphere, with consequent feedback effects on climate.
This occurs through carbon dioxide and nutrients being transformed into organic carbon, which sinks to the
deep ocean, decomposes and becomes buried in sediment. The Southern Ocean, where primary productivity is
limited by iron deficiency, could be particularly important in the operation of the biological carbon pump.
There are still considerable uncertainties around how SDS interact with the oceans and consequences for other
parameters of the Earth system. This report highlights critical areas for further monitoring and study and where
research can inform appropriate policy development. Understanding SDS and the long-range transport of desert
dust to oceans is relevant to the three Rio conventions: the Convention on Biological Diversity (CBD), the United
Nations Framework Convention on Climate Change (UNFCCC), and the United Nations Convention to Combat
Desertification (UNCCD).
xiiIMPACTS OF SAND AND DUST STORMS ON OCEANS
A SCIENTIFIC ENVIRONMENTAL ASSESSMENT FOR POLICY MAKERS
It also has significant implications for a number of SDGs, particularly SDG 14 on Life Below Water and SDG 15
on Life on Land, and demonstrates the interdependencies between the SDGs. This report’s publication is timely,
coming at the beginning of the United Nations Decade of Ocean Science for Sustainable Development (2021–
2030), as well as the United Nations Decade on Ecosystem Restoration (2021–2030).
Dust storms in Southern Africa
Photo: NASA Earth Observatory
xiiiFishing vessel at sea
Photo: Bjoern Wylezich at Shutterstock
xivIMPACTS OF SAND AND DUST STORMS ON OCEANS
A SCIENTIFIC ENVIRONMENTAL ASSESSMENT FOR POLICY MAKERS
1. Introduction
Large quantities of small particles are eroded by Significant quantities of these mineral dust particles
wind from soil surfaces in many parts of the world (hereafter, simply ‘desert dust’, ‘dust particles’ or ‘dust’)
to generate sand and dust storms (SDS). These emitted from land surfaces are deposited episodically
events are most common in deserts and semi- on the oceans. One of the first western scientific
deserts because soils in these areas are typically papers to address the relationships between desert
dry and unconsolidated, with little or no vegetation dust and the marine environment was published
cover; conditions that enable the erosion of surface by Charles Darwin, who observed Saharan dust
sediment by wind. These atmospheric events have a deposited on his ship in the Atlantic Ocean in the early
wide variety of effects on the hydrosphere, lithosphere, 19th Century (Darwin, 1846). Dust has impacts on
biosphere, atmosphere and cryosphere and they are marine biogeochemistry, primary productivity, carbon
important for ecosystem functioning. Hence, the dust storage and deep-sea sedimentation. Its deposition
cycle has been recognized as an integral part of Earth brings nutrients to ocean surface waters and the
system science (Shao et al., 2011; Knippertz and seabed, in places enhancing primary production, with
Stuut, 2014). impacts on the global nitrogen, carbon and sulphur
cycles. In coastal waters in particular, nutrients in
On land, SDS represent a significant hazard to human desert dust can in some circumstances trigger algal
society, not only in deserts and semi-deserts, but also blooms. Although these blooms are an important
to people living beyond these dryland regions because food source for much marine life, they can sometimes
dust haze is often transported over large distances be harmful to marine wildlife, human health and
(Kellogg and Griffin, 2006). There are numerous economic activity. Potential links have also been
consequences for human populations, including identified between constituents of desert dust and
threats to agriculture, health, electricity generation, some deleterious changes monitored on coral reefs
and the transport industry (Middleton, 2017). These in numerous locations worldwide.
hazardous impacts have brought SDS to the attention
of the United Nations General Assembly, resulting This report examines the state of knowledge of how
in the adoption of resolutions entitled “Combating SDS impact marine ecosystems. These impacts,
sand and dust storms” in 2015 (A/RES/70/195), 2016 both direct and indirect, are inevitably also relevant
(A/RES/71/219), 2017 (A/RES/72/225), 2018 (A/ to human society. In part, the impacts may be
RES/73/237) and 2019 (A/RES/74/226). Also notable hazardous, but the perception of any threats should
are UN Environment Assembly resolution 2/21 and be balanced by an appreciation of the significance of
United Nations Economic and Social Commission for desert dust to the Earth system. Actions to implement
Asia and the Pacific (ESCAP) resolution 72/7, both the recommendations presented at the end of this
concerning SDS. These resolutions recognize the report should also take into account all aspects of
threats posed by SDS to livelihoods, the environment SDS impacts on marine ecosystems.
and the economy and acknowledge that they can
hinder the achievement of several Sustainable
Development Goals (SDGs).
1Sandstorm in Jordan
Photo: Ahmad A Atwah at Shutterstock
2IMPACTS OF SAND AND DUST STORMS ON OCEANS
A SCIENTIFIC ENVIRONMENTAL ASSESSMENT FOR POLICY MAKERS
2. Sand and dust storm definitions
Small particulate matter found in the atmosphere can viruses), and pollutants derived from anthropogenic
be derived from numerous sources. Such material activities such as industry and agriculture (Goudie
includes sea salt, volcanic dust and industrial and Middleton, 2006). The airborne particles of
pollutants, but this report is concerned with particles biogenic origin, including fragments from living
that are eroded by wind from land surfaces. The organisms (such as pollen and spores), also include
distinction between sand storms and dust storms is elements derived from plant and animal matter, such
not clear-cut since there is a continuum of particle as nitrogen (N) and phosphorus (P) (Gross et al., 2016;
sizes in any storm, comprising clay-sized (less Stockdale et al., 2016).
than 4 micrometres, or μm, in diameter); silt-sized
(4 to 62.5μm); and sand-sized (62.5μm to 2 mm), Material entrained from the land surface can be
adopting the commonly used standardized grade lifted to considerable altitudes and transported great
scale described by Wentworth (1922).1 The World distances by high-altitude winds. This long-distance
Meteorological Organization (WMO) defines a dust transport results in individual dust events affecting
storm or sand storm as an ensemble of particles huge areas, in some cases more than 100,000 km2.
lifted to great heights by a strong and turbulent wind Sand storms, however, have typically more localized
that reduces visibility, normally assessed at 1.8 m effects, including sand dune encroachment. Hence,
above the ground, to less than 1,000 m. most of the SDS impacts on the oceans stem from
dust particles rather than sand.
In mineralogical terms, sand and dust particles
from the low- to mid-latitudes are mainly composed
of quartz, clay minerals (including illite, smectite,
chlorite and kaolinite), feldspar, plagioclase, calcite
and iron oxides (such as hematite and goethite)
(Shi et al., 2005; Formenti et al., 2008; Nowak et al.,
2018). Dust particles from the high latitudes may
have significantly different mineralogy. In chemical
terms, sand and dust are composed of silicon dioxide
(SiO2), aluminium oxide (Al2O3), iron oxide (Fe2O3
and FeO), calcium oxide (CaO), magnesium oxide
(MgO) and potassium oxide (K2O), with their relative
abundance dependent on the sediment in the source
area (Krueger et al., 2004).
Other biochemically important elements commonly
present in trace quantities in desert dust include
titanium (Ti), manganese (Mn) and copper (Cu).
Generally, the concentrations of most major
elements (Si, Al, Fe, Mg, Ca, K, in approximate order
of importance) replicate the composition of the upper
continental crust, although there is considerable
variability between samples (Lawrence and Neff,
2009). Many SDS source areas also contribute a
variety of salts, appreciable quantities of organic
matter, microorganisms (such as fungi, bacteria and
Sand particles
Photo: jorik at Shutterstock
1
In air quality and aerosol research literature, the terms ‘fine aerosols’ (~1 μm) are also frequently used.
3Remnant of the desiccated Aral Sea
Photo credit: Patrick Schneider/ Unsplash
4IMPACTS OF SAND AND DUST STORMS ON OCEANS
A SCIENTIFIC ENVIRONMENTAL ASSESSMENT FOR POLICY MAKERS
3. Dust storm sources, transport pathways and deposition
The locations of major contemporary SDS source Aral Sea in Kazakhstan and Uzbekistan (Issanova et
areas are generally known (although knowledge al., 2015). Enhanced wind erosion can also occur in
about them is still imperfect) and there is substantial poorly managed and abandoned farming areas, as
information on long‐distance desert dust transport Moridnejad et al. (2015) report from parts of Iraq and
(Ginoux et al., 2012). Comparatively, dust deposition Syria.
is less well known since measurements are relatively
few and incomplete, although modelling is helping to Indeed, a compilation of data from sedimentary
fill this gap (Shao et al., 2011). archives extracted from many parts of the world
suggests that dust emissions have at least doubled
over the past ~250 years, a period that has seen the
3.1. SDS sources creation and widespread expansion of ‘industrial
agriculture’ (Hooper and Marx, 2018). Nonetheless,
Earth’s main present-day sources of desert dust have making the distinction between anthropogenic
been identified using observations from terrestrial effects and natural drivers of wind erosion is not
meteorological stations and an array of sensors a straightforward task, even in well-documented
carried by satellites. These sources are primarily in locations (Middleton, 2019). As Webb and Pierre
northern hemisphere desert regions, forming a broad (2018, p. 286) put it, “While the impacts of land use
swathe of territory that is often dubbed the Dust Belt activities and land management on aeolian processes
(Prospero et al., 2002), stretching from the Sahara in can be profound, the interactions are often complex
western Africa across the Middle East and deserts and assessments of anthropogenic dust loads at all
of south-west and central Asia to the Taklimakan scales remain highly uncertain.”3
and Gobi Deserts of north-east Asia. Lesser—though
locally important—sources are in other desert regions, The scale of wind erosion sources that are significantly
including in the Americas (for example Mojave, influenced by human activity is therefore debatable,
Sonoran, Nazca and Atacama Deserts), southern with estimates of their relative contribution to global
Africa (Namib and Kalahari Deserts) and the deserts dust emissions ranging from 50 percent (Mahowald and Luo, 2003). This
areas are in low latitudes, but an estimated 5 percent high degree of uncertainty is attributable both to the
of global desert dust is emitted from high-latitude aforementioned complexities and to the relative lack of
sources. These include the Patagonian Desert in detailed information on many dust source areas (UNEP,
Argentina and Antarctica in the southern hemisphere; WMO, UNCCD, 2016). Ginoux et al. (2012) suggest that
Iceland, Greenland, and parts of the North American 75 percent of global dust emissions come from natural
sub-Arctic such as Alaska and the Yukon in the sources, with anthropogenic sources accounting for 25
northern hemisphere (Bullard, 2017). percent, although this assessment indicates significant
regional variability, with the authors concluding
Within these broad dryland areas, dust sources that anthropogenic dust emission sources make a
are often highly localized and specific. Typical larger contribution (75 percent) in Australia. These
dust-producing desert surfaces include large proportions are not fixed, since wind erosion rates
internal drainage basins, ephemeral dry lakes,2 vary over time and space. At anthropogenic sources,
alluvial deposits, and piedmont alluvial fans (Figure greater amounts of sediment are eroded on occasion
3.1). In high latitudes, glacial outwash plains are due to mismanagement, often in combination with
characteristically rich in dust-sized material. Many adverse climate conditions (McLeman et al., 2014), or
sources produce dust naturally, but erosion also occurs less sediment is produced when subject to successful
in environments where human mismanagement wind erosion control practices (Middleton and Kang,
has rendered them susceptible to wind action. Such 2017).
conditions arise in lake beds that have dried out due
to excessive water use, a classic example being the
2
Ephemeral lakes, which are often high in salts, have many regional names, including chott, sebkha, salar, playa and pan.
3
Future trends in dust emissions as a result of human-induced climate change are equally uncertain. They will depend on numerous factors, not least
changes in atmospheric circulation and precipitation totals, timing and patterns. Such dust emission changes are also likely to vary geographically (Jia
et al., 2019).
5Figure 3.1. Plumes of dust blowing north-easterly 3.2. Long-distance dust transport
over the south-west Atlantic from alluvial
point sources in Patagonia, Argentina Many studies have noted that desert dust is frequently
transported through the troposphere over great
distances (>1,000 km), hence affecting biogeochemical
conditions far from dust sources. Such long-distance
transport tends to be dominated by fine dust particles,
with diameters typically smaller than ~20μm, simply
because larger particles settle out sooner due to
gravitational forces. However, long-distance transport
events can also include aggregates of fine particles
and single sand-sized particles (>62.5μm) that may
comprise an important part of the total mass delivered
to remote oceans (van der Does et al., 2018).
The global pattern of major dust transport pathways,
most of them over the oceans, is depicted in Figure
3.2. Dust events can also incorporate other material
picked up in the atmosphere through which they
pass (Meskhidze et al., 2005). In some world regions
(for example north-east Asia and southern Europe),
dust haze typically combines with a variety of
anthropogenic pollutants during transport (Luo et al.,
2020).
Many of these long-distance dust flows are highly
seasonal and can vary significantly from year to
year. Most soil material transported from deserts in
China and Mongolia across the Bohai Sea and out
over the North Pacific is mobilized during the spring
Source: NASA MODIS image months (March–May). Dust from sources in southern
Mesopotamia is commonly transported down the
The world’s largest source of desert dust is widely Arabian Gulf by the north-westerly Shamal, a dust-
regarded to be the Sahara Desert, which produces laden wind that blows from February to October.
an estimated 55 percent of all global dust emissions Much Saharan dust is transported south-westward
(Ginoux et al., 2012), and its most active dust by the Harmattan wind that prevails between October
source: the Bodélé Depression, site of an ancient and April. The westward trajectory of Saharan dust
lake bed (Goudie and Middleton, 2001). Overall, total events transported over the North Atlantic also
emissions of desert dust to the global atmosphere are shifts with the seasons. Saharan dust monitored at
estimated to range from 1,000 to 3,000 Tg per year, Cayenne, French Guiana, in South America peaks in
or 1 to 3 billion tonnes (see for example Miller et al., March and April, while the peak months for Saharan
2004; Tegen and Fung, 1994; Huneeus et al., 2010). dust at Miami, Florida, USA, in North America are July
Most of these estimates are produced using models and August.
because actual measurements are geographically
scarce and temporally infrequent, although the use of The intensity and frequency of SDS also fluctuate
geostationary satellites is improving our capacity to over longer timescales, responding to drivers such
monitor dust emissions. as drought (Middleton, 1985), El Niño–Southern
Oscillation (Banerjee and Kumar, 2016) and the
North Atlantic Oscillation (Moulin et al., 1997). The
quantities of North African dust transported to the
Caribbean increased markedly in the early 1970s, a
rise attributed largely to the drought prevailing in the
Sahara/Sahel region (Prospero and Lamb, 2003).
6IMPACTS OF SAND AND DUST STORMS ON OCEANS
A SCIENTIFIC ENVIRONMENTAL ASSESSMENT FOR POLICY MAKERS
Figure 3.2. Global sources of desert dust and pathways of long-distance transport.
Dust sources
Moderately persistent Major transport
Highly persistent pathways
Source: Adapted from Muhs et al., 2014.
After peaking in the early 1980s, trans-Atlantic dust Table 3.1. Desert dust deposition rates over the
flows from western Africa decreased by about 10 oceans
percent per decade (between 1982 and 2008), based
on measurements of dust aerosol optical depth (AOD) Ocean Deposition Reference
over the mid-North Atlantic from the Advanced Very- (Tg yr−1)
High-Resolution Radiometer (AVHRR) satellite-borne North Atlantic 202 Jickells et al. (2005)
instrument. This declining trend, which persisted Indian Ocean 118 Jickells et al. (2005)
throughout both summer and winter (Ridley et al.,
North Pacific 72 Jickells et al. (2005)
2014), was viewed by Wang et al. (2012) as part of
Mediterranean 40 Guerzoni et al.
a multi-decadal co-variability of North Atlantic sea
Sea (1999)
surface temperature (SST) and Sahelian precipitation
and dust, while Kim et al. (2017) highlighted the South Pacific 29 Jickells et al. (2005)
strong correlation between surface wind speeds over South Atlantic 17 Jickells et al. (2005)
the Sahara and the decreasing dust emission trend. Arctic Ocean 6 Shevchenko and
Lisitzin (2004)
All oceans 477 Mahowald et al.
3.3. Dust deposition (2010)
There are three principal ways in which dust is Source: Guieu et al. 2014a
deposited: by settling due to the force of gravity;
through turbulent dry deposition, or via the scavenging Saharan dust) and in parts the North Pacific (dust
of particles in raindrops (‘wet deposition’). In situ originating from north-east Asia).
measurements of dust deposition to the open ocean
are even less common than such measurements over Globally, dust emissions are approximately one tenth
land (Schulz et al., 2012), but estimates of dust inputs of the mass of material delivered to the oceans
(i.e. dry + wet deposition) to the world oceans are by rivers, although the relative importance varies
around 500 Tg annually (Jickells et al., 2005). Annual greatly by region (Bullard and Baddock, 2019). Dust
total deposition rates to major world oceans, derived flux exceeds fluvial sediment flux in North Africa (six
mostly from modelled data, are shown in Table 3.1. times higher) and the Middle East (twice as high), and
Maximum dust deposition per unit area (about 10 g they are the same order of magnitude in Australia.
m-2 yr-1) occurs in parts of the North Atlantic (from Elsewhere, dust emissions are either negligible, as in
7Europe, or far exceeded by riverine transport to the forthcoming chapters. The presence of submicron oceans. It is also important to note that atmospheric (
IMPACTS OF SAND AND DUST STORMS ON OCEANS
    A SCIENTIFIC ENVIRONMENTAL ASSESSMENT FOR POLICY MAKERS

                                                         Barracuda
                                  Photo: Rich Carey at Shutterstock

9
Algal blooms on a beach
Photo: smspsy at Shutterstock.
10IMPACTS OF SAND AND DUST STORMS ON OCEANS
A SCIENTIFIC ENVIRONMENTAL ASSESSMENT FOR POLICY MAKERS
4. Dust and biodiversity
4.1. Ocean primary production nutrients, and the nutrient in shortest supply relative
to cellular requirements limits primary production.
Desert dust generated by SDS provides a major source Iron, which is a particularly important micronutrient
of externally supplied nutrients and trace metals to limiting primary production, is commonly available in
the oceans (Mahowald et al., 2018). These elements dust mobilized from arid regions (see chapter 2) and
are essential for all life forms and their atmospheric desert dust represents the most important source
supply can exert control over ocean primary of iron from the atmosphere to the open oceans
production (Jickells and Moore, 2015). The effect (Mahowald et al., 2018).
on marine primary productivity occurs principally
through the impacts of dust-borne nutrients on Oceanographers recognize two broad regimes in
single-celled photosynthetic organisms collectively which nutrient limitation in upper ocean waters affects
termed ‘phytoplankton’, which are responsible for the phytoplankton. Certain areas are characterized by high
vast majority of new organic material production in levels of macronutrients (i.e. nitrogen and phosphate)
marine waters. Inputs from atmospheric deposition but biological production that is paradoxically low. In
at some oceanic locations have been shown to these so-called high-nutrient, low-chlorophyll (HNLC)
induce phytoplankton growth, enhance the fixation marine areas, the relative lack of the micronutrient
of nitrogen, and change phytoplankton species iron is thought to often limit productivity.6 This has
dynamics. These inputs can also intensify carbon been shown by a number of laboratory and in situ
sequestration via the biological pump and affect experiments where chlorophyll concentrations
ocean dimethyl sulphide (DMS) emissions, in turn in surface waters increased proportionally to the
affecting cloud albedo (see chapter 5). addition of iron (Boyd et al., 2007). These areas are
predominantly at high latitudes and include the vast
4.1.1. Phosphorus, nitrogen and iron Southern Ocean and the sub-Arctic North Pacific
Ocean. Although Fe is the main limiting factor in
The nutrients best studied in these respects are the these HNLC areas, there is an ongoing debate on
macronutrients phosphorus (P) and nitrogen (N), and the geographical patterns and importance of co-
the micronutrient iron (Fe), all of which can play a limitation by vitamins and micronutrients other than
significant role in marine primary production.5 Field iron (Moore et al., 2013; Hutchins and Boyd, 2016).
observations, experiments (both in the laboratory
and in situ), and numerical modelling simulations In contrast to HNLC areas, some 60 percent of
have established links between atmospheric the global ocean (including the Caribbean and
deposition of dust and increases in ocean chlorophyll Mediterranean seas, and the subtropical oceanic
concentrations, a proxy for phytoplankton biomass gyres—large systems of circulating ocean currents) is
(Jickells et al., 2005; Doney et al., 2007; Gallisai et oligotrophic, comprising areas that are characterized
al., 2014). There are two main ways in which the as low-nutrient, low-chlorophyll (LNLC). In these LNLC
deposition of nutrients available in desert dust can regions, dust-supplied phosphorus and iron, either on
stimulate the growth of phytoplankton in the oceans, their own or in combination, have had demonstrable
if the receiving ecosystem is limited by an element effects on phytoplankton growth, both directly (by
present in the dust deposited: alleviating nutrient limitation) and/or indirectly (by
P and/or Fe stimulating N fixation). These impacts
• directly, by supplying P and/or Fe, alleviating have been studied in various locations, including
limitation by these nutrients the Mediterranean Sea (Guieu et al., 2014b), the
• indirectly, when dust supplying P and/or Fe Caribbean Sea (Chien et al., 2016), the Yellow Sea
stimulates N fixation, alleviating N limitation (Liu et al., 2013) the Gulf of California (Arellano‐Torres
et al., 2020) and the subtropical North Atlantic gyre
The growth of marine primary producers such as (Neuer et al., 2004).
phytoplankton, which form the base of the ocean’s
food web, is controlled by the availability of light and
5
Dust also plays a role in the world ocean silica (Si) cycle, with important implications for marine primary production (Tréguer and De La Rocha, 2013).
6
Other possible reasons for the surprisingly limited phytoplankton growth in these areas include light limitation and grazing pressure.
11Generally, desert dust is considered to be an year record of air parcel trajectories from Australia’s
important source of the macronutrient P,7 particularly major dust source, the Kati Thanda-Lake Eyre Basin.
in oligotrophic parts of the open ocean where These authors suggested that the biological response
there is little input from other new nutrient sources of ocean waters to dust-derived nutrients varies
such as rivers, groundwater discharge or sediment seasonally and that marine biological receptivity to the
resuspension (Jickells et al., 2005). nutrients delivered in dust is often not in synchrony with
the timing of dust deposition in the Tasman Sea and
One area where productivity is considered to be Southern Ocean south of latitude 45°S.
colimited—by Fe and P—is the tropical North Atlantic,
where the addition of Saharan dust has been shown In lower latitudes, where biological receptivity
to stimulate N fixation, presumably by supplying both extends throughout the year, Ohde and Siegel (2010)
Fe and P (Mills et al., 2004). The tropical North Atlantic observed time lags of up to 16 days between Saharan
receives large amounts of Saharan dust, principally dust storm events and enhanced chlorophyll-a
during the summer months via wet deposition (van concentrations off north-west Africa, where coastal
der Does et al., 2020). The observation that nitrogen- upwelling provides a more significant nutrient supply.
fixing organisms (for example, Trichodesmium, a This study over the period 2000–2008 also found that
marine cyanobacterium) are much more abundant in out of 57 strong dust storms assessed (an example
the tropical North Atlantic than in the tropical South is shown in Figure 4.1), just six events were clearly
Atlantic (where dust inputs are low) is another piece related to enhanced phytoplankton growth. Episodic
of evidence to support links between desert dust dust storms also provide an input of nutrients to
inputs and marine biogeochemical responses. phytoplankton blooms in the highly productive
In a study of phytoplankton response to the input Figure 4.1. A huge outbreak of Saharan dust over the
of desert dust in the north-west Pacific Ocean, Atlantic coast of Mauritania spreading
Zhang et al. (2019) found that the addition of dust north-westward on 4 March 2004
changed the relative importance of phytoplankton of
different body sizes, the so-called size structure of
the phytoplankton community, with a shift towards
larger cells with increasing dust deposition. Similarly,
strong changes in phytoplankton abundance and
bacterial community composition were measured in
response to Saharan dust deposition events in the
subtropical western Atlantic (Borchardt et al., 2020).
Shifts in phytoplankton size structure have also been
noted in experimental work on dust inputs to marine
ecosystems (for example, Lekunberri et al., 2010).
Phytoplankton size structure influences the trophic
organization and food web dynamics of pelagic
ecosystems (Finkel et al., 2009).
However, the above generalizations on links between
dust-derived nutrient inputs and marine primary
production are not necessarily universal. The influence
of dust on fertilization in the equatorial Pacific is
disputed (Jacobel et al., 2019) and dust deposition
is also a source of particles that can scavenge iron,
so that in some areas the addition of dust can result
in a decrease of dissolved Fe (Ye and Völker, 2017).
Evidence is equivocal for phytoplankton responses to
dust deposition in Australian waters (Gabric et al., 2010;
Mackie et al., 2008) leading Cropp et al., (2013) to adopt
a climatological approach to the issue, analysing a 20- Source: NASA MODIS
7
By contrast, dust itself is a minor source of nitrogen delivery to the ocean (Jickells et al., 2017).
12IMPACTS OF SAND AND DUST STORMS ON OCEANS
A SCIENTIFIC ENVIRONMENTAL ASSESSMENT FOR POLICY MAKERS
Arabian Sea. Banerjee and Kumar (2014) assessed found that the dust event that increased phytoplankton
chlorophyll-a during the winter monsoon period and growth had been acidified by a relatively large amount
concluded that some blooms, but not all, could be of atmospheric sulphur dioxide pollution from
attributed to dust deposition events. In the Arabian industrial plants in China (see section 4.1.3).
Gulf, no close temporal coupling between dust storms
and productivity was found by Al-Najjar et al. (2019), 4.1.2. Other trace elements
but they still highlighted the importance of dust as
a source of nutrients to the ecosystem. Their study A suite of other trace metals commonly contained
concluded that the dust rapidly sinks to the seabed in desert dust also have implications for marine
where the nutrients Fe and P are liberated through productivity. Some of the most significant metals
iron reduction. Nutrient liberation from the seabed is in this respect are zinc (Zn), cobalt (Co), nickel (Ni),
slow and its transport from the seabed to the photic manganese (Mn) and copper (Cu), all of which
zone by circulation processes is irregular. comprise significant components of key enzymes
for marine phytoplankton and bacteria physiology
Further questions are raised by Torfstein and Kienast (Jickells and Moore, 2015). Indeed, some studies
(2018) in their four-year study of high‐resolution suggest many of these elements could be responsible
records of chlorophyll concentrations and desert for co-limitation of marine phytoplankton or bacterial
dust concentrations in the oligotrophic Gulf of growth, although the evidence is equivocal (Moore et
Aqaba, in the northern Red Sea. They found no al., 2013). By contrast, certain elements such as Cu
significant correlation between dust and chlorophyll are toxic at high concentrations to some plankton and
concentrations, even allowing for possible time may therefore inhibit biological productivity (Paytan et
lags between cause and effect. This finding applied al., 2009). In several cases, desert dust is the primary
to both seasonal dust activity and individual dust atmospheric source of these trace metals to the
events, suggesting that the role of dust as a control oceans (Table 4.1).
on productivity in the Gulf of Aqaba may have been
overestimated. As with N, P and Fe, understanding the precise role
of desert dust is further complicated by other aerosol
Another complicating factor in attempts to assess sources of trace metals, including anthropogenic
links between dust deposition and marine primary combustion. In a recent review of aerosol trace metal
productivity occurs in areas where desert dust impacts on marine microorganisms, Mahowald et
becomes mixed with anthropogenic atmospheric al. (2018) suggested available estimates indicate
pollutants. For instance, Meskhidze, Chameides and that desert dust dominates for Al, Ti, Mn and Fe,
Nenes (2005) used a model to compare two dust although combustion sources (both biomass fires
plumes from the Gobi Desert, one of which appeared and industrial processes) may also contribute to
to stimulate enhanced phytoplankton growth in the those elements and may be particularly important for
North Pacific Ocean, while the other did not. They Cu, Zn and Pb.
Table 4.1. Aerosol metal sources to the atmosphere (Gg yr-1)
Metal Anthropo- Dust Fire Biogenic Sea spray Volcanic Total
genic
Aluminium 3,000 80,000 2,000 200 1,000 5,000 90,000
Titanium 2 8,000 6 8,000
Manganese 10 900 20 30 2 40 1,000
Iron 700 50,000 1,000 200 200 9,000 60,000
Copper 30 20 20 3 10 9 100
Zinc 60 60 100 5 50 10 300
Cadmium 3 0 0 0.2 0 9 10
Lead 100 6 30 2 5 4 200
Sum 4,000 140,000 3,000 400 1,000 14,000 160,000
Source: Mahowald et al., 2018.
134.1.3. Bioavailability of elements converted to a soluble form has a predominant focus
on iron (Baker and Croot, 2010). These studies have
The biological impact of desert dust deposited in the identified a range of complex chemical processes
oceans depends on a number of factors, not least affecting particles during atmospheric transport
the composition of the dust and of the sea water (Figure 4.2). Dust particles remain in transit for periods
where deposition occurs. The amount of material lasting from hours to weeks and during this time they
deposited and the bioavailability of the elements are exposed to sunlight and to acidic compounds (for
present in the dust are similarly critical. Bioavailability example, sulphuric acid [H2SO4], nitric acid [HNO3] and
is not well-understood. Indeed, Schulz et al. (2012, organic acids such as oxalic acid [C2H2O4]). Solubility
p.10391) describe it as “one of the most poorly can be modified by chemical reactions that take place
understood aspects of the entire global dust cycle”, on the surface of individual dust particles or while
but it is influenced at least in part by the solubility of passing through cloud droplets. The size of dust
the various dust-elements and solubility is therefore particles affects iron solubility (Baker and Jickells,
used as a proxy for bioavailability (Jickells, Baker and 2006) but its overall impact on iron solubility in bulk
Chance, 2016). aerosol is small (Shi et al., 2011). This atmospheric
processing of iron and how it is represented in
The majority of atmospheric nitrogen—both organic global biogeochemical numerical models has been
and inorganic—inputs to the oceans, from desert dust a focus for work by the United Nations Joint Group
and many other sources, appear to be both soluble of Experts on the Scientific Aspects of Marine
and bioavailable (Okin et al. 2011). By contrast, most Environmental Protection (GESAMP) Working Group
of the phosphorus and iron carried in desert dust are 38, ‘The Atmospheric Input of Chemicals to the Ocean’
present as minerals that are not immediately soluble (Myriokefalitakis et al., 2018). One outcome of this
in water, and therefore are not bioavailable (Tagliabue work is the realization that combustion processes
et al., 2017). Recently, much work has been done to may be more important than once thought in the
understand the change in speciation and solubility of solubility of aerosol iron in the ocean (Ito et al., 2019).
phosphorus in dust during long-range transport (for
example, Stockdale et al., 2016; Shi et al., 2019), but Some of the critical changes that can occur during
the literature on how trace metals in dust particles are transport over great distances and over long periods
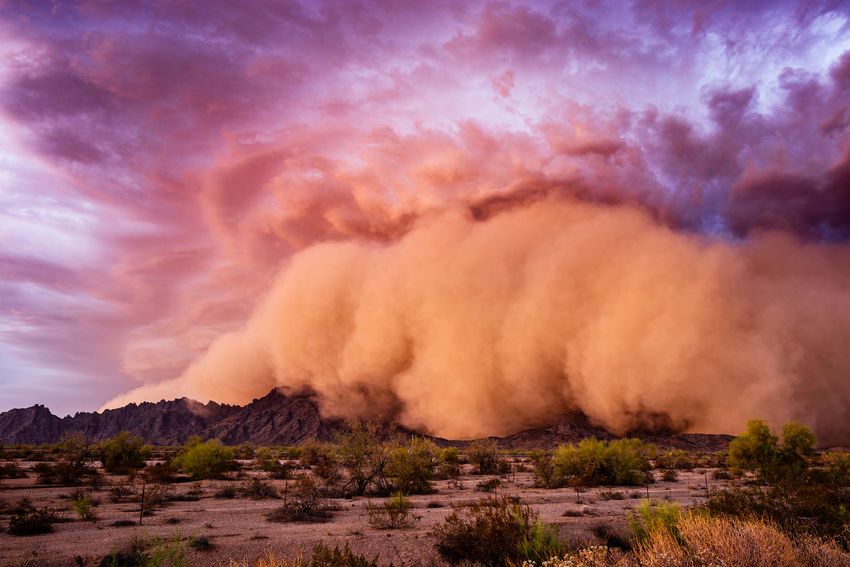
Figure 4.2. Atmospheric processes that can modify the solubility of iron (both as oxidized iron, Fe(III), and the
more soluble reduced Fe(II) form) from dust during transport through the atmosphere.
Photochemistry
Dust
Anthropogenic iron Fe(II), Fe(III)
Soluble iron
Settling/sorting
Acids Organic matter
Source: Adapted from Jickells and Moore, 2015.
14You can also read