PARALLEL REPRESENTATION OF CONTEXT AND MULTIPLE CONTEXT-DEPENDENT VALUES IN VENTRO-MEDIAL PREFRONTAL CORTEX - MPG.PURE
←
→
Page content transcription
If your browser does not render page correctly, please read the page content below
bioRxiv preprint doi: https://doi.org/10.1101/2021.03.17.435844; this version posted May 19, 2021. The copyright holder for this preprint (which
 was not certified by peer review) is the author/funder, who has granted bioRxiv a license to display the preprint in perpetuity. It is made
 available under aCC-BY-NC-ND 4.0 International license.

 Parallel representation of context and multiple
 context-dependent values in ventro-medial
 prefrontal cortex

 Nir Moneta1,2,3* , Mona M. Garvert1,2,4 , Hauke R. Heekeren3,5 , and Nicolas W. Schuck1,2*
 1
 Max Planck Research Group NeuroCode, Max Planck Institute for Human Development, 14195 Berlin, Germany
 2
 Max Planck UCL Centre for Computational Psychiatry and Ageing Research, Berlin, 14195 Berlin, Germany
 3
 Einstein Center for Neurosciences Berlin, Charité Universitätsmedizin Berlin, 10117, Berlin, Germany
 4
 Department of Psychology, Max Planck Institute for Human Cognitive and Brain Sciences, 04103 Leipzig, Germany
 5
 Department of Education and Psychology, Freie Universität Berlin, 14195 Berlin, Germany
 *
 Corresponding authors, email moneta@mpib-berlin.mpg.de and schuck@mpib-berlin.mpg.de

 May 19, 2021

 Abstract

 1 Value representations in ventromedial prefrontal-cortex (vmPFC) are known to
 2 guide decisions. But how preferable available options are depends on one’s cur-
 3 rent task. Goal-directed behavior, which involves changing between different
 4 task-contexts, therefore requires to know how valuable the same options will be
 5 in different contexts. We tested whether multiple task-dependent values influ-
 6 ence behavior and asked if they are integrated into a single value representation,
 7 or are co-represented in parallel within vmPFC signals. Thirty five participants
 8 alternated between tasks in which stimulus color or motion predicted rewards.
 9 Our results provide behavioral and neural evidence for co-activation of both
10 contextually-relevant and -irrelevant values, and suggest a link between multi-
11 variate neural representations and the influence of the irrelevant context and
12 its associated value on behavior. Importantly, current task context could be
13 decoded from the same region, and better context-decodability was associated
14 with stronger (relevant) value representations. Evidence for choice conflicts was
15 found only in the motor cortex, where the competing values are likely resolved
16 into action.
bioRxiv preprint doi: https://doi.org/10.1101/2021.03.17.435844; this version posted May 19, 2021. The copyright holder for this preprint (which
 was not certified by peer review) is the author/funder, who has granted bioRxiv a license to display the preprint in perpetuity. It is made
 available under aCC-BY-NC-ND 4.0 International license.

17 Introduction

18 Decisions are always made within the context of a given task. Even a simple choice between two apples will
19 depend on whether the task is to find a snack, for which their color might indicate the desired sweetness,
20 or to buy ingredients for a cake, for which a crisp texture might be more crucial. In other words, the
21 same objects can yield different outcomes in different task contexts. Context-dependent decision-making
22 therefore requires to retrieve not only the outcomes that are associated with different objects. Rather, it
23 is necessary to maintain separate outcome expectations for the same choice option, and to know which
24 outcome expectation is relevant in different task contexts.

25 Computing the reward a choice will yield given a task context is at the core of decisions [e.g. 1]. In
26 line with this idea, previous studies have shown in a variety of species that the ventromedial prefrontal
27 cortex (vmPFC) represents this so-called expected value (EV) [2–7], and thereby plays a crucial role
28 in determining choices [8]. It is also known that the brain’s attentional control network enhances the
29 processing of features that are relevant given the current task context or goal [9, 10], and that this
30 helps to shape which features influence EV representations in vmPFC [11–15]. Moreover, the vmPFC
31 seems to also represent the EV of different features in a common currency [16, 17]; and is involved in
32 integrating the expectations from different reward predicting features of the same object [18–21]. It
33 remains unclear, however, how context-irrelevant value expectations of available features, i.e. rewards
34 that would be obtained in a different task-context, might affect neural representations in vmPFC.

35 This is particularly relevant because we often have to do more than one task within the same environment,
36 such as shopping in the same supermarket for different purposes. Thus we have to switch between the
37 values that are relevant in the different contexts. The separation between task contexts or goals can
38 therefore often be less than perfect, which then can lead to processing of task-irrelevant aspects. In
39 line with this idea, several studies have shown that decisions are influenced by contextually-irrelevant
40 information, and traces of the distracting features have been found in cortical regions responsible for task
41 execution [22–26]. Similarly, task-irrelevant valuation has been shown to influence attentional selection
42 [27] as well as activity in posterior parietal [28] or ventromedial prefrontal cortex [29]. This raises the
43 possibility that vmPFC represents different value expectations that could occur in different task contexts
44 at the same time. In the present study we therefore investigated whether the vmPFC maintains multiple
45 task-dependent values during choice, and how these representations influence choices, interact with the
46 encoding of the relevant task-context, and with each other.

47 Previous research has indeed suggested that the role of vmPFC in decision making seems not to be
48 restricted to representing economic values. Rather, other aspects of the current task might be encoded
49 in this region as well [30–34]. Of particular relevance, a number of investigations have indicated that
50 vmPFC and adjacent overlapping medial orbitofrontal cortex represents the current context or so-called
51 task state in humans [35–38]. Although the concepts of context and task-state are not identical, both
52 emphasize that vmPFC encodes which features are currently relevant – and thereby determine which

 2
bioRxiv preprint doi: https://doi.org/10.1101/2021.03.17.435844; this version posted May 19, 2021. The copyright holder for this preprint (which
 was not certified by peer review) is the author/funder, who has granted bioRxiv a license to display the preprint in perpetuity. It is made
 available under aCC-BY-NC-ND 4.0 International license.

53 value expectations will guide behavior. Note, however, that value and task-state/context accounts do
54 not need to be mutually exclusive, but rather might reflect multiplexed representations within the neural
55 activity of the vmPFC/OFC [39, 40]. Conceptualizing the role of vmPFC as representing possible task
56 states therefore bridges beyond its traditional role as controller of economic value to a more complex role
57 in simultaneously representing task-related information, EV included.

58 If neural activity in vmPFC goes beyond signalling a single EV by representing more complex task
59 structure, then it suggests that the task-context is represented in addition to the values. We therefore
60 hypothesized that vmPFC simultaneously represents the task-context, in addition to task-relevant and
61 task-irrelevant values. This idea – that values and task-context co-occur and interact – also predicts
62 that a stronger activation of the relevant task-context will enhance the representation of task-relevant
63 values. We investigated this question using a multi-feature choice task in which different features of
64 the same stimulus predicted different outcomes and a task-context cue modulated which feature was
65 relevant. Based on the above reviewed evidence of neural processing of irrelevant features and values
66 [e.g., 24, 29], we hypothesized that values associated with contextually irrelevant features affect value
67 representations in vmPFC. Moreover, we tested whether different possible EVs were integrated into a
68 single value representation or processed in parallel. The former would support a unique role of the vmPFC
69 for representing only the EV of choice, whereas the latter would indicate that the vmPFC encodes several
70 aspects of a complex task structure, including the expected value of one’s choice in the currently relevant
71 context, but also the hypothetical value in the presently irrelevant context.

72 Results

73 Behavioral results

74 Participants had to judge either the color or motion direction of moving dots on a screen (random dot
75 motion kinematogramms, [e.g. 41]). Four different colors and motion directions were used. Before entering
76 the MRI scanner, participants performed a stair-casing task in which participants had to indicate which of
77 two shown stimuli corresponded to a previously cued feature. Motion-coherence and the speed which
78 dots changed from grey to a target color were adjusted such that the different stimulus features could
79 be discriminated equally fast, both within and between contexts. As intended, this led to significantly
80 reduced differences in reaction times (RTs) between the eight stimulus features (t(34) = 7.29, p < .001,
81 Fig.1a), also when tested for each button separately (t(34) = Left: 6.52, Right: 7.70, ps< .001, Fig. S1d)

82 Only then, participants learned to associate each color and motion feature with a fixed number of points
83 (10, 30, 50 or 70 points), whereby one motion direction and one color each led to the same reward
84 (counterbalanced across participants, Fig.1b). To this end, participants had to make a choice between
85 clouds that had only one feature-type, while the other feature type was absent or ambiguous (clouds were
86 grey in motion-only clouds and moved randomly in color clouds). To encourage mapping of all features
87 on a unitary value scale, choices in this part (and only here) also had to be made between contexts (e.g.

 3
bioRxiv preprint doi: https://doi.org/10.1101/2021.03.17.435844; this version posted May 19, 2021. The copyright holder for this preprint (which
 was not certified by peer review) is the author/funder, who has granted bioRxiv a license to display the preprint in perpetuity. It is made
 available under aCC-BY-NC-ND 4.0 International license.

 a b c d
 * 1.0
 0.4 single-feature (1D)
 0.9

 accuracy
 0.3
 0.8
 color
 σ2logRT

 70
 0.2 0.7

 0.1 0.6

 0.0 10pts 30pts 50pts 70pts 0.5
 motion 30
 outcome
 pre post learning
 0.6s 0.6s 1.6s 3.4s 0.8s 1.25s
 e
 Congruency
 chosen chosen dual-feature (2D)
 10 30 50 70 10 30 50 70

 10 30 50 70
 color 70
 10
 Co

 unchosen
 ng
 unchosen

 30 30 30 50 70 cued context
 ru

 50 70
 en
 In

 t
 co

 50 50 50 50 70
 outcome-
 ng

 30 10
 ru

 70 70 70 70 irrelevant
 en

 70
 t

 Figure 1: Task and Design a. Staircasing procedure reduced differences in detection speed between features. Depicted
 is the variance of reaction times (RTs) across different color and motion features (y axis). While participants’ RTs were
 markedly different for different features before staircasing (pre), a significant reduction in RT differences was observed
 after the procedure (post). The staircasing procedure was performed before value learning. RT-variance was computed
 by summing the squared difference of each feature’s RT and the general mean RT per participant. N = 35, p < .001.
 b. The task included eight features, four color and four motion directions. After the stair-casing procedure, a specific
 reward was assigned to each motion and each color, such that one feature from each of the contexts had the same value as
 it was associated with the same reward. Feature values were counterbalanced across participants. c. Participants were
 trained on feature values shown in (b) and achieved near ceiling accuracy in choosing the highest valued feature afterwards
 (µ = .89, σ = .06). d. Single- and dual-feature trials (1D, 2D, respectively). Each trial started with a cue of the relevant
 context (Color or Motion, 0.6s), followed by a short fixation circle (0.6s). Participants were then presented with a choice
 between two clouds (1.6s). Each cloud had only one feature in 1D trials (colored dots, but random motion, or directed
 motion, but gray dots, top) and two features for 2D trials (motion and color, bottom). Participants were instructed to make
 a decision between the two clouds based on the cued context and ignore the other. Choices were followed by a fixation
 period (3.4s) and the value associated with the chosen cloud’s feature of the cued context (0.8s). After another short
 fixation (1.25s) the next trial started. e. Variations in values irrelevant in the present task context of a 2D trial. For each
 feature pair (e.g. blue and orange), all possible context-irrelevant feature-combinations were included in the task, except
 the same feature on both sides. Congruency (left): trials were separated into those in which the irrelevant features favored
 the same choice as the relevant features (congruent trials), or not (incongruent trials). EVback (right): based on this factor,
 the trials were characterized by different hypothetically expected values of the contextually-irrelevant features, i.e. the
 maximum value of both irrelevant features. Crucially, EV, EVback and Congruency were orthogonal by design. The example
 trial presented in (d, bottom) is highlighted.

88 between a green and a horizontal-moving cloud). At the end of the learning phase, participants achieved
89 near-ceiling accuracy in choosing the cloud with the highest valued feature (µ = .89, σ = 0.06, t-test
90 against chance: t(34) = 41.8, p < .001, Fig. 1c), also when tested separately for Color, Motion and
91 across context (µ = .88, .87, .83,σ = .09, .1, .1, t-test against chance: t(34) = 23.9, 20.4, 19.9, ps< .001,
92 respectively, Fig. S1e). Once inside the MRI scanner, one additional training block ensured changes
93 in presentation mode did not induce feature-specific RT changes (F(7,202) = 1.06, p = 0.392). These
94 procedures made sure that participants began the main experiment inside the MRI scanner with firm
95 knowledge of feature values; and that RT differences would not reflect perceptual differences, but could

 4
bioRxiv preprint doi: https://doi.org/10.1101/2021.03.17.435844; this version posted May 19, 2021. The copyright holder for this preprint (which
 was not certified by peer review) is the author/funder, who has granted bioRxiv a license to display the preprint in perpetuity. It is made
 available under aCC-BY-NC-ND 4.0 International license.

96 be attributed to the associated values. Additional information about the pre-scanning phase can be found
97 in Online Methods and in Fig.S1.

98 During the main task, participants had to select one of two dot-motion clouds. In each trial, participants
99 were first cued whether a decision should be made based on color or motion features, and then had to
100 choose the cloud that would lead to the largest number of points. Following their choice, participants
101 received the points corresponding to the value associated with the chosen cloud’s relevant feature. To
102 reduce complexity, the two features of the cued task-context always had a value difference of 20, i.e. the
103 choices on the cued context were only between values of 10 vs. 30, 30 vs. 50 or 50 vs. 70. One third
104 of the trials consisted of a choice between single-feature clouds of the same context (henceforth: 1D
105 trials, Fig.1d, top). All other trials were dual-feature trials, i.e. each cloud had a color and a motion
106 direction at the same time (henceforth: 2D trials, Fig.1d bottom), but only the color or motion features
107 mattered as indicated by the cue. Thus, while 2D trials involved four features in total (two clouds with
108 two features each), only the two color or two motion features were relevant for determining the outcome.
109 The cued context stayed the same for a minimum of four and a maximum of seven trials. Importantly, for
110 each comparison of relevant features, we varied which values were associated with the features of the
111 irrelevant context, such that each relevant value was paired with all possible irrelevant values (Fig.1e).
112 Consider, for instance, a color trial in which the color shown on the left side led to 50 points and the
113 color on the right side led to 70 points. While motion directions in this trial did not have any impact on
114 the outcome, they might nevertheless influence behavior. Specifically, they could favor the same side
115 as the colors or not (Congruent vs Incongruent trials, see Fig.1e left), and have larger or smaller values
116 compared to the color features (Fig.1e right).

 a b c d ac
 k e ac
 k
 EV b EV b
 g: g:
 con con
 g+ g ck g+ g ck
 0.15 on on V ba on on V ba
 1.0 incongruent incongruent +c +c +E +c +c +E
 congruent E V EV E V E V E V EV E V E V
 0.07 congruent
 0.9 0.10
 -2800
 accuracy

 0.8 0.06 -6590
 log RT
 logRT

 0.05
 -2810
 AIC

 AIC

 0.7 -6610
 0.05
 0.00 n.s.
 n.s.
 0.6 -6630 -2820
 0.04 * *
 0.5 -0.05 * *
 -6650
 main task 30 50 70 30 50 70

 EV EVback

 Figure 2: Behavioral results a. Participants were at near-ceiling performance throughout the main task, µ = 0.905, σ =
 0.05. b. Participants reacted faster the higher the EV (x-axis) and slower to incongruent (purple) compared to congruent
 (green) trials. An interaction of EV × Congruency indicated stronger Congruency effect for higher EV (p = .037). Error
 bars represent corrected within subject SEMs [42, 43]. c. The Congruency effect was modulated by EVback , i.e. the
 more participants could expect to receive from the ignored context, the slower they were when the contexts disagreed and
 respectively faster when contexts agreed (x axis, shades of colours). Error bars represent corrected within subject SEMs
 [42, 43]. d. Hierarchical model comparison for the main sample showed that including Congruency (p < .001), yet not
 EVback (p = .27), improved model fit. Including then an additional interaction of Congruency × EVback improved the fit
 even more (p < .001). e. We replicated the behavioral results in an independent sample of 21 participants outside of the
 MRI scanner. Including Congruency (p = .009), yet not EVback (p = .63), improved model fit. Including an additional
 interaction of Congruency × EVback explained the data best (p = .017).

 5
bioRxiv preprint doi: https://doi.org/10.1101/2021.03.17.435844; this version posted May 19, 2021. The copyright holder for this preprint (which
 was not certified by peer review) is the author/funder, who has granted bioRxiv a license to display the preprint in perpetuity. It is made
 available under aCC-BY-NC-ND 4.0 International license.

117 We investigated the impact of these factors on RTs in correct 2D trials, where the extensive training
118 ensured near-ceiling performance throughout the main task (µ = 0.91, σ = 0.05, t-test against chance:
119 t(34) = 48.48, p < .0001, Fig.2a). RTs were log transformed to approximate normality and analysed using
120 mixed effects models with nuisance regressors for choice side (left/right), time on task (trial number),
121 differences between attentional contexts (color/motion) and number of trials since the last context switch.
122 We used a hierarchical model comparison approach to asses the effects of (1) the objective value of the
123 chosen option (or: EV), i.e. points associated with the features on the cued context; (2) the maximum
124 points that could have been obtained if the irrelevant features were the relevant ones (the expected value
125 of the background, henceforth: EVback , Fig 1e left), and (3) whether the irrelevant features favored the
126 same side as the relevant ones or not (Congruency, Fig. 1e right). Any effect of the latter two factors
127 would indicate that outcome associations that were irrelevant in the current context nevertheless influence
128 behavior, and therefore could be represented in vmPFC.

129 A baseline model including only the factor EV indicated that participants reacted faster in trials that
130 yielded larger rewards (χ2(1) = 1374.6, p < .001, Fig. 2b), in line with previous literature [44–46]. In the
131 first step, we added either Congruency or EVback to the model. We found that Congruency also affected
132 RTs, i.e. participants reacted slower to incongruent compared to congruent trials (t-test: t(39) = 4.59,
133 p < .001, likelihood ratio test to asses improved model fit: χ2(1) = 29.9, p < .001, Fig. 2b). Interestingly,
134 neither adding a main effect for EVback nor the interaction of EV × EVback improved model fit (LR-test
135 with added terms: χ2(1) = 1.21, p = .27 and χ2(1) = .01, p = 0.9 respectively), meaning neither larger
136 irrelevant values, nor their similarity to the objective value influenced participants’ behavior.

137 In a second step, we investigated if the Congruency effect represents merely an agreement between the
138 contexts, or if it interacted with the expected value of the best choice in the other context, i.e the points
139 associated with the most valuable irrelevant stimulus feature (EVback ). Indeed, we found that the higher
140 EVback was, the faster participants were on congruent trials. In incongruent trials, however, higher EVback
141 had the opposite effect (Fig. 2c, LR-test of model with added interaction: χ2(1) = 18.19, p < .001). We
142 found no effect of the value associated with the other, lower valued irrelevant feature that would not
143 have been chosen (LR-test to baseline model: χ2(1) = 0.92, p = .336), nor did it interact with Congruency
144 (χ2(1) = 2.76, p = .251). This means that the expected value of a ’counterfactual’ choice resulting from
145 consideration of the irrelevant features mattered, i.e. that the outcome such a choice could have led to,
146 also influenced reaction times. The hierarchical model comparison is summarized in Fig. 2d. All the
147 effects above also hold when running the models nested across the levels of EV (as well as Block and
148 Context, see Fig. S2). All nuisance regressors had a significant effect on RT (all ps< 0.03 in the baseline
149 model).

150 The main behavioral results were replicated in an additional sample of 21 participants that were tested
151 outside of the MRI scanner (LR-tests: Congruency, χ2(1) = 6.89, p = .009, ,EVback ,χ2(1) = .23, p = .63,
152 Congruency × EVback , χ2(1) = 5.69, p = .017 ,Fig.2e).

 6

bioRxiv preprint doi: https://doi.org/10.1101/2021.03.17.435844; this version posted May 19, 2021. The copyright holder for this preprint (which
 was not certified by peer review) is the author/funder, who has granted bioRxiv a license to display the preprint in perpetuity. It is made
 available under aCC-BY-NC-ND 4.0 International license.

153 We note that similar to the EVback × Congruency interaction, we also found that higher EV slightly increased
154 the Congruency effect (Fig. 2b, LR-test: χ2(1) = 4.34, p = .037). However, the interaction of Congruency
155 × EV did not survive model comparison in the replication sample (χ2(1) = 0.23, p = .63).Alternative
156 regression models considering for instance within-cloud or between-context value differences did not
157 provide a better fit the RTs (Fig.S3). An exploratory analysis investigating all possible 2-way interactions
158 with all nuisance regressors can be found in Fig. S4.

159 We took a similar hierarchical approach to model accuracy of participants in 2D trials, using mixed effects
160 models with the same nuisance regressors as in the RT analysis. This revealed a main effect of EV (baseline
161 model: χ2(1) = 14.71, p < .001), indicating higher accuracy for higher EV. Introducing Congruency and
162 then an interaction of Congruency × EVback further improved model fit (LR-test: χ2(1) = 66.12, p < .001,
163 χ2(1) = 6.99, p = .03, respectively), reflecting decreased performance on Incongruent trials, with higher
164 error rates occurring on trials with higher EVback . Unlike RT, error rates were not modulated by the
165 interaction of EV and Congruency (LR-test with EV × Congruency: χ2(1) = 0.05, p = .825). Out of all
166 nuisance regressors, only switch had an influence on accuracy (χ2(1) = 10.22, p = .001, in the baseline
167 model) indicating increasing accuracy with increasing trials since the last switch trial.

168 In summary, these results indicated that participants did not merely perform a value-based choice among
169 features on the currently relevant context. Rather, both reaction times and accuracy indicated that
170 participants also retrieved the values of irrelevant features and computed the resulting counterfactual
171 choice.

172 fMRI results

173 Decoding multivariate value signal from vmPFC Our MRI analyses focused on understanding the
174 impact of irrelevant reward expectations on value signals in vmPFC. We therefore first sought to identify
175 a value-sensitive region of interest (ROI) that reflected expected values in 1D and 2D trials, following
176 common procedures in the literature [e.g. 4]. Specifically, we analyzed the fMRI data using general linear
177 models (GLMs) with separate onsets and EV parametric modulators for 1D and 2D trials (at stimulus
178 presentation, see online methods for full model). The union of the EV modulators for 1D and 2D trials
179 defined a functional ROI for value representations that encompassed 998 voxels, centered on the vmPFC
180 (Fig. 3a, p < .0005, smoothing: 4mm, to match the multivariate analysis), which was transformed to
181 individual subject space for further analyses (mean number of voxels: 768.14, see online methods).

182 In the next step we focused on the multivariate activation patterns in the above-defined functional ROI. We
183 trained a multivariate multinomial logistic regression classifier to distinguish the EVs of accurate 1D trials
184 based on fMRI data acquired approximately 5 seconds after stimulus onset (Fig. 3b; leave-one-run-out
185 training; see online methods for details). For each testing example, the classifier assigned the probability
186 of each class given the data (i.e. ’30’,’50’ and ’70’, which sum up to 1, Fig. 3c). Because the ROI
187 was constructed such as to contain significant information about EVs, the classifier should predict the

 7
bioRxiv preprint doi: https://doi.org/10.1101/2021.03.17.435844; this version posted May 19, 2021. The copyright holder for this preprint (which
 was not certified by peer review) is the author/funder, who has granted bioRxiv a license to display the preprint in perpetuity. It is made
 available under aCC-BY-NC-ND 4.0 International license.

188 correct EV. As expected, the class with the maximum probability corresponded to the objective outcome
189 more often than chance in 1D trials (µ1D = .35, σ1D = .054). Importantly, EV decoding also generalized
190 to a test set composed of 1D and 2D trials (µall = .35, σall = .029, t(34) = 2.89, p = .007), and was
191 significant when testing only on 2D trials (µ2D = .35, σ2D = .033, t(34) = 2.20,p = .034, Fig. 3d), even
192 though the training data was restricted to 1D trials.

193 The following analyses model directly
 a. b. Training set:
194 the class probabilities estimated by 10 vs. 30 30 vs. 50 50 vs. 70
195 the classifier. Probabilities were mod-
196 elled with beta regression mixed ef-
197 fects models [47]. For technical rea-
198 sons, we averaged across nuisance re- EV = 30 EV = 50 EV = 70

199 gressors used in behavioral analyses. c. d. e.
 Test example:
200 An exploratory analysis of raw data in- 0.5
 class 30 50 70
 0.36
201 cluding nuisance variables showed that * * *

 accuracy
 0.4

 P class
 0.6 0.34
202 they had no influence and confirmed
 P class

 0.4
 0.3 0.32
203 all model comparison results reported 0.2

204 below (see Fig S6 and S8). 0.0
 30 50 70
 0.2 0.30
 1D 2D All 30 50 70
 class EV
205 Multivariate neural value codes re- Figure 3: Multivariate value analyses. a. The union of the EV parametric
 modulator allowed us to isolate a cluster in the vmPFC. Displayed coordinates
206 flect value similarities and are neg-
 in the figure: x=-6, z=-6. b. We trained the classifier on behaviorally accurate
207 atively affected by contextually- 1D trials on patterns within the functionally-defined vmPFC ROI. c. The
 classifier yielded for each testing example one probability for each class. d.
208 irrelevant value information. We
 The classifier assigned the highest probability to the correct class (objective
209 next asked whether EVs affected not EV) significantly above chance for 1D trials, but also generalized to 2D
 and across all trials (p = .049, p = .039, p = .007 respectively). Error
210 only the probability of the correspond-
 bars represent corrected within subject SEMs [42, 43]. e. Analyses of all
211 ing class, but also influenced the full probabilities revealed gradual value similarities. The y-axis represents the
 probability assigned to each class, colors indicate the classifier class and the
212 probability distribution predicted by
 x-axis represents the trial type (the objective EV of the trial). As can be
213 the classifier. We reasoned that if the seen, the highest probability was assigned to the class corresponding to the
 objective EV of the trial. Error bars represent corrected within subject SEMs
214 classifier is decoding the neural code
 [42, 43]
215 of values, then similarity between the
216 values assigned to the classes will yield similarity in probabilities associated to those classes. Specifically,
217 we expected not only that the probability associated with the correct class be highest (e.g. ‘70’), but
218 also that the probability associated with the closest class (e.g. ‘50’) would be higher than the probability
219 with the least similar class (e.g. ‘30’, Fig. 3e). To test our hypothesis, we modelled the probabilities
220 in each trial as a function of the absolute difference between the objective EV of the trial and the class
221 (|EV-class|, i.e. in the above example with a correct class of 70, the probability for the class 50 will be
222 modelled as condition 70-50=20 and the probability of 30 as 70-30=40). This analysis indeed revealed
223 such a value similarity effect (χ2(1) = 12.74, p < .001) also when tested separately on 1D and 2D trials
224 (χ2(1) = 14.22, p < .001, χ2(1) = 9.99, p = .002, respectively, Fig. 4a). We compared this value similarity

 8
bioRxiv preprint doi: https://doi.org/10.1101/2021.03.17.435844; this version posted May 19, 2021. The copyright holder for this preprint (which
 was not certified by peer review) is the author/funder, who has granted bioRxiv a license to display the preprint in perpetuity. It is made
 available under aCC-BY-NC-ND 4.0 International license.

225 model to a perceptual model that merely encodes the amount of perceptual overlap between each training
226 class and 2D testing (irrespective of their corresponding values) and found that our model explained the
227 data best (Fig. 4b and Fig. S6).

228 Our main hypothesis was that context-
 ng
229 irrelevant values might influence neural codes a. b.
 |E
 ck
 co
 ck
 V ba |EV ba |cong
 ss ss ss
 1D -cla V -cla V -cla ity
 |E
 V
 |E |E ilar
230 of value in the vmPFC. The experimentally 0.36 2D
 All -
 ss|+ ss|+ ss|+ ss|
 cla -cla -cla -cla ature
 sim
 |EV |EV |EV |EV Fe ll
 Nu
231 manipulated background values in our task 0.34
 -3880

 P class
232 should therefore interact with the EV proba- -3890

 AIC
 0.32
233 bilities decoded from vmPFC. We thus tested -3900
 *
234 the EV classifier only on 2D trials and asked 0.30 -3910 *
 0 20 40
235 whether the above described value similar- |EV - class|
 c. d.
236 ity effect was influenced by EVback and\or EVback EVback
 30 30
237 Congruency. Analogous to our RT analyses, 0.36
 50
 0.36
 50
 70 70
238 we used a hierarchical model comparison ap-
 P class

 P class
 0.34 0.34

239 proach and tested if the interaction of value
 0.32 0.32
240 similarity with these factors improved model
 0.30 0.30
241 fit, using χ2 based LR-tests (Fig. 4b). We 0 20 40 0 20 40
 |EV - class| |EV - class|
242 found that EVback , but not Congruency, mod-
 Figure 4: Impact of irrelevant feature values on value represen-
243 ulated the value similarity effect (χ2(1) = 6.16, tations in vmPFC. a. Larger difference between the decoded class
244 p = .013, χ2(1) = .58, p = .446, respec- and the objective EV of the trial (x axis) was related to a lower
 probability assigned to that class (y axis) when tested in 1D, 2D
245 tively, Fig. 4c). This effect indicated that or all trials (all p < .002, grey shades). Hence, the multivariate
246 the higher the EVback was, the less steep was classifier reflected gradual value similarities. Note that when |EV -
 class|=0, P is the probability assigned to the objective EV of the
247 the value similarity effect. Although including trial. Error class
 bars represent corrected within subject SEMs [42, 43] b.
248 a 3-way interaction also improved model fit AIC values of competing models of value probabilities classified from
 vmPFC. Hierarchical model comparison of 2D trials revealed not only
249 over a baseline model (Congruency × EVback the differences between decoded class and objective EV (|EV-class|)
250 × |EV-class|, χ2(1) = 7.2,p = .027), the AIC improved model fit (p < .002), but rather that EVback modulated
 this effect (p = .013). Crucially, Congruency did not directly modu-
251 score did not surpass the model with only
 late the value similarity (p = .446). Light gray bars represent models
252 the 2-way interaction (-3902.5,-3901.6, re- outside the hierarchical comparison. Including a 3-way interaction
 (with both EVback and Congruency) did not provide better AIC
253 spectively). These results also hold when
 score. A perceptual model encoding the feature similarity between
254 running the models nested within the levels each testing trial and the training classes (irrespective of values)
 did not provide a better AIC score than the value similarity model
255 of EV (Fig.S6). Replacing the EVback with a
 (|EV-class|). c-d. The higher the EVback was, the weaker the effect
256 parameter that encodes the presence of the of value similarity on the classifier’s probabilities (p = .013). Data
 presented in (c) and model in (d). Error bars represent corrected
257 perceptual feature corresponding to EVback
 within subject SEMs [42, 43].
258 in the training class (Similarityback : 1 if the
259 feature was preset, 0 otherwise, see Fig. S7) did not provide a better AIC score (-3897.1) than including
260 the value of EVback (-3902.5). Note that main effects of EVback or Congruency would not be sensible to

 9
bioRxiv preprint doi: https://doi.org/10.1101/2021.03.17.435844; this version posted May 19, 2021. The copyright holder for this preprint (which
 was not certified by peer review) is the author/funder, who has granted bioRxiv a license to display the preprint in perpetuity. It is made
 available under aCC-BY-NC-ND 4.0 International license.

261 test in this analysis because both factors don’t discriminate between the classes, but rather assign the
262 same value to all three probabilities from that trial (which sum to 1).

263 In summary, this indicates that the neural code of value in the vmPFC is affected by contextually-irrelevant
264 value expectations, such that larger alternative values disturb neural value codes in vmPFC more than
265 smaller ones. This was the case even though the alternative value expectations were not relevant in the
266 context of the considered trials. The effect occurred irrespective of the agreement or action-conflict
267 between the relevant and irrelevant values, unlike participants’ behaviour, which were mainly driven by
268 Congruency and it’s interaction with EVback . Our finding suggests that the (counterfactual) value of
269 irrelevant features must have been computed and poses the power to influence neural codes of objective
270 EV in vmPFC.

271 Larger irrelevant value expectations are related to reduced relevant EV signals, influencing
272 behavior. While modelling the full probability distribution over values offers important insights, it only
273 indirectly sheds light on the neural representation of the objective EV that reflects participants’ choices in
274 correct trials. We next focused on modelling the probability associated with the class corresponding to the
275 objective EV of each 2D trial (henceforth: PEV ). This also resolved the statistical issues arising from the
276 dependency of the three classes (i.e. for each trial they sum to 1). As can be inferred by Fig 3e above, the
277 median probability of the objective EV on 2D trials was higher than the the average of the other non-EV
278 probabilities (t(34) = 2.50, p = .017) In line with the findings reported above, we found that EVback had
279 a negative effect on PEV (χ2(1) = 5.96, p = .015, Fig. 5a), meaning that higher EVback was associated
280 with a lower probability of the objective EV, PEV . Interestingly, and unlike in the behavioral models, we
281 found that neither Congruency nor its interaction with EV or with EVback influenced PEV (χ2(1) = 0.035,
282 p = .852,χ2(1) = 0.48, p = .787, χ2(1) = .99, p = .317, respectively, Fig. 5b). The effect of EVback also
283 holds when running the model nested inside the levels of EV (χ2(1) = 5.99, p = 0.014, Fig.S8b). A model
284 including an additional regressor that encoded trials in which EV=EVback (or: match) did not improve
285 model fit, and no evidence for an interaction of the match regressor with the EVback was found (LR test
286 with added terms: χ2(1) = 0.45, p = .502, χ2(1) = 0.77, p = .379, respectively). This might indicate that
287 when value expectations of both contexts matched, there was neither an increase nor a decrease of PEV .
288 Lastly, we verified that replacing EVback with the perception-based Similarityback regressor did not provide
289 a better model fit (AICs: -1229.2,-1223.3, respectively). These findings confirm that EVback is not only
290 disturbing the neural code of values in the vmPFC but also specifically decreases the decodability of the
291 objective EV.

292 As in our behavioral analysis, we evaluated alternative models of PEV that included a factor reflecting
293 within-option or between-context value differences, or alternatives for EVback (Fig.S8). This exploratory
294 analysis revealed that our model provides the best fit for PEV in all cases except when EVback was replaced
295 with the sum of irrelevant values (-1229.6, -1229.2, respectively, Fig. S8). In contrast, AIC scores of
296 behavioral models’ favored EVback as modulator of Congruency, over the sum of irrelevant values (-6626.6,

 10
bioRxiv preprint doi: https://doi.org/10.1101/2021.03.17.435844; this version posted May 19, 2021. The copyright holder for this preprint (which
 was not certified by peer review) is the author/funder, who has granted bioRxiv a license to display the preprint in perpetuity. It is made
 available under aCC-BY-NC-ND 4.0 International license.

 ng
 a. b. : c
 o c.
 ck
 ba
 + EV
 ck
 ng
 k
 data ba ac ll
 0.37 fit EV EV b co Nu
 -0.025

 PEV ∼ EVback
 0.36 -1220
 PEV

 0.35 -1225 -0.050

 AIC
 0.34 -1230 n.s.
 -0.075
 0.33 -1235
 n.s.
 * R = − 0.43 , p = 0.0099
 30 50 70 0.0070 0.0075 0.0080
 EVback logRT ∼ congruencyEVback

 d. e. f.
 incongruent *
 congruent
 -0.4
 0.0
 0.35

 corr (PEV, PEVback)
 PEVback

 -0.5
 ρ
 -0.4
 0.30
 -0.6
 -0.8

 0.25 -0.7 R = − 0.45 , p = 0.0075
 wrong correct (P(EV) ,P(other)) (P(EV) ,P(EV back) ) 0.0050 0.0075 0.0100 0.0125 0.015
 logRT ∼ congruency
 Figure 5: Multivariate results: decoding the EV a. Higher EVback was related to a decreased decodability of EV
 (p = .015). Yellow line reflects data, dashed line model fit from mixed effects models described in text. Error bars represent
 corrected within subject SEMs [42, 43]. b. Hierarchical model comparisons revealed that the effect of EVback alone
 explained data best (p = .015) and no main effect or interaction with Congruency was indicated (Congruency main effect,
 p = .852, Congruency × EVback , p = .317). c. Participants who had a stronger effect of EVback on the EV decodability
 (y-axis, more negative values indicate stronger decrease of PEV as a result of EVback , see panel a) also had a stronger
 modulation of EVback on the effect of Congruency on their RT (x-axis, more positive values indicate stronger influence
 on the slow incongruent and fast congruent trials). d. The probability associated with EVback (PEVback , y-axis) was
 increased when participants chose the option based on EVback . Specifically, in incongruent trials (purple), high PEVback
 was associated a wrong choice, whereas in Congruent trials (green) it was associated with correct choices. This effect
 is preserved when modeling only wrong trials (main effect of Congruency: χ2(1) = 4.36, p = .037). Error bars represent
 corrected within subject SEMs [42, 43]. e. The correlation of PEV and PEVback was stronger than with POther , p = .017.
 f. Participant that had a stronger (negative) correlation of PEV and PEVback (x-axis, more negative values indicate stronger
 negative relationship) also had a stronger effect of Congruency on their RT (y-axis, larger values indicate a stronger RT
 decrease in incongruent compared to congruent trials)

297 -6619.9, respectively, Fig.S3). However, both parameters were strongly correlated (ρ = .87, σ = .004)
298 and therefore our task was not designed to distinguish between these two alternatives.

299 If the effect of EVback indeed reflects an influence of contextually-irrelevant values on neural representations
300 of the relevant expected value, then this might impact participants’ behavior. We therefore asked whether
301 the influence on the representation in vmPFC might relate to participants’ reaction times. In line with
302 this idea, we found that participants with a stronger EVback effect on PEV also had a stronger EVback ×
303 Congruency interaction effect on their RT (r = −.43,p = .01, Fig. 5c).

304 Next, we tested whether vmPFC represents EVback directly. A classifier trained on accurate 2D trials with
305 the labels of EVback could not successfully detect the correct class (t-test against chance: t(34) = 0.73,
306 p = .47). Note, however, that 2D trials were not fully balanced across the values of EVback (Fig. 1e),

 11
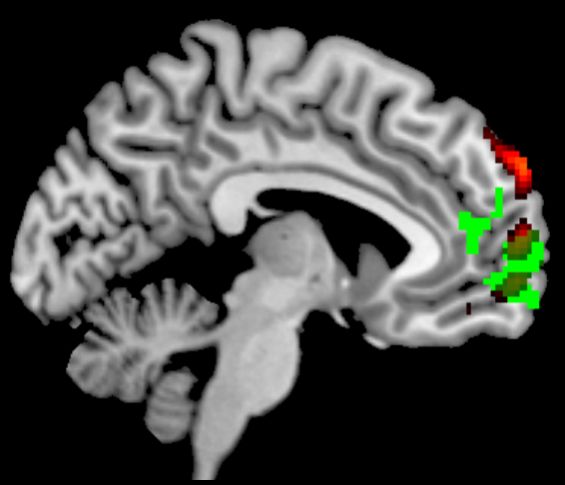
bioRxiv preprint doi: https://doi.org/10.1101/2021.03.17.435844; this version posted May 19, 2021. The copyright holder for this preprint (which
 was not certified by peer review) is the author/funder, who has granted bioRxiv a license to display the preprint in perpetuity. It is made
 available under aCC-BY-NC-ND 4.0 International license.

307 which complicated obtaining enough trials for classifier training. We thus turned to look at the probability
308 the classifier trained on 1D trials assigned to the class corresponding to EVback (henceforth: PEVback ).
309 When focusing only on behaviorally accurate trials, we found no effect of EV nor Congruency on PEVback
310 (χ2(1) = 0.07, p = .794, χ2(1) = 0.00, p = .987 respectively). However, motivated by our behavioral
311 analyses that indicated an influence of the irrelevant context on accuracy, we asked whether PEVback was
312 different on behaviorally wrong or incongruent trials. We found an interaction of accuracy × Congruency
313 (χ2(1) = 4.51, p = .034, Fig. 5d) that indicated increased PEVback for accurate congruent trials and a
314 decrease for wrong incongruent trials. Effectively, this means that in trials in which participants erroneously
315 chose the option with higher valued irrelevant features, PEVback was increased.

316 Parallel representation of task-relevant and task-irrelevant expected values in vmPFC. Our
317 previous analyses indicated that the probability of the objective EV decreased with increasing EVback .
318 This decrease could reflect a general disturbance of the value retrieval process caused by the distraction
319 of competing values. Alternatively, if the irrelevant values are represented within the same neural code as
320 the objective EV, then the probability assigned to the class corresponding to EVback would increase in
321 exchange for a decrease in PEV – even though the classifier was trained in the absence of task-irrelevant
322 values, i.e. the objective EV of 1D trials. In order to test this idea, we took the same trained classifier and
323 tested it only on trials in which EV 6= EVback , i.e. in which the value expected in the current task context
324 was different than the value that would be expected for the same choice in a different task-context. This
325 allowed us to re-label the classes of each trial to PEV , PEVback and Pother , where ’other’ corresponds to
326 the class that is neither the EV nor EVback of the trial, and examine directly the correlation between
327 each pair of classes. To prevent a bias between the classes, we only included trials in which the class
328 corresponding to ’other’ appeared on the screen as either relevant or irrelevant value.

 a. Training set: b. c. (P c
 )
 txt d.
 git
 +lo
 ck ck
 ba ba
 EV EV
 0.7 * * *
 -1225
 0.40
 accuracy

 0.6
 -1230
 PEV

 0.35
 AIC

 0.5
 -1235
 0.4 0.30
 -1240
 0.3
 *
 0.25
 All 2D 1D -4 -2 0 2 4
 ‘color’ ‘mo�on’ logit( Pcontext)

 Figure 6: Context decodability in the vmPFC directly relates to the representation of the objective outcome a. We
 trained the same classifier on the same data only this time we split the training set to classes corresponding to the two
 possible contexts: Color (left) or Motion (right), irrespective of the EV, though we kept the training sets balanced for EV
 (see online methods). b. The classifier could decode the trial’s context above chance also when sub-setting the data to
 1D, 2D and when testing on all trials (p < .001,p = .002,p < .001, respectively). Error bars represent corrected within
 subject SEMs [42, 43] c. The trial-context decodability improved prediction of the objective outcome probability, beyond
 the EVback (p = .001). d. The objective outcome was strongly represented (PEV ), the more the context was decodable
 from the vmPFC (modeled as logit-transformed probability assigned to the trial-context of the trial, x-axis)

 12
bioRxiv preprint doi: https://doi.org/10.1101/2021.03.17.435844; this version posted May 19, 2021. The copyright holder for this preprint (which
 was not certified by peer review) is the author/funder, who has granted bioRxiv a license to display the preprint in perpetuity. It is made
 available under aCC-BY-NC-ND 4.0 International license.

329 For each trial, the three class probabilities sum up to 1 and hence are strongly biased to correlate negatively
330 with each other. Not surprisingly, we found such strong negative correlations across participants of both
331 pairs of probabilities, i.e. between PEV and PEVback (ρ = −.56, σ = .22) as well as between PEV and
332 Pother (ρ = −.40, σ = .25). However, we found that the former correlation was significantly stronger
333 than the latter (t(34) = −2.77, p = .017, Fig. 5e), indicating that when the probability assigned to
334 the EV decreased, it was accompanied by a stronger increase in the probability assigned to EVback ,
335 akin to a competition between both types of expectations. Additionally, a formal model predicting
336 PEV by PEVback resulted in a smaller (i.e. better) AIC (-567.13), compared to using Pother as predictor
337 (-475.32, see online methods). In line with this finding, we turned to test if this potential competition is
338 reflected in participants’ behavior. Of particular relevance in this regard is the behavioral Congruency
339 effect, which similarly reflects a competition between the different values. Strikingly, we found that the
340 more negatively PEV correlated with PEVback , the stronger Congruency influenced participants’ behavior
341 (r = −.45,p = .008, Fig. 5f).

342 In summary, the neural code in vmPFC is mainly influenced by the contextually relevant EV. However, if
343 an alternative context would lead to a large expected value, the representation of the relevant expected
344 value is weakened, irrespective of their agreement on the action to be made. Moreover, weakening of the
345 EV representation is accompanied by a strengthening of the representation of EVback on a trial by trial
346 basis. Lastly, participants with a stronger influence of high alternative values on the EV representation
347 also had a stronger influence of EVback on the Congruency RT effect. Likewise, participants who exhibited
348 a larger negative association between the decodability of EV and the decoded probability of EVback , also
349 reacted slower when the contexts pointed to different actions. As will be discussed later in detail, we
350 consider this to be evidence for parallel processing of two task aspects in this region, EV and EVback .

351 Task-context representations interact with value codes within vmPFC Above we reported that
352 vmPFC activity is influenced by multiple value expectations. Which value expectation is currently relevant
353 depended on the task context. We therefore hypothesized that, in line with previous work, vmPFC would
354 also encode the task context, although this is not directly value-related. We thus turned to see if we can
355 decode the trial’s context from the same region that was univariately sensitive to EV. For this analysis we
356 trained the same classifier on the same accurate 1D trials as before, only it was trained to distinguish the
357 trial types ’Color’ and ’Motion’ (Fig. 6a). Crucially, the classifier had no information as to what was
358 the EV of each given trial, and training sets were up-sampled to balance the EVs within each set (see
359 online methods). The classifier was above chance for decoding the correct context in 1D, 2D and all trials
360 (t(34) = 3.95, p < .001, t(34) = 3.2, p = .003, t(34) = 3.93, p < .001, respectively, Fig.6b). Additionally,
361 the context is decodable also when only testing on 2D trials in which value difference in both contexts
362 was the same (i.e. when keeping the value difference of the background 20, since the value difference of
363 the relevant context was always 20, t(34) = 2.73, p = .01).

 13
bioRxiv preprint doi: https://doi.org/10.1101/2021.03.17.435844; this version posted May 19, 2021. The copyright holder for this preprint (which
 was not certified by peer review) is the author/funder, who has granted bioRxiv a license to display the preprint in perpetuity. It is made
 available under aCC-BY-NC-ND 4.0 International license.

364 Importantly, if vmPFC is involved in signaling the trial context as well as the values, then the strength of
365 context signal might relate to the strength of the contextually relevant value. Strikingly, we found that
366 Pcontext had a positive effect on the decodability of EV and that adding this term in addition to EVback
367 to the PEV model improved model fit (χ2(1) = 10.5, p = .001, Fig. 6c-d). In other words, the more the
368 context was decodable, the higher was the probability assigned to the correct EV class.

369 Lastly, we investigated how neural representations
370 in vmPFC of EV, EVback and the relevant Context a. Incongruent trials
 influence participants’ accuracy. Note that the two

 Behavioral Accuracy
371
 0.95
372 contexts only indicate different choices in incongru- PEVback
 0.90 1
373 ent trials, where a wrong choice might be a result
374 of a strong influence of the irrelevant context. The 0.85
 0
375 behavioral effect on accuracy could therefore be 0.80

376 particularly relevant in this condition. This was -10 -5 0 5 10
 logit( Pctxt)
377 also indicated by the analysis of PEVback shown in
378 Fig 5d. We therefore modeled congruent and in- b. Congruent trials

 Behavioral Accuracy
 0.96
 Behavioral Accuracy
379 congruent trials separately. This showed that that
 0.96
 0.95
380 a weaker representation of the relevant context was
 0.94
 0.94
381 marginally associated with an increased error rate
 0.93
382 (negative effect of Pcontext ) on accuracy, LR-test 0.92
 0.92
383 with Pcontext ): χ2(1) = 3.66, p = .055). Moreover, 0.91
 -10 -5 0 5 10 -10 -5 0 5 10
384 if stronger representation of the wrong context (i.e. logit( PEV) logit( PEVback)
385 1-Pcontext )) is reducing accuracy, than stronger rep-
 Figure 7: Neural representations of context and value in
386 resentation of the value associated with this context vmPFC jointly guide behavior a. Lower context decodabil-
387 (EVback ) should strengthen that influence. Indeed, ity of the relevant context (x axis) was associated with less
 behavioral accuracy (y-axis) in incongruent trials (p = .051).
388 we found that adding a Pcontext × PEVback term to This effect was modulated by the representation of EVback
389 the model explaining error rates improved model in vmPFC (p = .012, shades of gold), i.e. it was stronger in
 trials where EVback was strongly decoded from the vmPFC
390 fit (χ2(1) = 6.33, p = .012, Fig. 7a). Yet, the (shades of gold, plotted in 5 quantiles). Shown are fitted slopes
391 representation of EV and EVback did not directly from analysis models reported in the text. b. Decodability of
 both EV (p = .058, blue, left) and EVback (p = .009, gold,
392 influence behavioral accuracy (PEV : χ2(1) = 0.28, right) had a positive relation to behavioral accuracy (y axis) in
393 p = .599,PEVback : χ2(1) = 0.0, p = .957). In con- congruent trials. Shown are fitted slopes from analysis models
 reported in the text.
394 gruent trials choosing the wrong choice is unlikely
395 a result of wrong context encoding, since both contexts lead to the same choice. Indeed, there was
396 no influence of Pcontext ) on accuracy for congruent trials (LR-test: χ2(1) = 0.0, p = .922). However,
397 strong representation of either relevant or irrelevant EV would lead to a correct choice.Indeed, we found
398 that both an increase in PEVback and (marginally) in PEV had a positive relation to behavioral accuracy
399 (PEVback : χ2(1) = 6.48, p = .011, PEV : χ2(1) = 3.5, p = .061, Fig. 7b).

 14
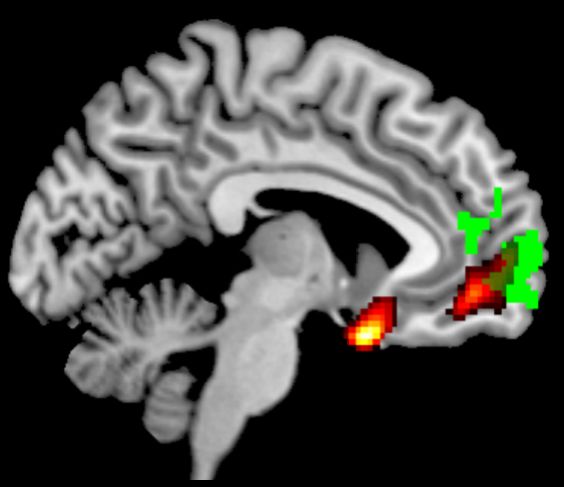
bioRxiv preprint doi: https://doi.org/10.1101/2021.03.17.435844; this version posted May 19, 2021. The copyright holder for this preprint (which
 was not certified by peer review) is the author/funder, who has granted bioRxiv a license to display the preprint in perpetuity. It is made
 available under aCC-BY-NC-ND 4.0 International license.

400 No evidence for univariate modulation of contextually irrelevant information on expected value
401 signals in vmPFC The above analyses indicated that multiple value expectations are represented in
402 parallel within vmPFC. Lastly, we asked whether whole-brain univariate analyses could also uncover
403 evidence for processing of multiple value representations. In particular, we asked whether we could find
404 evidence for a single representation that integrates the multiple value expectations into one signal. To
405 this end, we first analyzed the fMRI data using GLMs with separate onsets and EV parametric modulators
406 for 1D and 2D trials (see online methods for details). As expected, several regions were modulated by
407 EV in both trial types, including vmPFC (EV1D > 0 ∩ EV2D >0, Fig.8a). Hence, the vmPFC signaled
408 the expected value of the current context in both trial types as expected – even though 2D trials likely
409 required higher attentional demands (and indeed, the attention network was identified for the 2D>1D
410 contrast, p 1D, p < .001
421 in 2D trials. This GLM revealed FDR cluster corrected). c. A region in
 Y = 11 Z = 31
422 no evidence for a Congruency con- the Superior Temporal Gyrus was neg-
 c. atively modulated by EVback , i.e. the
423 trast anywhere in the brain (even 5
 higher the EVback , the lower the signal
424 at a liberal voxel-wise threshold of in this region. p < .001, FDR cluster-
 corrected. No overlap with (b), see S9.
425 p < .005). An unexpected neg- Y = -38 Z = 22 3.34 d. A cluster in the primary motor cortex
426 ative effect of EVback was found was negatively modulated by Congruency
 d.
 × EVback , i.e. the difference between In-
427 in the Superior Temporal Gyrus 5
 congruent and Congruent trials increased
428 (p < .001, Fig.8c), similar to previ- with higher EVback , similar to the RT
 effect, p < .005, FDR cluster-corrected.
429 ous reports implicating this region Y = -18 X =- 36
 2.72
 No overlap with (b), see S9
430 in modelling choices of others [48]).
431 Notably, unlike the multivariate analysis, no effect in any frontal region was observed. Motivated by our
432 behavioral analysis, we then turned to look for the interaction of each relevant or irrelevant value with
433 Congruency. An analysis including only a Congruency × EV2D parametric modulator revealed no cluster
434 (even at p < .005). Another analysis including Congruency × EVback in addition to EV2D as parametric
435 modulators, however, revealed a negative effect in the primary motor cortex at a liberal threshold, which
436 indicated that the difference between Incongruent and Congruent trials increased with higher EVback , akin

 15
bioRxiv preprint doi: https://doi.org/10.1101/2021.03.17.435844; this version posted May 19, 2021. The copyright holder for this preprint (which
 was not certified by peer review) is the author/funder, who has granted bioRxiv a license to display the preprint in perpetuity. It is made
 available under aCC-BY-NC-ND 4.0 International license.

437 to a response conflict (p < .005, Fig.8d). Lastly, we re-ran all above analyses concerning Congruency
438 and EVback only inside the identified vmPFC ROI. No voxel survived for Congruency, EVback nor the
439 interactions, even at threshold of p < .005.

440 Additional exploratory analyses such as contrasting the onsets of congruent and incongruent trials,
441 confirmed the lack of Congruency modulation in any frontal region (Fig. S9). Interestingly, at a liberal
442 threshold of p < .005 we found stronger activity for 1D over 2D trials in a cluster overlapping with
443 vmPFC (1D > 2D, p < .005, S9). Although this could be interpreted as a general preference for 1D
444 trials, splitting the 2D onsets by Congruency revealed no cluster for 1D > Incongruent (also at p < .005)
445 but a stronger cluster for 1D > Congruent (p < .001,Fig. S9). In other words, the signal in the vmPFC
446 was weaker when both contexts indicate the same action, compared to when only one context is present.

447 In summary, our univariate analyses indicated the well-known sensitivity of vmPFC to values expected within
448 the relevant context. Yet, unlike our multivariate analyses, we found no evidence for signal modulation
449 by contextually irrelevant values outside the motor cortex, where we found a negative modulation of
450 Congruency × EVback . This contrasts with the idea that competing values would have been integrated
451 into a single EV representation in the vmPFC, because this account would have predicted a higher signal
452 for Congruent compared to Incongruent trials. If at all, we found a general decrease in signal for Congruent
453 trials.

454 Discussion

455 In this study, we investigated how contextually-irrelevant value expectations influence behavior and neural
456 activation patterns in vmPFC. We asked participants to make choices between options that had different
457 expected values in different task-contexts. Participants reacted slower when the expected values in
458 the irrelevant context favored a different choice, compared to trials in which relevant and irrelevant
459 contexts favored the same choice. This Congruency effect increased with increasing reward associated
460 with the hypothetical choice in the irrelevant context (EVback ). We then identified a functional ROI that
461 is univariately sensitive to the objective, i.e. relevant, expected values (EV).

462 Multivariate analyses focused on the probability distribution of different values in vmPFC revealed that
463 a high EVback disrupts the value-code. Specifically, higher EVback was associated with a degraded
464 representation of the objective EV (PEV ) in vmPFC. At the same time, increased representation of EVback
465 in the vmPFC during stimuli presentation was associated with an increased chance of choosing accordingly,
466 irrespective of its agreement with the relevant context. Moreover, the decrease in decodability of the
467 value in the relevant context was associated with an increase in the value that would be obtained in the
468 other task-context (PEVback ), akin to a conflict of the two value representations. This impact on value
469 representations occurred irrespective of choice congruency, but both these effects were associated with
470 congruency-related behavioral slowing.

 16
You can also read