Factors influencing the volatility of bitcoin returns: An empirical study - University ...
←
→
Page content transcription
If your browser does not render page correctly, please read the page content below
Factors influencing the volatility of bitcoin returns:
 An empirical study

 By
 Marc Nypels
 Master Thesis

 University of Twente
 Faculty of Behavioural, Management and Social Sciences
 MSc in Business Administration
 Financial Management

 1st Supervisor: Dr. X. Huang
 2nd Supervisor: Prof. Dr. R. Kabir

 Enschede, 23/04/2021
Acknowledgements

This thesis represents the final stage of the Master Business Administration (MSc), with the
specialisation in Financial Management, at the University of Twente. During the Master I
attended various courses, such as risk management and entrepreneurial finance, that helped me
expand the knowledge with regards to the financial sector. In 2017 I developed interest in
cryptocurrency and its investment opportunities. During this period, I defined the idea to
investigate the largest cryptocurrency, bitcoin, as the subject of my Master thesis. Despite it
being quite a difficult subject, and it not always being an easy task, I am happy that I have
chosen this particular path.

I would like to show my appreciation towards the University of Twente for providing a
stimulating environment. Moreover, I would like to take this opportunity to thank both of my
supervisors for guiding me through this period. First of all, Dr. X. Huang, who stimulated me
to get the best out of this thesis and who was always prepared to provide me with adequate
feedback at any given time. Secondly, Prof. Dr. Kabir, whose feedback involved clear
instructive remarks, and who informed me how to a write my thesis in a clear structure. In
addition, I would like to thank all my relatives, friends and girlfriend for supporting me
throughout my Master’s degree. Without all of them I would not have been able to graduate.

Enschede, April 2021
Marc Nypels
Abstract
This thesis examines the bitcoin returns volatility and various factors, and formulates the
following research question: ‘’Which factors influence the volatility of bitcoin returns?’’ This
study uses the GARCH (1,1) model and examines five different independent variables, namely
trading volume (weekly number of bitcoin traded on Bitstamp), information demand (weekly
number of searches from Google Trends), MSCI ACWI world stock market index returns,
USD/EURO exchange rate and USD/JPY exchange rate. The sample consists of weekly data
from the 5th of January 2014 until the 27th of December 2020, and has been split into two
subsample periods due to the increased interest in bitcoin starting from 2017. The results of the
variance equation within the GARCH (1,1) model finds support for a positive impact of the
number of bitcoin traded on Bitstamp and the number of searches on Google Trends on bitcoin
returns volatility, and supports there being no effect of the stock market returns. However, the
results find no support for the positive influence of both the exchange rates. The most noticeable
limitation to this study is that the results show no significance in the variance equation when
testing the period from 2017 until 2020, even though this was to be expected due to it being a
highly volatile period. Future research could be executed by using alternative cryptocurrencies,
such as ethereum or ripple, or by using a different model for alternative insights.

Keywords: Bitcoin; digital currency; bitcoin returns; modelling volatility; GARCH (1,1)
Table of Contents
1. INTRODUCTION ............................................................................................................ 1

2. THEORETICAL FRAMEWORK ................................................................................. 5
 2.1 BITCOIN ............................................................................................................................. 5
 2.2 BITCOIN MARKET............................................................................................................... 7
 2.2.1 Efficient Market Hypothesis ..................................................................................... 8
 2.2.1.1 Efficient market anomalies ................................................................................. 9
 2.2.1.2 Efficiency of the bitcoin market ....................................................................... 10
 2.2.2 Market microstructure theory .................................................................................. 10
 2.2.2.1 Bitcoin trading structure ................................................................................... 12
 2.2.2.2 Bitcoin market characteristics .......................................................................... 13
 2.2.3 The investors of bitcoin ........................................................................................... 15
 2.3 BITCOIN PRICE BEHAVIOUR.............................................................................................. 15
 2.3.1 Behavioural Finance ................................................................................................ 16
 2.3.1.1 Decision-making process ................................................................................. 17
 2.3.1.2 Behaviour of investors...................................................................................... 17
 2.3.1.3 Bubbles and herd behaviour ............................................................................. 18
 2.3.1.4 Behaviour of bitcoin investor ........................................................................... 19
 2.3.2 Bitcoin price volatility ............................................................................................. 20
 2.4 DRIVERS OF BITCOIN PRICE VOLATILITY .......................................................................... 24
 2.4.1 Trading volume ....................................................................................................... 24
 2.4.2 Information demand ................................................................................................ 25
 2.4.3 World stock market index returns ........................................................................... 26
 2.5 HYPOTHESES ................................................................................................................... 28

3. RESEARCH METHODS .............................................................................................. 29
 3.1 TIME SERIES ANALYSIS .................................................................................................... 29
 3.1.1 (G)ARCH Model ..................................................................................................... 30
 3.2 MEASUREMENT ............................................................................................................... 34
 3.2.1 Dependent variable .................................................................................................. 34
 3.2.2 Independent variables .............................................................................................. 34
 3.2.3 Control variables ..................................................................................................... 35
 3.3 SAMPLE AND DATA COLLECTION ..................................................................................... 36
3.4 DATA ANALYSIS .............................................................................................................. 37
 3.4.1 Statistical Stationarity.............................................................................................. 37
 3.4.2 GARCH model evaluation ...................................................................................... 38
 3.4.2.1 Ljung-box Test ................................................................................................. 38
 3.4.2.2 Durbin-Watson Test ......................................................................................... 38
 3.4.3 Correlation coefficient ............................................................................................. 38
 3.4.3.1 Limitations of analysing correlation................................................................. 39
 3.5 ROBUSTNESS ................................................................................................................... 40
 3.5.1 Time Periods ........................................................................................................... 40

4. RESULTS ........................................................................................................................ 41
 4.1 DESCRIPTIVE STATISTICS ................................................................................................. 41
 4.2 CORRELATION MATRIX .................................................................................................... 43
 4.3 STATISTICAL STATIONARITY............................................................................................ 45
 4.4 GARCH (1,1) MODEL...................................................................................................... 45
 4.4.1 Testing for heteroscedasticity .................................................................................. 45
 4.4.2 Results GARCH (1,1) model .................................................................................. 47
 4.4.3 Fitness of Model ...................................................................................................... 50
 4.4 ROBUSTNESS TEST RESULTS ............................................................................................ 51
 4.5 RESULTS HYPOTHESES .................................................................................................... 54

5. CONCLUSION ............................................................................................................... 56
 5.1 DISCUSSION ..................................................................................................................... 59
 5.1.1 Limitations .............................................................................................................. 59
 5.1.2 Future research ........................................................................................................ 60

REFERENCES ....................................................................................................................... 61

APPENDICES ........................................................................................................................ 70
 APPENDIX A: BITCOIN BLOCKCHAIN STRUCTURE .................................................................. 70
 APPENDIX B: HISTOGRAMS VARIABLES................................................................................. 71
 APPENDIX C: VARIANCE INFLATION FACTOR (VIF) TEST ...................................................... 72
 APPENDIX D: SCATTERPLOTS VARIABLES ............................................................................. 73
 APPENDIX E: GARCH (1,1) MODELS 2 & 3 ........................................................................... 74
 APPENDIX F: ROBUSTNESS TEST FIRST TIME PERIOD (05/01/2014 – 25/12/2016) .................. 75
 APPENDIX G: ROBUSTNESS TEST SECOND TIME PERIOD (01/01/2017 – 27/12/2020) ............. 77
List of Tables
Table 1: Top 10 largest cryptocurrencies of 2021 ..................................................................... 5
Table 2: Bitcoin network ......................................................................................................... 12
Table 3: Top 10 largest bitcoin markets .................................................................................. 13
Table 4: Fee schedule of Kraken ............................................................................................. 14
Table 5: Descriptive statistics.................................................................................................. 41
Table 6: Pearson’s correlation matrix...................................................................................... 44
Table 7: Augmented Dickey-Fuller test .................................................................................. 45
Table 8: Engle’s Lagrange multiplier test ............................................................................... 47
Table 9: GARCH (1,1) model 1 .............................................................................................. 47
Table 10: Durbin-Watson test ................................................................................................. 50
Table 11: Ljung-Box test ......................................................................................................... 51
Table 12: GARCH (1,1) model first time period .................................................................... 52
Table 13: GARCH (1,1) model second time period ................................................................ 53
Table 14. Variance inflation factor (VIF) test ......................................................................... 72
Table 15. GARCH (1,1) model 2 ............................................................................................ 74
Table 16. GARCH (1,1) model 3 ............................................................................................ 74
Table 17: Descriptive statistics first time period ..................................................................... 75
Table 18: Pearson’s correlation matrix first time period ......................................................... 75
Table 19. Variance inflation factor (VIF) test first time period .............................................. 76
Table 20: Durbin-Watson test first time period ....................................................................... 76
Table 21: Ljung-Box test first time period .............................................................................. 76
Table 22: Descriptive statistics second time period ................................................................ 77
Table 23: Pearson’s correlation matrix second time period .................................................... 77
Table 24. Variance inflation factor (VIF) test second time period .......................................... 78
Table 25: Durbin-Watson test second time period .................................................................. 78
Table 26: Ljung-Box test second time period ......................................................................... 78

 List of Figures
Figure 1: Bitcoin price chart in USD ...................................................................................... 21
Figure 2: Logarithmic returns ................................................................................................. 46
Figure 3: Bitcoin blockchain structure .................................................................................... 70
Figure 4: Histograms variables ............................................................................................... 71
Figure 5: Scatterplots variables ............................................................................................... 73
1. Introduction
Cryptocurrencies are an extraordinary financial and technological innovation developed over
the last decade (Feng, Yiming & Zhang, 2018). Cryptocurrency is a subset of digital or virtual
currency that is designed to serve as a medium of exchange, however, with very different
characteristics. They are often used in a wider form within the general economic system. The
currency makes use of cryptography in order to secure and verify transactions, controlling the
creation of new units and making limited entries in a database called Blockchain
(Cointelegraph, s.a.). The technology behind Blockchain is an open distributed ledger which
records all the transactions. By doing so, it solves the problem of double-spending and gets rid
of the need to have a trusted third party. Furthermore, decentralization allows the technology
of blockchain to have faster settlement, increased capacity, as well as better security. As a result,
cryptocurrency has become one of the most pressing topics within the financial area (Lee, Guo
& Wang, 2017). Still to this day, the first and largest market capped cryptocurrency is the
bitcoin. Invented in 2008 by Satoshi Nakamoto, bitcoin spurred the creation of many new
cryptocoins, better known as altcoins (Nakamoto, 2008). Bitcoin was introduced by its creators
in an attempt to step away from the so-called trust-based model of fiat currencies and to create
a system that is based on cryptographic proof (Nakamoto, 2008). As of 2021, a total number of
8,436 cryptocoins are available on 367 exchanges (coinmarketcap, 2021a). The total market
capitalization of all available cryptocurrencies combined is around $1.45 trillion, of which
bitcoin dominates with a market capitalization of 60.1% (coinmarketcap, 2021a). these numbers
coincide with the findings of Feng, Wang, and Zhang (2018), who also concluded that the
market of cryptocurrencies is extremely volatile. In addition, Ciaian, Rajcaniova and Kancs
(2016) mentioned that these extreme forms of volatility are unusual within traditional
currencies, suggesting that the volatility could be caused by other determinants of factors that
influence the returns of bitcoin. Moreover, Kristoufek (2013) argued that bitcoin could not be
explained by traditional economic theories, such as purchasing power parity, future cash flow
models or uncovered rate parity, which leads to the consideration whether economic theories
could be used for explaining the returns of bitcoin. Notwithstanding, the price of bitcoin
fluctuates severely and expeditiously, which results in the fact that many uncertainties remain.
Though, bitcoin has the potential to serve as a stable platform for forthcoming financial
innovations, regardless of if it manages to emerge as a feasible currency (Economist, 2014).

 1
Due to the unique aspects of bitcoin, it has created a large number of headlines. One of the most
interesting and common one is its high volatility. The information and expertise around bitcoin
is however minimal compared to fiat currency. At the end of 2020, the database Scopus showed
a number of 3,887 articles regarding bitcoin, while there are 54,093 academic articles regarding
fiat currencies. Generally, this information is about the legal status of bitcoin, how to classify
it and if bitcoin can be treated as a fiat currency, not so much regarding factors that could
influence the bitcoin returns volatility. This inadequacy of information leads to greater risks for
investors that are involved. This study engages in researching data regarding bitcoin by using
financial theories, in order to present investors with knowledge and information regarding those
factors. Price volatility and price formation have been broadly studied on various financial
markets (e.g., Fama, 1970; Lux, 1995; Barberis, Shleifer & Vishny, 1998; Schwert, 1990), and
is in general of great importance to investors, due to the fluctuations resulting in direct loss or
gains of their capital. These studies and their findings have expanded the information on
volatility of those assets, which helped investors better understand certain aspects on other
specific financial assets. However, since the introduction of cryptocurrencies, there has always
been criticism around volatility. The market of bitcoin is highly speculative, and more volatile
in comparison to other currencies (Cheah & Fry, 2015). Since bitcoin has earned its place in
the financial markets and within portfolio management, it is crucial that its volatility is
examined (Dyhrberg, 2016). Due to the emerging stage of the bitcoin market, researchers have
only just started to investigate this financial phenomenon. This particular market, which attracts
attention from all directions, offers interesting research topics. The underlying causes of high
price volatility of bitcoin can best be identified with wide information searches and the aid of
various financial theories. In line with studies from Kristoufek (2013) and Vlastakis and
Markellos (2012), this research uses financial modelling to study variables that found relevant
within the theoretical investigation regarding the bitcoin returns volatility.

The purpose of this specific study is to identify various drivers behind the returns volatility of
bitcoin. Bitcoin’s returns volatility is much higher compared to other fiat currencies (Cheah &
Fry, 2015). Joint with its unique market setting, it makes for an interesting study. A literature
review consisting of theoretical paradigms as well as empirical research is conducted to analyse
which variables are significant factors for price formations within other financial markets as
well as the cryptocurrency market. After carefully evaluating the variables and applying them
to the bitcoin market, this study aims to identify the specific variables that affect bitcoin’s
returns volatility. Once these variables are identified, statistical and econometric methods are

 2
applied in order to hypothesize their explanatory power. Existing economic theories are being
studied in a different setting, which has the possibility to lead to new insights. Therefore, the
purpose of this study is to broaden the general knowledge of the bitcoin market. Hence, by
identifying the factors that influence the returns volatility of bitcoin, this study sets to benefit
both scientific literature as well as the investors.

This thesis aims to identify various drivers behind the volatility of bitcoin returns. In order to
reach this goal, the following research question has been formulated:

Research Question: Which factors influence the volatility of bitcoin returns?

There are multiple studies that have researched the effect of certain factors on the volatility of
bitcoin returns (e.g., Kristoufek, 2015; Ciaian et al., 2016; Pichl & Kaizoji, 2017; Wang &
Vergne, 2017; Bouoiyour et al., 2018). These studies all use different factors over a different
time period and analysing the data using various methods to test which factors could influence
the bitcoin returns. For example, the study of Wang and Vergne (2017) examined the effect of
certain aspects of both the supply-side and demand-side factors, such as public interest and
technological developments, on the weekly returns of bitcoin from September 2014 until
August 2015. They mentioned that applying the same variables and methods on a different time
period could lead to interesting different results. In addition, Ciaian et al. (2016) studied both
the traditional factors that influence prices, such as market forces of supply and demand, as well
as digital specific factors, like the attractiveness of bitcoin by investors. Their study used a
derivative of the Barro model for gold over a time period from 2009 until 2015. The results
showed that the effects will not hold in the short term but could better explain price changes in
the long run, which could result in an interesting alternative study. this particular study seeks
to contribute to existing literature by extending the sample period to achieve new insights in
the effects of certain factors, by using a time period from the beginning of 2014 until the end
of 2020.

Moreover, a number of studies investigated the effect of a single factor on the bitcoin returns
volatility (e.g., Kristoufek, 2013; Pryzmont, 2016; Balcilar et al., 2017; Bouri et al., 2019; El
Alaoui et al., 2019; Shen et al., 2019). For example, the studies of Balcilar et al. (2017), Bouri
et al. (2019) and El Alaoui et al. (2019) all studied the effect of trading volume on the volatility
of bitcoin returns. In general, these studies found that the bitcoin returns and changes in trading

 3
volume mutually collaborate with each other in a nonlinear way. Furthermore, Bouri et al.
(2019) argued that trading volume can be seen as a useful tool to predict extreme positive and
negative returns of cryptocurrencies, such as bitcoin. Additionally, the study of Kristoufek
(2013) investigated the effects of search queries on Google Trends and Wikipedia with regards
to the returns of bitcoin. There main findings showed that search queries are correlated to the
bitcoin price and that there exists a pronounced asymmetry between the effect of a raised
curiosity towards bitcoin whilst being below or above its trend value. This specific study seeks
to contribute to the literature by combining previous studied factors, such as trading volume
and search queries on Google Trends, in order to test the effects on the volatility of bitcoin
returns.

Throughout all the research that have been conducted with regards to testing the effect of certain
factors on the returns volatility of bitcoin, many different methods have been used. For example,
Kristoufek (2013) used a single lag in the VAR approach, Ciaian et al. (2016) used a derivative
of the Barro model for gold and Balcilar et al. (2017) used the standard linear Granger causality
test. This study seeks to complement the existing literature by using a Generalized
Autoregressive Heteroskedasticity Model (GARCH) in order to test the influence of certain
factors. This method for explaining bitcoin returns volatility has already been used by certain
researchers (e.g., Dyhrberg, 2016; Naimy & Hayek, 2018). However, this study is, to my
knowledge, the only study that combines these specific factors with this specific model, during
this specific time period, and therefore contributes to existing research.

The remainder of the thesis is structured as follows. In chapter 2 the theoretical framework will
be discussed, and the hypotheses will be formulated. Chapter 3 introduces the research
methodology and data and, chapter 4 presents the empirical results. The last chapter, chapter 5,
concludes this thesis and displays the conclusions of this study and discusses the limitations
and future research possibilities.

 4
2. Theoretical framework
 The purpose of this chapter is to elaborate on specific aspects of bitcoin itself, the bitcoin
 market, as well as the drivers behind price volatility. In addition, this chapter contains an
extensive description of various theoretical concepts, such as the efficient market hypothesis,
 the market microstructure, and behaviour finance, as a fundamental for understanding
 existing research analysing the bitcoin market.

2.1 Bitcoin
In 2008, Satoshi Nakamoto introduced a peer-to-peer network better known as bitcoin. Bitcoin
can be seen as a digital monetary and payment system that is available through decentralized
and distributed networks, without the need for intermediaries. Having a decentralized nature
means that for example bitcoin does not have a central authority, there is no central storage for
bitcoin, and anybody can trade in bitcoin without the need of any approval. Bitcoin is the first
cryptocurrency that has been introduced and is followed by many other digital currencies
known as altcoins. Some major alternative coins are ethereum, ripple and litecoin
(Coinmarketcap, 2021b). However, At the time of writing this study, bitcoin is still the largest
cryptocurrency in existence, as shown by table 1.

 Table 1: Top 10 largest cryptocurrencies of 2021
 Cryptocurrency Market Cap
 1. Bitcoin $ 872,89 billion
 2. Ethereum $ 206,65 billion
 3. Tether $ 31,60 billion
 4. Cardano $ 27,70 billion
 5. XRP $ 26,98 billion
 6. Polkadot $ 25,63 billion
 7. Binance Coin $ 20,08 billion
 8. Litecoin $ 13,47 billion
 9. Stellar $ 12,39 billion
 10. Chainlink $ 12,33 billion
 Source: (Coinmarketcap, 2021a)

 5
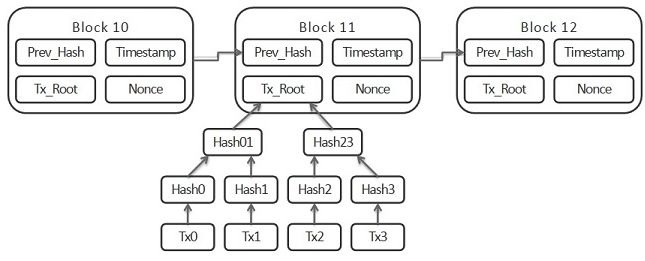
Bitcoin is generated as a reward of the process called mining. Mining consists of dealing with
very specific, random-based numerical computations that desire significant computing power
(Garcia et al., 2014). It involves identifying a certain block that yields a number that is smaller
than the given difficulty target. Mining bitcoin is extremely time consuming and a costly
process. The bitcoin mining process shows that the reward declines every 4 years. After being
launched in 2008, mining a single block resulted in receiving 50 BTC. 4 years later, in 2012,
this reward halved to 25 BTC. In 2016 the reward halved again to 12.5 BTC per mined block,
and in 2020 the reward halved to 6.25, which is currently still the amount received for mining
one block. Following this trend, the reward will halve every 4 years or so until the last bitcoin
is mined, which will be around the year 2140. Meaning that there is a reduction in rewards for
miners over time (Investopedia, 2019). Considering the unique design of bitcoin, this particular
cryptocurrency cannot be generated outside the standard creation mechanism and trying to
falsify bitcoin itself or its transaction will be unsuccessful (Sapuric & Kokkinaki, 2014).

The transactions of bitcoin are verified by certain network notes by using cryptography and are
documented in a public ledger called blockchain. Blockchain was introduced by Satoshi
Nakamoto, who used it as the peer-to-peer network for bitcoin (Nakamoto, 2008). Blockchain
is an open distributed ledger that is able to efficiently document transactions between two
parties in a permanent and verifiable way. Blockchain can be seen as a growing list of records,
or blocks, which are linked together using cryptography. Every individual block contains an
algorithm (hash) of the previous block, a certain time stamp, and transaction data (see appendix
A for an overview of the bitcoin blockchain structure). Blockchain has been designed in such a
way that it is resistant to any form of modification of the data, due to the fact that once
documented, the specific data of any block cannot be changed retroactively without altering all
following blocks (the economist, 2016).

Today, bitcoin can be used as a form of payment for both online services as well as many
physical goods (Bradbury, 2014). Moreover, it is believed by venture capitalists that
cryptocurrency has a lot of potential, as substantiated by the fact that an amount of 1.3 billion
USD already has been invested in bitcoin related organizations over the year 2018 (Rowley,
2018). By far the most interesting aspect about bitcoin are the investment opportunities.
Nonetheless, bitcoin can be used for multiple other purposes, both on- and offline. For example,
it is possible to donate bitcoin to charity, use it to buy certain gift cards or spend it on games
and applications developed by Microsoft. On top of that, bitcoin can also be used to spend at

 6
certain restaurants, to book a hotel via Expedia, buy a plane ticket or even use it to buy a car at
a dealership. In extreme forms, it is even possible to spend bitcoin to go to space with Virgin
Galactic (Coinbase, 2020). These are just a few examples, as more and more businesses are
accepting bitcoin each day.

2.2 Bitcoin market
The value of bitcoin is not determined by macroeconomic fundamentals of any kind, such as
GDP, inflation or interest rates, or clinched against other currencies (Kristoufek, 2013). On the
contrary, the exchange rate of bitcoin is entirely based on supply and demand. Hence, it is of
most importance to recognize the microstructure of the bitcoin market in order to understand
its price formation (Garman, 1976; Ciaian, Rajcaniova & Kancs, 2016). As of 2020, the number
of investors has risen significantly throughout the last few years and have reached a number of
approximately 380,000 trades per day (Blockchain, 2020). Current financial times led investors
to find alternative innovative investment opportunities, where bitcoin’s lack of correlation with
other assets makes it an attractive market (Brière et al., 2015; Chowdhury, 2016). Moreover,
Kaplanov (2012) states that the main reason for the rapidly rising popularity of bitcoin is that a
lot of people are craving for alternative currencies which are not regulated by the government.
No regulation results in various benefits for bitcoin users. First of all, it ensures user autonomy.
Users of digital currencies are able to control the way they spend their money without having
to deal with intermediary authorities, such as the government or a bank. Secondly, bitcoin
purchases are discrete. This means that transactions will never be associated with the buyer’s
personal identity, similar to cash-only purchases, and will not be easily tracked back to the
buyer. Furthermore, the bitcoin system is entirely peer-to-peer, implying that bitcoin users can
send and receive payments around the world without needing the approval from any external
authority. Moreover, bitcoin also eliminates traditional banking fees, such as the minimum
balance fees, overdraft charges and returned deposit fees. Also, the (international) transaction
costs of bitcoin are kept low since these transactions have no intermediary government or
institutions involvement. In addition, bitcoin transactions happen quickly, which eliminates the
inconvenience of waiting periods and authorization requirements. Lastly, bitcoin users can pay
for coins anywhere they have access to the internet, meaning that it is not necessary to go to a
store or bank. This means that bitcoin, in theory, is available to populations of users who do not
have access to traditional banking systems or any other payment methods (Investopedia,
2020a).

 7
Bitcoin has been gaining more attention due to the support and approval of the industry. This
results in the fact that the bitcoin market is developing, and more institutional investors are
open to investments, ensuring the development of bitcoin into a mature asset class (Chin, 2014).
In order to further explore the market of bitcoin, two theories will be used. First of all, the
efficient market hypothesis, to understand how certain information is integrated into prices and
how it could influence such prices. Secondly, the market microstructure, to better understand
the price formation in financial markets, and ultimately the price formation of bitcoin.

2.2.1 Efficient Market Hypothesis
The EMH, short for efficient market hypothesis, is used as the foundation for many modern
financial aspects (Malkiel, 2003). Its existence presents significant implications respecting the
relationship between asset prices and information (Fama, 1970). Consequently, it can be seen
as an important foundation for this research. The efficient market hypothesis speculates that the
market equilibrium could be declared in terms of expected returns, and that the market fully
exploits the information (Fama, 1970). Ritter (2003) argued that the foundation of the EMH is
formed by the ideas of rational investors together with the expected utility theory.
Notwithstanding, not the ideas of all investors are mandatory, however, the market requires to
be rational and adequate to make unbiased forecasts respecting the future. Jensen (1978) stated
that the existence of sophisticated investors assures that certain prices will never significantly
alter from its fundamental value. This ensures that the EMH serves under the conditions of a
zero-profit competitive equilibrium, while performing in an uncertain and highly speculative
market.

Fama (1970) classified three different forms of efficient markets that have been broadly tested
by research. The prime difference between these forms is the way they interpret the information
set θt, which is used to analyse the power of efficiency (Jensen, 1978). Firstly, the strong-form,
which affirms that prices display all available information, and no one holds the monopolistic
access to the information that is significant for price formation (Fama, 1970). Secondly, the
semi-strong-form, which states that all available information at time t (θt), is counted towards
the price formation, meaning less restrictions (Jensen, 1978; Fama, 1970). However, the
downside to this form is the dilemma of determining what refers to as being ‘all publicly
available information’. Lastly, the weak-form, which integrates the historical series of price or
returns into the price formation (Fama, 1970).

 8
The efficient market hypothesis is closely linked to the random walk theory, which speculates
that prices follow a random walk. This ensures that the price of tomorrow is not related to the
price of today (Malkiel, 2003). Moreover, new information is in general unstable, implying that
prices are unstable as well due to all prices being reflected by all known information. Malkiel
(2003) argued that new information circulates rapidly and is directly integrated into prices,
ensuring that neither the fundamental nor the technical analysis can be used to forecast future
prices. Hence, without acknowledging above-average risks, investors cannot realise above-
average returns. Nonetheless, Shleifer (2000) stated that even though the publication of new
information is causing price changes, no-arbitrage conditions assures that new information
cannot be used to assume certain returns in the future.

2.2.1.1 Efficient market anomalies
During the late 1980s, questions arise regarding the efficient market hypothesis due to the
discovery of more anomalies (Shiller, 2003). Lux (1995) argued that stock prices show greater
volatility compared to the expected returns, as shown by empirical research. This indicates that
excess volatility supports the predictability of returns (West, 1988). Moreover, Malkiel (2003)
stated that other anomalies are the presence of momentum within the short-term stock prices,
day-of-the-week or seasonal patterns and mean-returns annulments spread within a longer time
period. However, he explained that these anomalies are challenging to gain favour of as patterns
dissolve when becoming public and due to the fact that they are not trustworthy from period to
period.

Shiller (2003) showed that the most problematic anomaly has proven to be excessive price
volatility, compared to other financial anomalies. The volatility anomaly is much deeper
compared to for example those who are represented by exchange-rate overshooting or price
stickiness. The evidence concerning excessive price volatility seems to imply that price changes
occur without a fundamental reason, e.g., due to mass psychology (Shiller, 2003). The constant
failing to confirm the efficient market hypothesis suggests the existence of noise as a
disturbance. Hence, West (1988) claims that a different model should be used, where the aim
is not focussed on the rational investor. Taking this into account, this theoretical framework
will consider and contrast such forms of theories to the EMH. Since bitcoin prices experience
comparable extreme volatility, these theories could grant valuable insights into why this takes
place. Following the three forms of efficiency markets stated by Fama (1970), these theories

 9
should consist of a strong market form, meaning that the price is based on all available
information without any sort of noise disturbance. This ensures that it is not possible to adjust
the price by a single person or organisation.

2.2.1.2 Efficiency of the bitcoin market
Shleifer (2000) mentioned that the efficient market hypothesis specifies that unless the logic
behind adjustments in supply and demand of a certain asset is substantiated by news regarding
changes of the fundamental value, there should not be any effect on the price. Since the price
of bitcoin does not depend on traditional fundamentals, but rather find its value based on e.g.,
the cost of generating one bitcoin through the mining process, the amount said person receives
as a reward for mining a bitcoin, or the number of competing cryptocurrencies, it is difficult to
apply the EMH on the market of bitcoin. However, the bitcoin price has shown extreme
volatility during its existence, making it interesting to examine its origin. Notwithstanding, this
study does not focus on applying the EMH on the bitcoin market and test the efficiency of the
market. Nevertheless, the efficient market hypothesis serves as a theoretical foundation in order
to understand how information is integrated within prices, and is thus essential for any analysis
of the elemental purposes of asset price volatility.

Although the efficient market hypothesis is not able to directly explain the price formation of
bitcoin, there is another theory that could help to better understand this specific market and how
the price of bitcoin is constructed, which is the market microstructure theory.

2.2.2 Market microstructure theory
A fundamental part of finance is acquiring knowledge about price formation. This grants insight
in market regulations, in investors behaviour and in the formation of new trading mechanisms.
In order to understand price formation within financial markets, the market microstructure
theory is used (O’Hara, 1995). Madhavan (2000) defined this theory as a process where the
underlying demands of investors are ultimately translated into the prices and volumes of a
certain asset.

As mentioned by Madhavan (2000), the market microstructure theory speculates that financial
asset prices are exposed to various frictions and could perhaps fail to fully reflect the accessible
information. However, Biais, Glosten and Spatt (2005) argued that the theory instead

 10
concentrates on how adequately short-term prices correspond to their long-term equilibrium
prices. Hence, when studying markets considering market microstructure, the microeconomic
theories encounter the reality of actual markets. The original research of Garman (1976)
introduced an alternative to classic economic theories regarding exchange markets. Garman’s
conception of market microstructure advocates a more complicated and dynamic structure
compared to classic economic theories.

Madhavan (2000) specified that informational economics are a crucial issue when studying
market microstructure. The study of Madhavan (2000) emphasizes that the information design
and market efficiency both have important implications for investors’ behaviour and therefore
the market outcomes. O’Hara (1995) argued that some studies conclude that every individual
trader acts competitively, whilst others mention that using private information assures that a
number of investors act strategically. The different strategic models are associated with the
rational expectations that investors will make assumptions about each other’s information,
which will lead to the equilibrium price. As mentioned by O’Hara (1995), this can further be
branched into two different parts; One that targets informed traders and one that also includes
uninformed traders. The first part concentrates on market makers and informed traders, while
noise traders base their choice on arguments that are exogenous to the model. The second part
also includes uninformed trades who base their strategies on decisions made by informed
traders (O’Hara, 1995). Moreover, the trading instruments of a specific market are considered
to be an essential part of the price formation process (O’Hara, 1995).

Biais et al. (2005) specified that the market microstructure research has seen a development
over the last few decades due to strong market changes, such as regulatory changes,
technological innovations and structural shifts. The bitcoin market shows how technological
innovations encourage changes within the financial market. Its developing nature entails that
research has not yet fully explored the variables of the bitcoin market microstructure and how
they affect the price formation. Within the boundaries of this study, the market microstructure
helps to support by understanding the logic behind investors’ decisions to invest in bitcoin. This
particular theory better explains the demands of bitcoin investors, and how the price of bitcoin
develops accordingly.

 11
2.2.2.1 Bitcoin trading structure
As mentioned by O’Hara (1995), the guidelines concerning the trading mechanism will serve
as the basis for the price development of assets. Table 2 below shows that at the end of 2020
bitcoin has reached a circulation of approximately 16.52 million BTC. Chowdhury (2016)
argued that the supply function of bitcoin depends on the rate of mining and the willingness of
bitcoin holders to sell. The fixed amount of bitcoin supply is set to 21 million BTC (Nagamoto,
2008), meaning that roughly 75 percent of all bitcoin already have been mined. As of 2020,
mining a single block results in receiving 6.25 BTC. Moreover, table 2 displays that the total
amount of market capitalisation for bitcoin amount to approximately $607.49 billion USD, or
444.59 billion euros. This implies that the bitcoin market is growing extensively, considering
that it was only introduced in 2009 (Nagamoto, 2008). Bitcoinmarket.com was the first bitcoin
exchange and opened in 2010 (Bitcoin.com, 2018). By the end of 2020, the trading volume of
bitcoin reached a total of around 350,000 trades per day (table 2), displaying the absurd progress
of the bitcoin market.

Table 2: Bitcoin network
 Total number of bitcoin in circulation BTC 16.52 million
 Number of transactions per day (24h) 348,877
 Total Market Capitalisation USD $ 607.49 billion
 Total Market Capitalisation GBP £ 444.59 billion
 Total Market Capitalisation EUR € 508.81 billion
 BTC reward received per block mined BTC 6.25
Source: (Bitcoincharts, 2020a)

At this current stage, bitcoin can be traded on various exchanges over the world using numerous
different currencies (Bitcoincharts, 2020a). In addition to bitcoin, the particular exchanges also
offer other cryptocurrencies, such as litecoins, ripple and ethereum. Table 3 below shows that
the current largest exchanges are Bitstamp, bitFlyer and Kraken, where Kraken is split into an
American and European market. These markets trade in different currencies, of which two uses
USD, one EUR and the other JPY. These three currencies are considered dominant, pertaining
85% of the market (Bitcoincharts, 2020b). As displayed by table 3, there is quite a variation in
rates that are offered for the same currency but on different markets. For example, the 30-day
average price on Bitstamp was $ 35,033/BTC, whilst the 30-day average price on Coinsbit for
the same period of time was $ 35,577/BTC. Shleifer (2000) stated that such deviations in price

 12
could in theory offer arbitrage opportunities. However, Wong (2014) argued that it is quite
challenging to gain favour of such arbitrage on the bitcoin market. For example, during 2014,
the exchange price on the former largest bitcoin exchange (Mt. Gox) constantly showed large
deviations in contrast to other exchanges. Though, in practice, bitcoin trading on Mt. Gox was
blocked due to various technical complications, assuring that an arbitrage strategy would not
have been successful.

Table 3: Top 10 largest bitcoin markets
 Market Currency 30-Day average price BTC 30-day volume
 BitStamp USD $ 35,033 415,935
 Kraken USD $ 35,087 323,355
 bitFlyer JPY ¥ 3,677,821 320,951
 Kraken EUR € 28,936 256,581
 CoinsBank USD $ 35,353 82,481
 Coinsbit USD $ 35,577 71,033
 CoinsBank EUR € 28,966 51,151
 BitBay PLN Zł 132,476 40,922
 BitX ZAR R 552,691 26,194
 BTCBOX JPY ¥ 3,661,923 21,543
Source: (Bitcoincharts, 2020b)

2.2.2.2 Bitcoin market characteristics
The market of bitcoin can be seen as fully transparent, in the sense that the traders are presented
with information regarding the entire state of the order book. The provided information also
includes the available trading volume and corresponding price levels. In addition, the bitcoin
trading platforms also offer a wide range of analysis tools, that for example show the evolution
of market growth within a specific time period. Moreover, all trading platforms offer the
complete history of transactions ever registered, which are accessible by every trader.
Furthermore, the trading platforms do not consist of any iceberg orders or dark pools, meaning
that larger single orders are not being divided into smaller limit orders to hide the actual order
quantity, nor that there are any private exchanges which are not accessible by the public
(Dimpfl, 2017).

 13
Dimpfl (2017) mentioned that similar to the stock markets, bitcoin markets are associated with
several trading costs. First of all, the trading platforms demand transaction fees in order to make
up for their costs. Table 4 below displays the trading fee schedule of Kraken as an example,
which is one of the largest trading platforms for bitcoin. The structure of fees is arranged in a
way that it is cheaper when investing in multiple trades, however, only noticeable when buying
bitcoin worth over 50,000 USD (as seen below). A more appealing feature of the fee structure
is the fact that it makes a distinction between liquidity providers (the ‘maker’) and liquidity
consumers (the ‘taker’).

Table 4: Fee schedule of Kraken
 Volume (USD) Maker Taker
 $0 – $50,000 0.16% 0.26%
 $50,001 – $100,000 0.14% 0.24%
 $100,001 – $250,000 0.12% 0.22%
 $250,001 – $500,000 0.10% 0.20%
 $500,001 – $1,000,000 0.08% 0.18%
 $1,000,001 – $2,500,000 0.06% 0.16%
 $2,500,001 – $5,000,000 0.04% 0.14%
Source: (Kraken, 2019)

Table 4 shows that the fees for using a market order, thus providing liquidity (‘maker’), are
less, meaning that there is an incentive towards customers to forsake immediacy as an
advantage of lower transaction costs. The difference in transaction fees is due to the means of
increasing the supply of liquidity. However, not all fee structures are similar to the schedule of
Kraken. Some trading platforms will only involve one schedule and do not make a distinction
between liquidity consuming and liquidity provision (Dimpfl, 2017). Another cost related to
bitcoin transactions is adverse selection cost (Braido, Da Costa & Dahlby, 2011). These costs
are associated with a situation in which the seller has more information compared to the buyer,
or the other way around, regarding a certain aspect. These costs often occur when asymmetric
information is being used. In general, the seller has the extensive information, which causes the
buyer to be at a disadvantage. Furthermore, bitcoin is anonymous, which generates certain
counterparty risks if any trader acquires private information. Due to the fact that the trading
platforms do not function as market makers, the costs of inventory holding are non-existent.

 14
The structure of a stock market is somewhat formed around the rules and regulations published
by the regulatory authorities. However, in the case of bitcoin, there are no specific regulations.
The European Union ruled in 2015 that bitcoin will be treated as a verified currency from a tax
point of view, meaning that trading in bitcoin is seen as a service, and therefore not subjected
to VAT. The EU specifically mentioned that a bitcoin transaction is seen as similar to
transactions involving bank notes and coins that are used as legal tender (ECJ, 2015).

2.2.3 The investors of bitcoin
The foundation of the bitcoin market is not limited to one country, and its value is not defined
by any commodity (Grinberg, 2011). Therefore, bitcoin has no macroeconomic foundation that
determines its value. Instead, the value is substantially based on self-fulfilling expectations. In
addition, the value is mainly driven by short-term fluctuations and long-term upward trends,
both highly linked to speculations. Supply and demand, specific events, number of exchanges
and specific regulations all influence the value of bitcoin (Bouoiyour, Selmi, Tiwari & Olayeni,
2018). As specified before, the absolute supply of bitcoin is fixed, yet the supply daily traded
alter each day corresponding to the willingness of investors to trade. Regarding the demand of
bitcoin, it fluctuates according to the faith investors have in its perpetual growth (Kristoufek,
2013). Hence, investors and the drivers of investor demand are crucial in order to understand
the price volatility of bitcoin.

It has been said that the bitcoin exchange markets are dominated by speculators, trend chasers,
short-term investors, and noise traders (Kristoufek, 2013; Corbet et al., 2018). Hence, primarily
individual, uninformed investors engage in this market. Notwithstanding, as the bitcoin
exchange market remains to grow, more institutional investors begin to show interest (Corbet
et al., 2018). Thus, the behavioural and cognitive aspects of investors willing to invest in bitcoin
are essential in order to understand the bitcoin market. Grinberg (2011) argued that bitcoin is
greatly affected by bubbles and investors’ loss of confidence, assuring that the bitcoin demand
disintegrates relative to the supply.

2.3 Bitcoin price behaviour
Kristoufek (2015) argued that the fluctuations of bitcoin prices are proven to be quite a
controversial matter since bitcoin gained popularity and accessibility to the wider public.
Despite it being relatively difficult to identify direct factors that could drive the value of bitcoin,
Garcia et al. (2014) stated that the economy of bitcoin is primarily affected by social factors.

 15
However, in order to better understand the price behaviour of bitcoin, it is best to first
understand the behaviour of investors and the behaviour of investors that specifically trade in
bitcoin, by exploring behavioural finance. Once clarified, the price volatility of bitcoin is further
analysed, and drivers of price volatility are presented.

2.3.1 Behavioural Finance
Trades take place based on the varying preferences of investors, their beliefs or on certain
endowments (Grossman & Stiglitz, 1980). In general, economists assume that investors are
solely rational in their decisions and that the various markets accurately exhibit these views
(Fama, 1970). Nevertheless, continuous aberrations from both the random walk as well as the
EMH has led to researchers looking for different explanations regarding price formation (Ritter,
2003). All of this has caused the emergence of behavioural finance. Behavioural finance is
based on certain concepts of cognitive psychology, and is limited to arbitrage (Ritter, 2003).
Certain beliefs or choices assures that not all investors are entirely rational, which creates
inefficient markets. Therefore, the focal point of behavioural finance is the importance of
researching the fundamental reasons behind the investor’s decision-making process. In regard
to this study, behavioural finance can strengthen both the EMH and the market microstructure
by contributing deeper insights into the roots of investor demand.

The roots of behavioural finance can be tracked back to Tversky and Kahneman (1989) and to
Simon (1955). Tversky and Kahneman (1989) argued that the power, scope, and simplicity of
a rational choice model is challenging to equal for alternative models. Nonetheless, they further
stated that adding psychological considerations is also needed despite the normative and
mathematical complexity. Furthermore, Ritter (2003) mentioned that behavioural finance will
progressively be included within mainstream financial research and operation, and stated that
it should not be considered as an autonomous discipline, but rather as an additional source of
information for defining the financial market. These statements were supported by Wilkinson
and Klaes (2017), who argued that behavioural economics solely seek to contribute to the
framework of classic economical theories. Taking this into account, behavioural considerations
should be considered when evaluating the bitcoin market.

 16
2.3.1.1 Decision-making process
Illeditsch (2011) argued that investors neither know the realisation of a certain asset’s payoff
(risk), nor the probability of its occurrence (ambiguity) when evaluating an investment
opportunity. Within these circumstances, investors are not able to form a logic and rational
estimation of chance (Tversky & Kahneman, 1989). For that reason, Tversky and Kahneman
(1989) developed the Prospect Theory, which implies that the outlining of a certain situation
will affect the capability of an investor to act rationally and maximize decisions. Furthermore,
Illeditsch (2011) mentioned that in general investors try to evade ambiguity, and by hedging
against these situations, the investors establish excess volatility and portfolio inertia.
Combining the particular conclusions, in ambiguous, non-transparent circumstances, investors
tend to make non-rational choices. Nevertheless, when the circumstances are transparent and
clear, e.g., having access to all available information, investors can form a rational and well-
informed decision.

The decision process within the prospect theory exists of two stages. It starts with subjecting
the available perspectives to an initial evaluation and arranging them into simplified forms that
are easier to analyse. This process of constructing the perspectives within the outer limits of its
acts, outcomes and contingencies differs between the various investors based on their personal
expectancies, habits, and norms (Tversky & Kahneman, 1989). Within the second stage, the
previously formed perspectives are assessed and the perspective with the highest value is being
picked. This selection is based upon the believes that one perspective overshadows the other,
or as a result of the comparison of their monetary principles. Moreover, Prospect Theory
explains that dissimilarities between the preferences of investors arise from the first stage of
decision making (Tversky & Kahneman, 1989). Hence, the decisive decision revolves around
the approach in which the perspectives have been formed.

2.3.1.2 Behaviour of investors
Simon (1955) developed the fundamentals for the beliefs of bounded investor rationality. When
being confronted with uncertainties, the steps of making a decision are affected by investors
using plain rules of thumb, i.e., heuristics, which forms various biases within conclusions.
Therefore, when the sentiment of investors is leading over facts, the decision-making process
will generally be hardly fulfilling and not optimal (Wilkinson & Klaes, 2017). The paper of
Tversky and Kahneman (1974) showed the first sights of cognitive biases that derived from the
dependence on judgemental heuristics. First of all, Tversky and Kahneman (1974) mentioned

 17
You can also read