FUEL ECONOMY IN MAJOR CAR MARKETS: TECHNOLOGY AND POLICY DRIVERS 2005-2017 - Working Paper 19 - International ...
←
→
Page content transcription
If your browser does not render page correctly, please read the page content below
FUEL ECONOMY IN MAJOR CAR MARKETS:
TECHNOLOGY AND POLICY DRIVERS 2005-2017

                                    Working Paper 19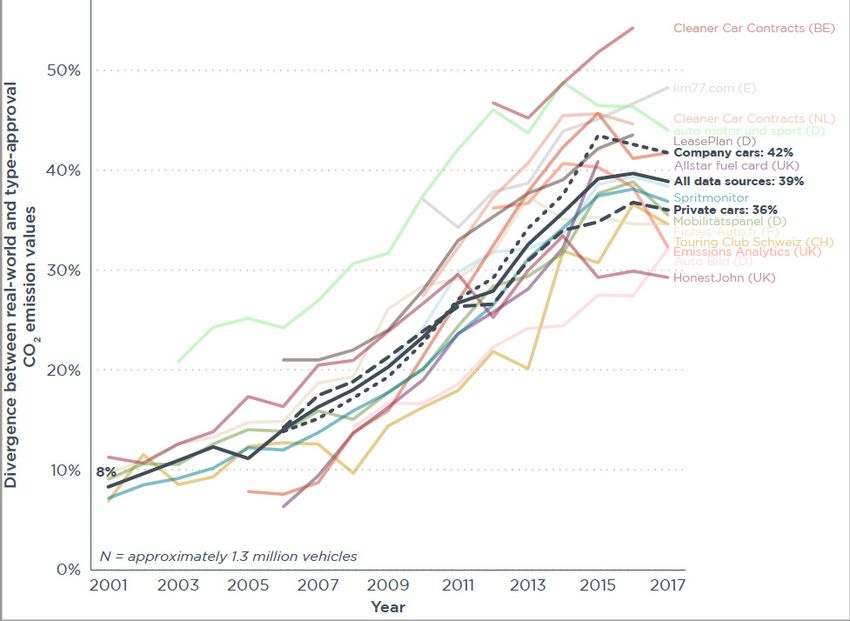
This work is available under the Creative Commons Attribution-NonCommercial-NoDerivatives 3.0
 IGO licence (CC BY-NC-ND 3.0 IGO) https://creativecommons.org/licenses/by-nc-nd/3.0/igo/ . You
   are free to copy and redistribute the material, provided the use is for non-commercial purposes,
                                    under the following conditions:

Attribution - Please cite the work as follows: International Energy Agency (IEA), 2019, (Fuel Economy
    in Major Car Markets: Technology and Policy Drivers 2005-2017). Licence: Creative Commons
    Attribution CC BY-NC-ND 3.0 IGO for all parts of the work except chapters 4 and Annex B, and
 International Energy Agency (IEA)/International Council on Clean Transportation (ICCT), 2019, (Fuel
     Economy in Major Car Markets: Technology and Policy Drivers 2005-2017). Licence: Creative
         Commons Attribution CC BY-NC-ND 3.0 IGO for chapters 4 and Annex B of the work.

Third-party content—the OECD/IEA and ICCT do not necessarily own each component of the content
contained within the work. Therefore, neither the OECD, the IEA, nor ICCT warrant that the use of any
third-party owned individual component or part contained in the work will not infringe on the rights
of those third parties. The risk of claims resulting from such infringement rests solely with you. If you
wish to re-use a component of the work, it is your responsibility to determine whether permission is
needed for that re-use and to obtain permission from the copyright owner. Examples of components
can include, but are not limited to, tables, figures, or images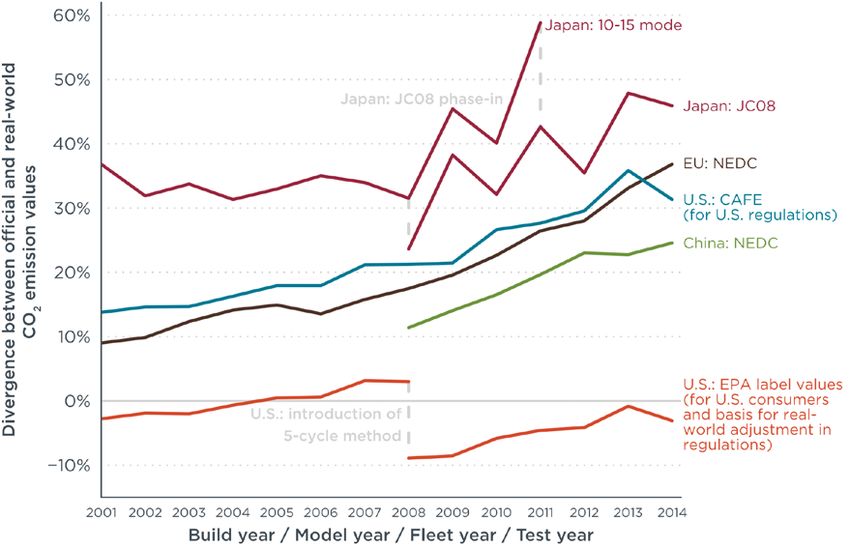
Fuel Economy in Major Car Markets
                                                                      Technology and Policy Drivers 2005-2017

Acknowledgements
This publication was prepared by the Energy Technology Policy Division of the Directorate of
Sustainability, Technology and Outlooks of the International Energy Agency (IEA), under the
direction of Mechthild Wörsdörfer and the guidance of Timur Gül. Pierpaolo Cazzola co-ordinated
the project. The report was prepared in collaboration with the International Council on Clean
                                                                                                Page | 1
Transportation (ICCT), who developed the sections on compliance and enforcement under the
co-ordination of Zifei Yang.
The structure of this report, the methodological choices, the selection of indicators and their
analysis were jointly developed by Pierpaolo Cazzola, Sacha Scheffer, Leonardo Paoli,
Matteo Craglia, Uwe Tietge and Zifei Yang. Leonardo Paoli and Matteo Craglia led the development
of the IEA database update underlying this analysis. Uwe Tietge and Zifei Yang led the drafting of the
compliance and enforcement section. Renske Schuitmaker, Hugo Signollet and Jacopo Tattini
provided valuable support, most notably for the country reports. Bertrand Sadin assisted with the
graphic design.
Representatives of the Global Fuel Economy Initiative (GFEI) partner organisations reviewed the
manuscript, including: Zifei Yang of ICCT, Stephen Perkins of the International Transport Forum,
Sheila Watson and Richard Clarke of the FIA Foundation, Bert Fabian of the United Nations
Environment Program and Lew Fulton of the Institute for Transportation Studies at University of
California, Davis.
Peer reviewers provided essential feedback to improve the quality of the report. They include:
Marine Gorner, Jacob Teter, Jacopo Tattini, Christophe Barret and Apostolos Petropoulos of the
IEA; Christina Victoriano (Ministry of Energy Chile); Andrew Giallonardo (Environment an Climate
Change Canada); Ichiro Gonda (NGK NTK); Christine Rousselle (University of Orleans); Kaoru Horie
and Yuichiro Tanabe (Honda); Lina J. Kindermann (Volkswagen); Paul Miles (Sandia National
Laboratory); Philip Lenart (ExxonMobil); Samsun Remzi Can (Jülich Research Centre); Sara Arab
(Natural Resources Canada); Sonja Munnix (Netherlands Enterprise Agency - RVO); Thierry Spiess
(Natural Resources Canada); Yasuhiro Horikawa (Ministry of Economics, Trade and Industry
Japan); Julio Vassallo (Secretariat of Energy and Mines Argentina) and Yali Zheng (Society of
Automotive Engineers China).
Debra Justus was the primary editor of this report. The authors would also like to thank the
IEA Communications and Digital Office, in particular Astrid Dumond and Therese Walsh, for their
assistance in production and editing.
The FIA Foundation provided funding for this work.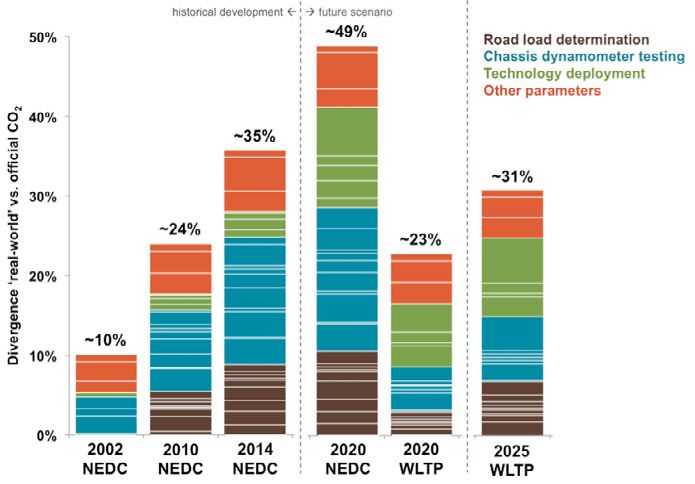
Fuel Economy in Major Car Markets
           Technology and Policy Drivers 2005-2017

           Table of Contents
           Key findings ................................................................................................................ 4
                Market status of new light-duty vehicles ....................................................................................... 4
                Drivers of recent fuel economy trends ........................................................................................... 5
Page | 2
                Links between vehicle efficiency and other attributes to prices .................................................... 7
                The role of policy ............................................................................................................................ 7
                Focus on electrification................................................................................................................... 8
                Real-world fuel economy gap ......................................................................................................... 9
                Looking ahead: Policy recommendations ..................................................................................... 10
           Introduction .............................................................................................................. 11
                Scope .......................................................................................................................................... 12
           1.         Status of light-duty vehicle fuel economy .......................................................... 13
                Global light-duty vehicle market .................................................................................................. 13
                   Status in 2017 .......................................................................................................................................... 13
                   Developments since 2005 ........................................................................................................................ 14
                LDV fuel consumption................................................................................................................... 15
                   Status in 2017 .......................................................................................................................................... 15
                   Fuel economy developments since 2005 ................................................................................................. 17
                   Prospects for fuel economy developments to 2030 ................................................................................. 22

           2.         Drivers of LDV fuel economy.............................................................................. 25
                Vehicle size segments ................................................................................................................... 27
                Vehicle powertrain technology..................................................................................................... 30
                Vehicle power ............................................................................................................................... 33
                Engine displacement ..................................................................................................................... 35
                Vehicle weight .............................................................................................................................. 37
                Vehicle footprint ........................................................................................................................... 39
                Fuel saving technology deployment: Lessons learned ................................................................. 41
                Relationship between fuel economy and vehicle purchase price ................................................ 43
           3.         Focus on powertrain electrification ................................................................... 50
                Market structure and key attributes of electrified vehicles ......................................................... 51
                   Market structure...................................................................................................................................... 51
                   Power rating ............................................................................................................................................ 52
                   Weight distribution .................................................................................................................................. 53
                Effect of EV attributes on fuel economy....................................................................................... 54
                Contribution of electrified vehicles to fuel economy improvements ............................................. 55
           4.         Gap between tested values and real driving fuel economy ................................. 57
                Real driving fuel economy for conventional vehicles ................................................................... 57
                   Tested versus real driving fuel economy.................................................................................................. 57
                   What is widening the gap? ...................................................................................................................... 58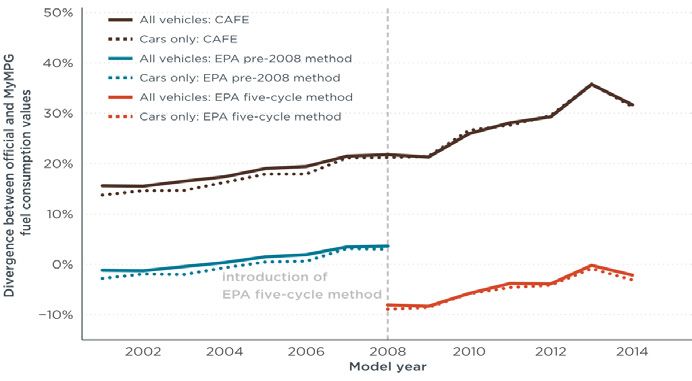
Fuel Economy in Major Car Markets
                                                                                                                 Technology and Policy Drivers 2005-2017

  Policy response ............................................................................................................................. 60
     Compliance and enforcement.................................................................................................................. 61
  Real driving fuel economy for electric vehicles ............................................................................ 64
  References .................................................................................................................................... 67
Annex A. Methodology: LDV fuel economy analysis .................................................... 74                                                                    Page | 3
  Data sources ................................................................................................................................. 74
  Scope .......................................................................................................................................... 75
Annex B. Fuel economy standards: real driving versus tested fuel economy gaps,
           compliance and enforcement in major vehicle markets ........................... 76
  Real driving versus tested fuel economy gaps.............................................................................. 76
     China       .................................................................................................................................................... 76
     European Union ....................................................................................................................................... 77
     Japan .................................................................................................................................................... 78
     United States ........................................................................................................................................... 80
  Compliance requirements for fuel economy standards ............................................................... 81
     China       .................................................................................................................................................... 81
     European Union ....................................................................................................................................... 82
     Japan .................................................................................................................................................... 82
     United States ........................................................................................................................................... 83
  Enforcement of fuel economy standards ..................................................................................... 84
     China       .................................................................................................................................................... 84
     European Union ....................................................................................................................................... 84
     Japan .................................................................................................................................................... 85
     United States ........................................................................................................................................... 85

Annex C. Statistical tables .......................................................................................... 86
  Table C.1 • New light-duty vehicle registrations (thousands) ...................................................... 86
  Table C.2 • Average CO2 emissions/kilometre (g CO2/km, WLTP)................................................ 87
  Table C.3 • Average fuel consumption (Lge/100 km, WLTP)........................................................ 88
  Table C.4 • Average power (kW) .................................................................................................. 89
  Table C.5 • Average displacement (cm3) ...................................................................................... 90
  Table C.6 • Average kerb weight (kg) ........................................................................................... 91
  Table C.7 • Average footprint (m2) ............................................................................................... 92
  Table C.8 • Average vehicle price (thousand USD 2017) .............................................................. 93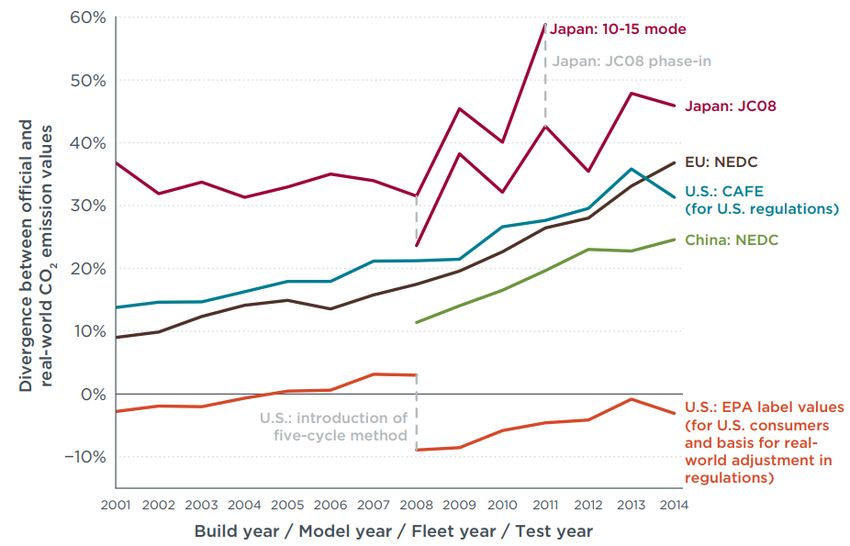
Fuel Economy in Major Car Markets
        Technology and Policy Drivers 2005-2017

        Key findings
        Market status of new light-duty vehicles
         The global average fuel consumption of newly registered1 light-duty vehicles (LDVs) reached
Page | 4
         7.2 litres of gasoline-equivalent per 100 kilometres (Lge/100 km) in 2017 within an LDV market
         where sales have grown by around 10% between 2015 and 2017 (Figure KF1). The average fuel
         consumption between countries differs substantially among countries, ranging between
         5.2 Lge/100 km and 8.9 Lge/100 km.
        Countries can be clustered in three main groups:
                         •       Advanced economies with a gasoline price below USD 1/L – Australia, Canada and the
                                 United States, where average fuel consumption is in the 7.9 to 9 Lge/100 km range.
                         •       Advanced economies with gasoline prices above USD 1/L – European Union,2 Turkey,
                                 Japan and Korea, where fuel use per kilometre ranges between 5.2 and 6.5 Lge/100 km.
                         •       Emerging economies, with average fuel consumption in the 6.5 to 8.5 Lge/100 km range,
                                 with India – which has a fuel consumption of 5.6 Lge/100 km – as an outlier.

        Figure KF1 • Average new LDV fuel economy by country or region (2005-17) and new registrations (2017)

                                                                                                                    83.5 million LDVs

                         12

                         10

                             8
            Lge/100 km

                             6

                             4

                             2

                             0

                                     2005       2010      2015       2017

        Key point: Average LDV fuel economy improved in all regions between 2005 and 2017, though there is a
        wide divergence of absolute levels and trends between countries and regions.
        Note: Fuel consumption measured in Lge/100 km, WLTP.
        Sources: IEA elaboration and enhancement for broader coverage of IHS Markit database (IHS Markit, 2018).

        The average fuel economy improvement rate between 2015 and 2017 slowed down to 1.4% per
        year, which is the lowest since the GFEI benchmarking started (Table KF1). This is one-third of the

        1
          Note that the IHS database used as a basis for the LDV market volumes tracked in this publication aims to cover the first
        registration of new vehicles in each market. These data may be subject to some degree of inaccuracy due to data collection
        challenges (e.g. for second hand imports of vehicles by private individuals moving into the country). Despite this, these data
        have been interpreted here as representative of new vehicle sales, and referred to as ‘new sales’ or ‘new vehicle registrations’.
        2
          Including the other countries in the European Economic Area (Iceland, Norway and Switzerland), depending on the data
        availability per parameter per year (see Annex C).
Fuel Economy in Major Car Markets
                                                                                            Technology and Policy Drivers 2005-2017

required improvement rate (3.7% per year) to meet the 2030 GFEI target, owing to the lower
improvement between 2005 and 2017.
The reduction of the average fuel consumption per kilometre slowed down in advanced
economies to only 0.2% per year, on average, between 2015 and 2017, with more than
20 countries experiencing a reversal in the evolution of their fuel economy. In contrast, the
improvement of fuel use per kilometre in emerging economies accelerated to 2.3%.
                                                                                                                                            Page | 5
Table KF1 • Progress in average fuel economy improvement in different regions and GFEI target for 2030
                                                                          2005            2010               2015       2017      2030

    Advanced                 average fuel economy (Lge/100km)              7.4             6.5               5.8            5.8
 (Gasoline price ≥          annual improvement rate (% per year)                 -2.4%               -2.5%          -0.1%
     USD 1/L)
                                                                                                 -2.0%

    Advanced                 average fuel economy (Lge/100km)             11.0             9.5                8.6           8.6
 (Gasoline price <                                                               -2.9%               -1.9%          -0.4%
     USD 1/L)               annual improvement rate (% per year)
                                                                                                 -2.0%                                4.4
                             average fuel economy (Lge/100km)              8.6             8.5                7.8           7.5
    Emerging                                                                     -0.2%               -1.6%          -2.3%
                            annual improvement rate (% per year)
                                                                                                 -1.2%
                             average fuel economy (Lge/100km)              8.8             8.0                7.4           7.2
  Global average                                                                 -2.0%               -1.5%          -1.4%
                            annual improvement rate (% per year)
                                                                                                 -1.7%

    GFEI target                                         2005 base year                              -2.8%
                     Required annual improvement rate
                                (% per year)
                                                        2017 base year                                                        -3.7%

Note: To remain consistent with previous GFEI benchmarking publications, this table includes all countries in the European Union. This
leads to a minor difference for the average fuel consumption of Advanced > USD 1/L and the Global average in other analyses that only
include the weighted average of the countries that are presented in the graph. Further details on the updated methodology and data
used for this evaluation are available in Annex A.
Sources: IEA elaboration and enhancement for broader coverage of IHS Markit database (IHS Markit, 2018).
Key point: Annual improvement is slowing in advanced economies and accelerating in emerging
economies. Both rates are below those needed to achieve the GFEI target.

Drivers of recent fuel economy trends
Key drivers of the recent developments of the average fuel consumption include the rapid decline
of diesel sales in several major vehicle markets, most notably in Europe, the advanced economy
with the greatest reliance on this powertrain technology (Figure KF2). Since 2015, diesel shares
have fallen by 5-15 percentage points in the largest EU markets, a change that was not sufficiently
counterbalanced by the 1-3 percentage point growth of electrified LDVs to maintain efficiency
improvements over gasoline vehicles.
Fuel Economy in Major Car Markets
Technology and Policy Drivers 2005-2017
Figure KF2 • Dieselisation rate and average fuel consumption trends in selected countries, 2014-17
70% 6.2
Average fuel conusmption (Lge/100 km)
65% 6.0
Diesel market share
60% 5.8
Page | 6 55% 5.6
50% 5.4
45% 5.2
40% 5.0
2014 2015 2016 2017 2014 2015 2016 2017
Germany United Kingdom France
Sources: IEA elaboration and enhancement for broader coverage of IHS Markit database (IHS Markit, 2018).
Key point: Countries with decreasing shares of diesel powertrains saw a worsening trend in average fuel
consumption in 2016-17.
The growing consumer demand for larger vehicles – a characteristic that has been common to all
vehicle markets despite ongoing efficiency improvements per vehicle segment – is also a major
determinant of recent developments in the average fuel economy of LDVs (Figure KF2). The
market share of sport-utility vehicles (SUVs) and pick-ups has grown by 11 percentage points since
2014 and, in 2017, represented nearly 40% of the global LDV market. North America and Australia
have had a particularly high market share of SUVs/pick-ups, closing in on 60% in 2017. Most of the
growth has taken place in the small SUV/pick-up segment, which includes many cross-over
versions of popular passenger cars.
Figure KF3 • Global average market share per vehicle segment and average fuel consumption per
segment, 2014-17
30% 11.0
Average fuel conusmption (Lge/100 km)
25% 10.0
Market share
20% 9.0
15% 8.0
10% 7.0
5% 6.0
0% 5.0
2014 2015 2016 2017 2014 2015 2016 2017
City car Medium car Small SUV/pick-up Large car Large SUV/pick-up
Sources: IEA elaboration and enhancement for broader coverage of IHS Markit database (IHS Markit, 2018).
Key point: Even if the average fuel consumption of each vehicle segment continues to improve, the
overall average fuel consumption is affected by the growing market share of more energy-intensive SUVs
and pick-ups, taking place at the expense of more fuel-efficient passenger car segments.
A third important, determining factor in recent global fuel economy developments is the shift in
market structures of advanced economies. There has been a decline in the market share of North
America (which has larger and, therefore, less efficient vehicles), and a subsequent growth of the
relevance of markets characterised by the smaller and more efficient vehicles sold in Europe,
Japan and Korea. This has been accompanied by a contextual increase, for emerging economies,
of the relevance of the People’s Republic of China (“China”) – where fuel economy is subject toFuel Economy in Major Car Markets
Technology and Policy Drivers 2005-2017
regulations requiring significant fuel economy improvements – and India, a market that has
traditionally been characterised by large shares of small and fuel-efficient cars.
Links between vehicle efficiency and other attributes to prices
Analysing vehicle prices against other attributes indicates that consumers are prepared to pay a
Page | 7
significant price premium for vehicles belonging to large market segments (with higher mass and
footprint) and for those having a high power rating. Changes in vehicle attributes such as power,
weight or footprint can mitigate the risk of price increases that could be induced by the increased
adoption of fuel-efficient technologies.
Diesels, hybrids and electric vehicles cost more than gasoline vehicles having similar attributes. In
particular, battery-electric vehicles (BEVs) and plug-in hybrid electric vehicles (PHEVs) offer very
large improvements in fuel consumption, but this was coupled with a significant price premium in
2017. However, vehicle prices need to be analysed in rather narrow groups of attributes such as
power, market segment, and size in order to see the impact of changes in powertrain
technologies. This suggests that the impact of powertrain choices on vehicle prices is lower than is
the impact of changes in other vehicle attributes.
When looking at vehicles in the same market segment, with similar power and size, and with the
same powertrain type, fuel efficiency is not coupled with higher vehicle prices. The 25% most
efficient vehicles cost 5-7% less than the average equivalent vehicle, and the average fuel
economy improvements they deliver are between 0.6 and 0.8 Lge/100 km.
The analysis of vehicle prices also shows that small vehicles are cheaper in emerging economies
than in advanced countries, and that this is not the case for large segments.
The role of policy
A growing amount of evidence highlights the importance of policies to improve average fuel
consumption (Figure KF4). Countries with regulations and/or efficiency-based purchase incentives
in place improved on average 60% faster than countries without such policies. The higher
improvement rate is also reflected by the higher market share of electrified LDVs (hybrids, PHEVs,
BEVs and fuel cell electric vehicles).
Even if none of the countries with policies in place experienced fuel economy improvements fast
enough to keep up with the 2030 GFEI target of halving the average fuel use per kilometre by 2030
(against a 2005 benchmark), several markets require improvement rates that are in line with it.
The scope of existing fuel economy regulations is limited to the next few years in nearly all cases.
Standards in North America range between 2018 and 2025, whereas no Asian country has a
standard beyond 2022. Europe is the only region that defined fuel economy improvements
reaching to the year 2030.Fuel Economy in Major Car Markets
Technology and Policy Drivers 2005-2017
Figure KF4 • Average annual fuel economy improvement rates for selected countries with and without
fuel economy regulations between 2012 and 2017
4%
3%
Page | 8
2%
1%
0%
Regulated and/or purchase incentives No regulation and/or purchase incentives
GFEI target (baseline = 2012) Share of electrified powertrains
Notes: Regulated countries are Canada, China, European Union, India, Japan, Mexico, Korea and the United States. Countries without
regulations but with incentives are Australia, Brazil, Chile, Malaysia, South Africa, Thailand and Turkey. Countries without incentives
and regulations are Argentina, Egypt, Indonesia, Peru, Philippines, Russian Federation and Ukraine. Values are weighted based on
vehicle sales in 2017. Incentives are efficiency-based taxes or subsidies for vehicle purchase on a national level. Alternative
powertrains are hybrids, PHEVs and BEVs.
Sources: IEA elaboration and enhancement for broader coverage of IHS Markit database (IHS Markit, 2018); (Transportpolicy.net,
2018a); (IEA, 2018b); (ICCT, 2018c).
Key point: Yearly improvement rates for fuel consumption are higher in countries with regulations or
incentives. Nearly no countries or regions are on track to meet the 2030 GFEI target.
Focus on electrification
The electrification of LDVs is going to be crucial to ensure that fuel economy can be effectively
improved, especially if diesel shares keep falling (Figure KF5). Electrified vehicles are already
contributing positively to improve the country-weighted average fuel consumption by up to 3.5%.
Japan experienced the largest gains due having to the largest market share globally for hybrids,
followed by the United States with a mix of electrified vehicle types (HEV, BEV and PHEV).
Electrification in China was also very relevant to improve the average fuel economy, thanks to a
fast-growing market share for BEVs and PHEVs. Countries that currently have high average fuel
consumption values (which typically go hand-in-hand with high shares of large and heavy vehicles)
can benefit the most from electrification since electrified vehicle efficiency is less dependent on
size and weight.Fuel Economy in Major Car Markets
Technology and Policy Drivers 2005-2017
Figure KF5 • Contribution to the fuel consumption savings from electrified vehicles, 2017
0.25 5%
Savings as a % of the average fuel
Average fuel consumption savings
0.2 4%
consumption
(lge/100 km)
0.15 3%
0.1 2%
Page | 9
0.05 1%
0 0%
Hybrid Battery electric and plug-in hybrid Savings as a % of the average fuel consumption
Note: Savings are calculated by substituting electrified vehicles, in each market segment and power class, by vehicles characterised by
the average fuel use of the market segment and power class.
Source: IEA elaboration and enhancement for broader coverage of IHS Markit database (IHS Markit, 2018).
Key point: The largest fuel economy benefits from electrification in 2017 were experienced by Japan, the
United States and China.
Real-world fuel economy gap
The gap between fuel consumption measured according to test values and in real-driving
conditions grew over the past decade in most vehicle markets to reach values in 2017 that in
some cases were almost 50% higher than the tested fuel consumption per kilometre (Figure KF6).
Figure KF6 • Divergence between official and real-world CO2 emission values for selected countries,
2001-14
Source: Tietge et al. (2017).
Key point: All key vehicle markets except for the United States show a gap of more than 10% between
laboratory tested and real-world fuel consumption, which diverged to as high as 50% by 2014.Fuel Economy in Major Car Markets
Technology and Policy Drivers 2005-2017
Compliance and enforcement policies help achieve a more realistic representation of fuel
economy in real-world conditions. Most major vehicle markets have started to take action to
develop these measures and currently have varying types of compliance policies in place, whereas
enforcement policies are less abundant. The United States has the most comprehensive policy
framework to ensure well-functioning compliance and enforcement.
Page | 10
Looking ahead: Policy recommendations
Meeting the 2030 GFEI target at the global level requires a widespread adoption of regulatory
policies setting requirements for the improvement of fuel economies over time, combined with
fiscal instruments to stimulate consumer demand for the vehicle technologies that offer the best
performance. Long-term commitments are important to ensure that the investments necessary to
deploy electrification technologies, which are crucial to meeting the GFEI targets in a phase where
consumers are losing confidence in diesel, can take place. Tightening the rules governing the
measurement of fuel consumption during tests, combined with measures capable of safeguarding
on-road compliance, are essential to ensure that all stakeholders take effective action to meet the
policy goals.Fuel Economy in Major Car Markets
Technology and Policy Drivers 2005-2017
Introduction
This report builds on a series of Global Fuel Economy Initiative (GFEI)3 working papers
investigating the fuel economy of newly registered4 light-duty vehicles (LDVs) across the world
from 2005 to 2017.5 The results are tracked relative to established GFEI targets, which are an
intermediate target of 30% improvement of new LDV fuel economy, weighted globally, by 2020,
Page | 11
and 50% by 2030.
The analysis builds on methodological improvements introduced in the previous GFEI report (GFEI and
IEA, 2017; GFEI and IEA, 2014; GFEI and IEA, 2012), and it maintains the broad country coverage that
has characterised these analyses. Only Norway and Switzerland did not have additional data for 2016
and 2017. This report presents all the fuel consumption results calibrated to the Worldwide
Harmonised Light-Duty Test Procedure (WLTP) (ICCT, 2014). 6
Key elements of this report include:
• An assessment of LDV fuel economy progress from 2005 to 2017. It describes the main
indicators in 2017 and evaluates progress in the previous two years as well as the twelve-year
trend.
• Analysis of key developments of major drivers that influence fuel economy, outlining the
status per country in 2017 and the twelve-year evolution of these variables for key regional
groupings. These results are also considered in terms of expected progress towards the 2030
GFEI goals.
• A focus on LDV prices which aims to provide better insight into the costs of energy efficiency
in the LDV market.
• A section investigating the main drivers of tested fuel economy in electrified vehicles.
• A special focus looking at the divergence between real driving fuel consumption and tested
fuel economy of LDVs, and the corresponding compliance and enforcement aspects related to
testing. It takes account of the evidence emerging from recent assessments (e.g. Tietge et al.,
2017) that show that the revision of test procedures, and, in particular, the introduction of
the WLTP, enable only limited progress to match real driving fuel consumption values. This
section discusses measures that can help narrow the gap.
In addition, this report is accompanied by a set of 18 country-specific assessments containing
information on key socio-economic indicators, brief outlines of the policy framework influencing
vehicle fuel economy and graphs showing key vehicle characteristics over time. These country
assessments are available online at: www.iea.org/topics/transport/gfei.
3
The GFEI is a partnership of the International Energy Agency (IEA), United Nations Environment Program (UNEP),
International Transport Forum of the OECD (ITF), International Council on Clean Transportation (ICCT), Institute for
Transportation Studies at University of California Davis, and the FIA Foundation.
4
Note that the IHS database used as a basis for the LDV market volumes tracked in this publication aims to cover the first
registration of new vehicles in each market. These data may be subject to some degree of inaccuracy due to data collection
challenges (e.g. for second-hand imports of vehicles by private individuals moving into the country). Despite this, these data
have been interpreted here as representative of new vehicle sales, and referred to as “new sales” or “new vehicle
registrations”.
5
The report updates the information published in GFEI Working Paper 15 (GFEI and IEA, 2017).
6
Three test cycles are applied worldwide to measure specific fuel consumption (litres of gasoline equivalent per
100 kilometres) or fuel economy (miles per gallon or kilometres per litres of gasoline equivalent): the European New European
Driving Cycle (NEDC), the US Corporate Average Fuel Economy (CAFE) and the Japan Cycle ’08 (JC08). The WLTP and its related
test cycle (WLTC) have been developed (and are being refined) to replace region-specific approaches with a harmonised
testing scheme (UNECE, 2014). The conversion of the results (published according to region-specific test results) was
performed using conversion equations developed by the ICCT (2014).Fuel Economy in Major Car Markets
Technology and Policy Drivers 2005-2017
The methodology adopted to develop the IEA-GFEI database underpinning the analysis is outlined
in Annex A. Annex B gives details on the growing evidence of increasing gaps between on-road
and tested fuel economy performance, and highlights compliance and enforcement frameworks
in the major vehicle markets. Annex C includes statistical tables with data on new vehicle
registrations, average grammes of carbon dioxide emissions per kilometre, fuel consumption,
power, displacement, weight, footprint and price.
Page | 12
Scope
This study includes the new registrations of light-duty vehicles, a category defined as passenger
cars, passenger light trucks and light-commercial vehicles below 3.5 tonnes. The countries
included in this analysis are Argentina, Australia, Brazil, Canada, Chile, People’s Republic of China,
Egypt, most European countries (all countries in the European Union, the other countries in the
European Economic Area [including Iceland, Norway and Switzerland], Former Yugoslav Republic
of Macedonia, Turkey and Ukraine), India, Indonesia, Japan, Malaysia, Mexico, Peru, Philippines,
Russian Federation, South Africa, Korea, Thailand and United States. Germany, France, Italy and
United Kingdom are presented separately from the European Union, with more detailed
information in several analyses. Due to data availability, not each country could be represented
for all years in this analysis (coverage is available in Annex C).Fuel Economy in Major Car Markets
Technology and Policy Drivers 2005-2017
1. Status of light-duty vehicle fuel economy
Global light-duty vehicle market
Status in 2017 Page | 13
Worldwide sales of new vehicles totalled nearly 97 million in 2017, of which 26 million
commercial vehicles7 and 71 million passenger cars (OICA, 2018). Passenger cars sales went up
4 million from 2015 and 25 million more than in 2005. The IEA-GFEI database for 2017 covers
45 million passenger cars and 38 million passenger light trucks or light-commercial vehicles.
Emerging and advanced economies had similar numbers of new light-duty vehicle (LDV)
registrations8 with 47% and 53% of the market respectively (Figure 1). The largest single market is
China with 25.5 million sales in 2017, followed by the European Union with 16.7 million, United
States with 16.3 million and Japan with 5.1 million in LDV sales. The countries analysed in this
report represent more than 90% of estimated global new LDV sales (OICA, 2018).
Figure 1 • New LDV registrations, 2017
1 million
sales
Note: Others (emerging economies) includes Argentina, Chile, Egypt, Malaysia, Peru, Philippines, South Africa, Thailand and Ukraine.
Sources: IEA analysis based on IHS Markit database (IHS Markit, 2018).
Key point: Sales in advanced economies are 11% higher than in emerging economies. Together China,
European Union and United States accounted for 59 million LDV sales.
7
Commercial vehicles includes both LDVs and heavy-duty vehicles (HDVs), making it challenging to estimate the total LDV sales.
8
Note that the IHS database used as a basis for the LDV market volumes tracked in this publication aims to cover the first
registration of new vehicles in each market. These data may be subject to some degree of inaccuracy due to data collection
challenges (e.g. for second-hand imports of vehicles by private individuals moving into the country). Despite this, these data
have been interpreted here as representative of new vehicle sales, and referred to as “new sales” or “new vehicle
registrations”.Fuel Economy in Major Car Markets
Technology and Policy Drivers 2005-2017
Developments since 2005
The increasing share of LDVs sold in emerging economies accounted for most of the additions to
the world’s vehicle stock in 2017 (Figure 1). The starkest example is the People’s Republic of China
(“China”) where new registrations increased 17% per year in the period 2005 to 2017.9 Other
countries with rapidly increasing vehicle sale rates are India at 9% and Indonesia at 7%.
Page | 14 Consequently, LDV sales in emerging economies have tripled since 2005 with the biggest volume
rise in China, where sales were seven-times higher in 2017 than in 2005.
LDV sales in advanced economies are characterised by stagnation and, in some cases, slight
decreases. Annual growth rates in advanced economies have been below 1%, resulting in a sale
volume increase of 5.5% over the 12-year period. The European Union market increased by 12%,
with the largest markets (France, Germany and United Kingdom) increasing between 1.5% and
4.5%. Italy and Japan are the two largest advanced markets that saw lower LDV sale volumes
(-13% and -9% respectively) over the 12-year period. LDV sales also stagnated in the
United States, with 2017 sales only being 1% higher than those in 2005.
Given the growth dynamics of emerging economies and a development phase that, historically,
has been characterised by strong increases in LDV ownership, it is likely that these economies will
continue to account for most of the increase of global vehicle sales in the years ahead.
Conversely, most advanced economies are considered saturated due to high vehicle ownership
levels; sales volumes are therefore expected to remain relatively steady in these markets in the
years ahead (IEA, 2018a).
Figure 2 • LDV sales in selected advanced and emerging economies, 2005-17
90
80
LDV registrations (millions)
70
60
50
40
30
20
10
0
2005 2006 2007 2008 2009 2010 2011 2012 2013 2014 2015 2016 2017
Other emerging China United States European Union Other advanced
Note: Other emerging economies includes Argentina, Brazil, Chile, Egypt, India, Indonesia, Malaysia, Mexico, Peru, Philippines, Russian
Federation, South Africa, Thailand and Ukraine. Other advanced economies includes Australia, Canada, Japan, Korea and Turkey.
Source: IEA analysis based on IHS Markit database (IHS Markit, 2018).
Key point: Sales volume in emerging economies increased more than three-fold between 2005 and 2017,
while sales in advanced economies were relatively flat.
9
The most recent sales statistics indicate that 2018 will be the first year with a decrease in LDV sales in China since the early
1990s (Reuters, 2019).Fuel Economy in Major Car Markets
Technology and Policy Drivers 2005-2017
LDV fuel consumption
Status in 2017
There were large differences in the average sales-weighted specific fuel consumption litres of
gasoline equivalent per kilometre [Lge/km] of new vehicles in countries around the world in 2017
(Table 1).10 Page | 15
Italy, France, Turkey and India have the lowest average specific fuel consumption (hereafter, “fuel
consumption”) of all major car markets examined in this report, with values equal to
5.4 Lge/100 km or lower. Other large countries in the European Union, Japan and Korea have fuel
economies in the range of 5.8 to 6.3 Lge/100 km. Most emerging economies have fuel economies
between 7.0 and 8.4 Lge/100 km, with the exception of India (5.6 Lge/100 km) and Ukraine
(6.8 Lge/100 km). On a global basis, Canada (8.9 Lge/100 km) and United States (8.6 Lge/100 km)
have the highest average fuel consumption per kilometre.
Table 1 • Tested fuel consumption of new LDVs in selected markets, 2017
Country Lge/100 km Country Lge/100 km Country Lge/100 km
Argentina 7.9 Germany 5.9 Peru 8.1
Australia 7.9 India 5.6 Philippines 8.4
Brazil 7.6 Indonesia 7.9 Russian Federation 8.2
Canada 8.9 Italy 5.2 South Africa 7.4
Chile 8 Japan 6.2 Thailand 7.5
China 7.6 Korea 6.3 Turkey 5.4
Egypt 8 Malaysia 7.1 Ukraine 6.8
France 5.3 Mexico 7.6 United Kingdom 5.8
United States 8.6
Note: Lge = litres of gasoline equivalent per kilometre.
Source: IEA analysis based on IHS Markit database (IHS Markit, 2018).
Key point: Average fuel consumption ranges between 5.2 and 8.9 Lge/100 km.
Figure 3 illustrates the sales-weighted average fuel consumption in select countries relative to
gross domestic product (GDP) per capita and gasoline price in US dollars (USD) at annual average
market exchange rates in 2017.
10
All fuel consumption values in this report are expressed as litres of gasoline-equivalent per 100 kilometres. Values are
converted from national drive cycles to the Worldwide Harmonised Light-Duty Test Procedure (WLTP) cycle.Fuel Economy in Major Car Markets
Technology and Policy Drivers 2005-2017
Figure 3 • Fuel consumption relative to GDP and gasoline price (2016) for selected countries, 2017
Average fuel consumption (Lge/100 km)
10 10
Average fuel consumption [(ge/100 km)
Phi l ippines Uni ted States Ca na da
Ca na da
9 Uni ted States 9
Rus sia Rus sia Phi l ippines
Peru
Egypt Chi l e Peru Chi l e
8 Chi na 8
Argenti na Aus tra lia Aus tra lia Argenti na
Indonesia Bra zi l Indonesia Bra zi l
Page | 16 South Afri ca Mexi co Tha iland
Chi na
Mexi co South Afri ca
7 7
Ukra i ne Korea Ukraine Korea
Tha iland Ma l a ysia Ja pa n Ja pa n Germa ny
6 Germa ny 6
Turkey Fra nce Uni ted Ki ngdom
India Fra nce
Ita l y Uni ted Ki ngdom
India Turkey Ita l y
5 5
0 10 000 20 000 30 000 40 000 50 000 60 000 0.5 1 1.5 2
GDP per capita (USD/capita) Gasoline price (USD/L)
Advanced ≥ USD 1/L Advanced < USD 1/L Emerging
Notes: GDP values refer to USD with annual average exchange rates in 2017. Gasoline prices are for 2016. Advanced < USD 1/L =
advanced economies with gasoline prices below USD 1 per litre; Advanced > USD 1/L = advanced economies with gasoline prices above
USD 1 per litre.
Sources: IEA analysis based on IHS Markit database (IHS Markit, 2018); World Bank (2018) for GDP per capita and GIZ (2017) for
gasoline prices.
Key point: Countries can be grouped based on their average fuel consumption, income level and fuel
price, and fuel economy is better in country groups subject to higher-than-average fuel prices.
Figure 3 suggests that countries can be broadly classified into three clusters with similar LDV market
characteristics. These categories are used throughout this report to discuss global developments.
• Advanced economies with 2016 gasoline prices below USD 1 per litre at market exchange
rates (MER) (Australia, Canada and United States).11
Australia, Canada and United States accounted for around 23% of total LDV sales in 2017. The
group is characterised by high-income levels, fuel taxes that are on the low end of the global
range and high fuel consumption per kilometre. These countries are characterised by relatively
low population density and a high vehicle mileage compared to the global average (IEA, 2018a).
• Advanced economies with 2016 gasoline prices above USD 1 per litre (MER) (European
Union,12 Japan, Korea and Turkey).
The European Union, Japan, Korea and Turkey accounted for approximately 30% of global LDV
sales of in 2017. The cluster is characterised by medium- to high-income levels, high fuel taxes
and relatively low fuel consumption per kilometre.13 These countries have a higher population
density and lower average vehicle mileage than those in the other advanced economy
category (IEA, 2018a).
• Emerging economies14
This category includes a variety of countries from across the globe and accounts for 47% of
total LDV sales of in 2017. It is characterised by countries with low- to medium-income levels,
generally lower fuel taxes than countries in the second advanced economy category and have
fairly high fuel consumption per kilometre (IEA, 2018a). The population density is more
11
Gasoline was chosen as the benchmark as it fuels the majority of LDVs worldwide. In most cases, countries with a gasoline
price below USD 1/L also have diesel price in that price range.
12
Including the other countries in the European Economic Area (Iceland, Norway and Switzerland), depending on the data
availability per parameter per year (see Annex C).
13
Turkey is an exception due to lower income levels. It is included in this category due to the proximity of its car market to the
European Union.
14
Argentina, Brazil, Chile, China, Egypt, India, Indonesia, Malaysia, Mexico, Peru, Philippines, Russian Federation, South Africa,
Thailand and Ukraine.Fuel Economy in Major Car Markets
Technology and Policy Drivers 2005-2017
variable than advanced economies, as well as the vehicle mileage, which is generally lower
than advanced economies due to less developed infrastructure.
India is included in this cluster because of its income level, despite having lower fuel
consumption than the category average.
Fuel economy developments since 2005 Page | 17
The expanding volume of LDVs sales in emerging economies since 2005 has had a substantial
impact on average fuel economy on a worldwide basis (Figure 4). In 2005, global average fuel
consumption reflected the level in advanced economies since they comprised almost 80% of the
global car market. In the period since 2005, emerging markets have accounted for rising shares of
LDV sales and fuel economy improvements in advanced economies have had a weaker influence
on the measure of global average fuel consumption (and, vice versa, the influence of emerging
economies gained strength).
Figure 4 • LDV sales and average fuel consumption in advanced and emerging economies, 2005-17
100% 10
Average fuel consumption (Lge/100 km)
75% 9
Share of LDV sales (%)
50% 8
25% 7
0% 6
2005 2006 2007 2008 2009 2010 2011 2012 2013 2014 2015 2016 2017
Emerging Advanced Advanced (right-axis) Emerging (right-axis) World (right-axis)
Note: Advanced < USD 1/L = advanced economies with gasoline prices below USD 1 per litre; Advanced > USD 1/L = advanced
economies with gasoline prices above USD 1 per litre.
Source: IEA analysis based on IHS Markit database (IHS Markit, 2018).
Key point: Global average fuel consumption is increasingly influenced by trends in emerging economies.
Between 2005 and 2011, average fuel consumption in advanced economies improved at a rate of
2.7% per year compared with 0.3% per year in emerging economies. Conversely, in the period
between 2011 and 2017, emerging economies improved at a faster rate (2.0%) than advanced
economies (1.3%).
Shifting sales and changes in the rates of fuel efficiency improvements in both advanced and
emerging economies have led to a convergence of the impact on the global average fuel
consumption. Both advanced economies and emerging economies varied less than 3% from the
global average fuel consumption in 2017, whereas this variance was almost 6% in 2013.
The bigger impact of emerging economies on global average fuel consumption in the period
2005-17 is evident in a variety of trends within and between countries (Figure 5). Among the
emerging economies, China had the largest increment in the number of new LDV registrations at
22 million and its market share expanded by nearly 600%. In 2005, 3.7 million LDV sales in China
represented only 30% of all such sales in emerging economies, whereas China’s LDV sales of
25.5 million in 2017 accounted for nearly two-thirds of the LDV market in emerging economies.
Second after China, India’s LDV sales have tripled since 2005 and the year-on-year sales growth rate
increased from 5.5% in 2015 to 9.7% in 2017, which is almost three-times the overall sales growth
rate in emerging economies. In other emerging economies, year-on-year LDV sales did not show
distinct growth patterns over the past five years. For example, LDV sales in Brazil increased by 9.5%Fuel Economy in Major Car Markets
Technology and Policy Drivers 2005-2017
between 2016 and 2017 after four years of decline ranging between -1.6% and -25.6%. Mexico
declined by 4.5% in 2017 from the previous year after two years of nearly 20% annual growth.
Average fuel economy accelerated in emerging economies from 1.5% per year in 2010-15 to 2.4% in
2015-17. This boost reflects strong efficiency gains in China and other emerging Asian economies
(excluding India), which improved by nearly 3% per year. The pace of fuel economy improvements
in Latin America, India and other emerging economies slowed to 0.3-1.8% in the 2015-17 period.
Page | 18
The increased improvement rate for emerging economies was strengthened by a shift in market size
towards China and other Asia of 9%. Recent trends in emerging economies vehicle markets have
been volatile; China improved by 3.9% in 2015-16, while only at 1.6% in 2016-17.
Figure 5 • Share of LDV sales and average fuel consumption in emerging economies, 2005-17
100% 9
Average fuel consumption (Lge/100 km)
75% 8
Share of LDV sales
50% 7
25% 6
0% 5
2005 2008 2010 2011 2012 2013 2014 2015 2016 2017
Other emerging Latin America Other Asia India China All emerging (right-axis) Fuel consumption (right-axis)
Notes: Other Asia includes Indonesia, Malaysia, Philippines and Thailand. Latin America includes Argentina, Brazil, Chile, Mexico and
Peru. Other emerging economies include Egypt, Russian Federation, South Africa and Ukraine.
Source: IEA analysis based on IHS Markit database (IHS Markit, 2018).
Key point: China’s LDV market grew the most among emerging economies in both absolute terms and
market share. Most emerging economies boosted fuel economy after 2011, though with a slowdown in
2015-17.
In 2017, the average fuel consumption of emerging economies was rather close to the average of
all advanced economies and the global average. The main exception is India, with average fuel
consumption that consistently has been around 25% lower than the average of all emerging
economies since 2005. Excluding India, the average fuel consumption in emerging economies
would have been 0.2 Lge/100 km higher in 2017.
LDV sales and average fuel consumption in advanced economies show mixed trends in the period
since 2005 (Figure 6). Japan did not experience major changes in its market size. The European
Union experienced a decline in LDV sales after the 2008 economic crisis until 2014. The market
size increased in Korea and rebounded significantly in North America after the 2008 economic
crisis, starting in 2011. This led to a shift towards markets that have higher fuel use per kilometre
in the cluster of advanced economies, and came with a reduction in the fuel efficiency rate of
improvement in advanced economies in the 2010-14 period, compared with earlier years. Since
2014, the situation reversed, with European Union sales growing faster than North America. This
largely explains why the fuel economy across all advanced economies continued to improve in
recent years, despite stagnating or worsening average fuel consumption in around half of the
countries in the advanced economy categories.Fuel Economy in Major Car Markets
Technology and Policy Drivers 2005-2017
Figure 6 • Market distribution and average fuel consumption in advanced economies, 2005-17
100% 12
Average fuel consumption (Lge/100 km)
75% 10
Share of LDV sales
50% 8
Page | 19
25% 6
0% 4
2005 2008 2010 2011 2012 2013 2014 2015 2016 2017
Advanced Asia Europe Advanced < USD 1/L All advanced (right-axis) Fuel consumption (right-axis)
Notes: Advanced Asia includes Japan and Korea. Europe includes the European Union, Iceland, Norway, Switzerland and Turkey.
Advanced < USD 1/L includes Australia, Canada and United States.
Source: IEA analysis based on IHS Markit database (IHS Markit, 2018).
Key point: The increase in the market share of Canada and the United States, combined with a reduction
in fuel economy improvements in recent years in Europe and Japan, led to a deceleration of fuel economy
improvements in advanced economies after 2010.
The impact of the introduction of mandatory fuel economy standards or efficiency-based
incentives for vehicle purchase is visible in the market. The average fuel economy improvement
rate of countries after implementing fuel consumption standards or efficiency-based purchase
incentives after 2005 was nearly 60% higher than countries without standards and incentives
(Figure 7). Nevertheless, the improvement rate of countries with fuel efficiency measures falls
short by about half of the rate required to reach the GFEI 2030 target. For countries without
regulations and incentives, improvements have been less than a third of what is required to meet
the GFEI 2030 target.
Figure 7 • Average annual fuel economy improvement rates for countries with and without fuel economy
regulations/incentives, 2012-17
4%
3%
2%
1%
0%
Regulated and/or purchase incentives No regulation and/or purchase incentives
GFEI target (baseline = 2012) Share of electrified powertrains
Notes: Countries that have fuel economy regulations are Canada, China, European Union (including European Economic Area), India,
Japan, Mexico, Korea and United States. Countries without regulations, but with incentives are Australia, Brazil, Chile, Malaysia,
South Africa, Thailand and Turkey. Countries without regulations or incentives are Argentina, Egypt, Indonesia, Peru, Philippines,
Russian Federation and Ukraine. Values are weighted based on vehicle sales in 2017. Incentives are efficiency-based taxes or subsidies
for vehicle purchase. Electrified powertrains are hybrids, plug-in hybrids, fuel-cell electric vehicles and battery-electric vehicles.
Sources: IEA analysis based on IHS Markit database (IHS Markit, 2018); Transportpolicy.net (2018a); IEA (2018b); ICCT (2018a).
Key point: Annual fuel economy improvement rates are higher in countries with regulations and/or
incentives, yet no country group is on track to meet the GFEI 2030 target.
Korea, China and the European Union have achieved the fastest rates of improvement since their
fuel economy regulations came into force with annual improvement rates of 1.7-2.3%. The
average improvement rate prior to the regulations was 1.1% per year, a rate similar to countriesFuel Economy in Major Car Markets
Technology and Policy Drivers 2005-2017
today that do not have fuel economy regulations. This highlights the potential of fuel efficiency
gains when regulations are implemented.
Countries that do not have fuel economy standards or incentive may have more year-on-year
swings in fuel efficiency. For example, average fuel economy worsened in at least four years in
Argentina and Indonesia since 2005, whereas this slippage occurred only once in the
European Union (2017) and not at all in the United States in the period since 2005.
Page | 20
The uptake of fuel saving electric powertrain technologies (hybrid, plug-in hybrid and battery
electric) is higher in countries with regulations and incentives than those without. For countries
with regulations and/or incentives, electric LDVs represented 3.6% of new sales in 2017, while for
countries without regulations or incentives electric LDV sales were only 0.1%.
The structure of the efficiency-based incentives is also relevant, as one of the biggest barriers to
consumers is the upfront price gap between an electric vehicle and an internal combustion engine
alternative (IEA, 2018c). For example, the electric powertrain share in France was 4.3% in 2017
and its “bonus-malus” incentive scheme covered up to EUR 10 000 (USD 11 300) per car, which
can represent up to 30% of the vehicle price (Ademe, 2017). The market share in 2017 for electric
powertrains only reached 1.1% in Australia where there are no federal fuel economy regulations,
though several states provide incentives up to 4% of the vehicle price (Queensland Government,
2018; NSW Government, 2018).
Focus on the 2015-17 period
Fuel economy improvements slowed significantly between 2015 and 2017 in advanced
economies, and accelerated in developing economies (Table 2).
Table 2 • Fuel economy improvements by category, 2005-17 and GFEI 2030 target
2005 2010 2015 2017 2030
Advanced average fuel economy (Lge/100km) 7.4 6.5 5.8 5.8
(Gasoline price ≥ annual improvement rate (% per year) -2.4% -2.5% -0.1%
USD 1/L)
-2.0%
Advanced average fuel economy (Lge/100km) 11.0 9.5 8.6 8.6
(Gasoline price < -2.9% -1.9% -0.4%
USD 1/L) annual improvement rate (% per year)
-2.0% 4.4
average fuel economy (Lge/100km) 8.6 8.5 7.8 7.5
Emerging -0.2% -1.6% -2.3%
annual improvement rate (% per year)
-1.2%
average fuel economy (Lge/100km) 8.8 8.0 7.4 7.2
Global average -2.0% -1.5% -1.4%
annual improvement rate (% per year)
-1.7%
GFEI target 2005 base year -2.8%
Required annual improvement rate
(% per year)
2017 base year -3.7%
Note: To remain consistent with previous GFEI benchmarking publications, this table includes all countries in the European Union,
which leads to a minor difference for the average fuel consumption of Advanced > USD 1/L and the Global average in other analyses
that only include the weighted average of the countries that are presented in each graph. Further details on the updated methodology
and data used for this evaluation are available in Annex A.
Source: IEA analysis based on IHS Markit database (IHS Markit, 2018).
Key point: Annual fuel efficiency gains are slowing in advanced economies and accelerating in emerging
economies. Both rates are below those needed to achieve the GFEI 2030 target.
The slowdown in both advanced economy categories is underpinned by a trend of worsening
average fuel economy in at least 17 countries since 2015. This was most significant in several
European countries, i.e. Germany, France and United Kingdom, as well as in Canada. Japan, where
the average fuel economy level was stable between 2015 and 2017, also contributed to the trendYou can also read


