Brazil: Country of the future or has its time come for natural gas? - Oxford Institute for Energy
←
→
Page content transcription
If your browser does not render page correctly, please read the page content below

June 2014

                                                           Brazil:
            Country of the future or has its time come for natural gas?

                                                                Ieda Gomes

OIES PAPER: NG 88                        OIES Senior Visiting Research Fellow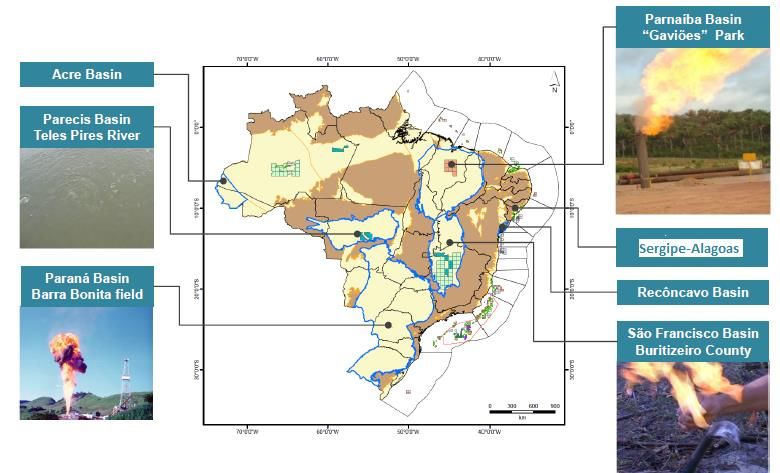
Copyright © 2014
                               Oxford Institute for Energy Studies
                                (Registered Charity, No. 286084)

  This publication may be reproduced in part for educational or non-profit purposes without special
permission from the copyright holder, provided acknowledgment of the source is made. No use of this
  publication may be made for resale or for any other commercial purpose whatsoever without prior
                  permission in writing from the Oxford Institute for Energy Studies.

                                     ISBN 978-1-78467-004-7

                                                 i
Acknowledgements

The author would like to thank all those who provided valuable insights and information during the
preparation of this paper, particularly my colleagues at the Infrastructure Department of the Sao Paulo
Federation of Industries, ABEGAS Executive President Augusto Salomon, Maria D’Assuncao Costa
of the Brazilian Institute of Energy Law and Luiz Minitti Amoroso of Eletricidade do Brasil. The author
also would like to thank members of the Oxford Institute for Energy Studies, especially Howard
Rogers for reviewing and contributing to this paper and Kate Teasdale and Jan Cleave for the final
formatting and editing.

                                                  ii
About the Author

Ieda Gomes is Senior Visiting Research Fellow at the Oxford Institute for Energy Studies. Her areas
of expertise include natural gas and LNG market fundamentals as well as energy pricing, policy and
regulation particularly in developing countries in South Asia, the Middle East, Africa and Latin
America. Ieda’s career in the gas and energy industry spans more than 30 years. She worked for
nearly 14 years at BP plc as Vice President for new ventures and market development on several
international assignments and for 19 years at the largest gas distribution company in Brazil, Comgas.
She has been a key participant and shaper of events in Brazil’s gas industry – from the introduction of
natural gas supplies in Sao Paulo to the negotiating and signing of the domestic and Bolivian gas
supply agreements, the privatization of Comgas and the establishment of the Brazilian Association of
Gas Distribution Companies (ABEGAS). Ieda is based in the UK and sits on the board and advisory
council of various companies and associations. She writes a bimonthly column for Brazil Energia.
Ieda holds a BSc in chemical engineering and an MSc in energy and environmental engineering.

                                                  iii
Preface
I suspect I am amongst a significant majority of people who were not aware, prior to reading this
paper that Brazil’s natural gas industry dates back as far as 1851. In the past few years Brazil, has
received much attention in macro-economic circles as one of the high growth BRICS countries. Its
performance has waned of late, apparently due to lack of internal reforms and infrastructure
bottlenecks, and as this paper demonstrates, these factors certainly ‘read across’ to Brazil’s natural
gas sector.

Initial excitement in the wake of Brazil’s offshore pre-salt hydrocarbon discoveries in 2007 and 2008
raised the prospect of the country becoming an LNG exporter. Following further appraisal and market
developments this prospect has receded and managing the country’s gas balance has been further
complicated by low rainfall (and hence hydro availability) in recent years. For these reasons Brazil
has had to import LNG at Asian-equivalent spot prices to meet requirements which are difficult to
forecast.

In short Brazil is a market which any observer of the natural gas world is required to develop a
working understanding of: in view of its scale, its potential for growth and its impact on the global LNG
market. However, its circumstances and specificities make such an understanding extremely difficult
without expert assistance.

In this regard who better to author this paper than Ieda Gomes, who spent 19 years of her career in
Brazil’s largest gas distribution company and who was a key participant and instigator of sector
development and modernisation? I am extremely grateful to Ieda for her comprehensive, lucid and
perceptive assessment of the evolution, status and future challenges of Brazil’s gas sector. The OIES
Natural Gas Programme is particularly committed to undertaking research which advances
understanding of the important growth markets which impact tomorrow’s gas world, and I am
delighted that her paper admirably fulfils this aim.

Howard Rogers
Oxford
June 2014

                                                   iv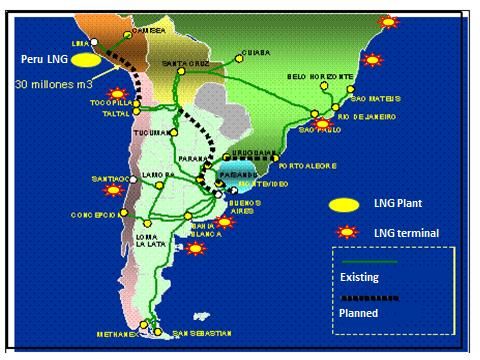
Contents
Acknowledgements ................................................................................................................................. i
About the Author ....................................................................................................................................iii
Preface ................................................................................................................................................. iv
Tables ................................................................................................................................................... vi
Figures .................................................................................................................................................. vi
1. Introduction ...................................................................................................................................... 1
2. Brazil in Context .............................................................................................................................. 2
      2.1 Brazil’s energy matrix is becoming less green .......................................................................... 4
      2.2 The Brazilian gas industry: Genesis and evolution ................................................................... 7
3. Key Industry Players and Regulation .............................................................................................. 9
      3.1 Brazil’s E&P fiscal regime ......................................................................................................... 9
      3.2 Natural gas regulation ............................................................................................................. 11
4. Brazil’s Gas Reserves: Significant Growth .................................................................................... 14
      4.1 Domestic gas production ......................................................................................................... 16
           4.1.1 Brazil’s pre-salt hopes ..................................................................................................... 18
      4.2 Natural gas balance ................................................................................................................ 20
      4.3 Gas demand by sector ............................................................................................................ 20
      4.4 Brazil’s power sector ............................................................................................................... 24
      4.5 Stored energy vs LNG imports ................................................................................................ 28
      4.6 Gas Demand – LDCs franchise areas .................................................................................... 29
           4.6.1 Residential demand ........................................................................................................ 30
           4.6.2 NGVs ............................................................................................................................... 30
           4.6.3 Industrial demand............................................................................................................ 31
      4.7 Natural gas infrastructure: The challenges of a continental country ....................................... 33
           4.7.1 The Bolivia-Brazil pipeline: Game changer ..................................................................... 34
           4.7.2 LNG infrastructure: Another game changer? .................................................................. 35
      4.8 Natural gas prices ................................................................................................................... 36
5. Gas Production Outlook for the Period 2020–30 .......................................................................... 42
      5.1 Natural gas supply-demand outlook ........................................................................................ 44
      5.2 Spot LNG: Expensive alternative for power generation .......................................................... 48
6. Brazil and South America: Markets and Connectivity ................................................................... 51
7. Can Unconventional Gas Play a Role in Brazil? ........................................................................... 56
8. Conclusions and Insights .............................................................................................................. 58
Glossary ............................................................................................................................................... 62
Bibliography ......................................................................................................................................... 64
Company and News Websites ............................................................................................................. 66

                                                                             v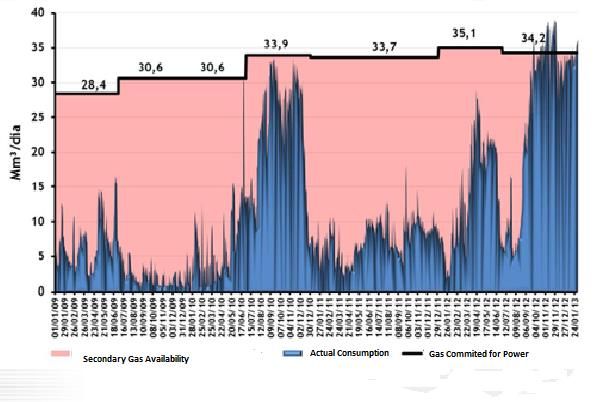
Tables
Table 1: Blocks granted to Petrobras via transfer of rights ................................................................... 10
Table 2: Key players in Brazil's gas value chain ................................................................................... 13
Table 3: Gas production in Brazil by producer, 2013 ............................................................................ 18
Table 4: Stored Energy in Brazil's hydropower reservoirs*................................................................... 26
Table 5: Natural gas regional transportation and LNG infrastructure in Brazil (January 2014) ............ 33
Table 6: Petrobras’ LNG import capacity .............................................................................................. 36
Table 7: Gas-fired power plants owned by Petrobras as of December 2013 ....................................... 38
Table 8: Natural gas and fuel prices to end-users ................................................................................ 40
Table 9: Brazil’s LNG imports and re-exports ....................................................................................... 49
Table 10 : Gas sourcing options: Costs and savings (LNG imports vs domestic gas) ......................... 50
Table 11: LNG import capacity of the Southern Cone, 2016 ................................................................ 55
Table 12: Technically recoverable shale gas resources ....................................................................... 56
Table 13: Breakdown of Brazil’s potential shale gas resources by basin ............................................. 57

Figures
Figure 1: Brazil’s GDP growth, 1998–2013............................................................................................. 3
Figure 2: Composition of Brazil's GDP, 2013 ........................................................................................ 4
Figure 3: Brazil’s primary energy mix, 2012 ............................................................................................ 4
Figure 4: Comparative energy and economic indicators, 2011–12 ........................................................ 6
Figure 5: Brazil's power generation capacity, 2012 ................................................................................ 6
Figure 6: Planned investment in Brazil by sector, 2013–16.................................................................... 7
Figure 7: Evolution of Brazil’s oil & gas legislation ............................................................................... 11
Figure 8: Geographical location of LDCs in Brazil ................................................................................ 13
Figure 9: Evolution of gas reserves in South & Central America ......................................................... 15
Figure 10: Gas reserves of Brazil compared with other selected gas producers, 2012 ....................... 15
Figure 11: Brazil's E&P sedimentary basins ......................................................................................... 16
Figure 12: Breakdown of Brazil's gas production, 2013 ........................................................................ 17
Figure 13: Brazil’s domestic natural gas production vs available supply .............................................. 17
Figure 14: Breakdown of Brazilian gas production by company (MMm 3/d) .......................................... 18
Figure 15: Pre-salt clusters in southeast Brazil..................................................................................... 19
Figure 16: Natural gas balance in Brazil, 2013 ..................................................................................... 20
Figure 17: Brazilian gas consumption by segment, 2011 ..................................................................... 21
Figure 18: Brazilian gas consumption by segment, 2013 ..................................................................... 21
Figure 19: Evolution of Brazilian gas consumption by sector ............................................................... 22
Figure 20: Natural gas consumption in Brazil’s power and industrial sectors ...................................... 22
Figure 21: Supply profile of Brazil’s gas-fired power plants, 2009–2013 .............................................. 23
Figure 22: Brazil’s regional power transmission system ....................................................................... 24
Figure 23: Brazil’s hydropower reservoirs - Historical patterns ............................................................ 25
Figure 24: Storage capacity of Brazil’s hydropower reservoirs by region ............................................. 25
Figure 25: Share of hydro-power in Brazil’s total power generation ..................................................... 26
Figure 26: Brazil’s thermal power generation (gas, oil and coal), 2013 vs 2012 .................................. 27
Figure 27: Outlook for Brazil’s gas-fired power plants .......................................................................... 27
Figure 28: Breakdown of Brazil’s LNG imports by source* ................................................................... 29
Figure 29: LDC gas sales, 2013 vs 2009 .............................................................................................. 29
Figure 30: Breakdown of residential consumers by region ................................................................... 30
Figure 31: Historical growth of NGVs in Brazil ...................................................................................... 31
Figure 32: Breakdown of industrial energy consumption, 2012 ............................................................ 32
Figure 33: Natural gas demand in industry – actual and forecast ....................................................... 32
Figure 34: Evolution of Brazil's gas transportation and distribution infrastructure ................................ 33
Figure 35: Commercial structure of the Bolivia-Brazil pipeline project ................................................. 35

                                                                   vi
Figure 36: Natural gas pricing structure and competencies in Brazil ................................................... 37
Figure 37: Wholesale gas prices in Brazil compared with international prices ..................................... 39
Figure 38: Natural gas prices in Brazil: Wholesale vs end-user (December 2013) .............................. 39
Figure 39: Increasing gap between power and gas (domestic and imported) prices ........................... 40
Figure 40: Breakdown of fuel consumption by Brazilian industrial segment, 2012 vs 2003 ................. 41
Figure 41: Comparison of natural gas end-user prices, Q1/2012 ......................................................... 42
Figure 42: Petrobras investment plan for 2011–15 ($ bn) .................................................................... 42
Figure 43: Petrobras production forecasts, 2014 vs 2011 plan ............................................................ 44
Figure 44: Evolution of domestic and imported gas supply in Brazil .................................................... 45
Figure 45: Sources of natural gas supply in Brazil, 2013 vs 2011 ........................................................ 45
Figure 46: GDP vs gas demand growth in Brazil, 2001–13 .................................................................. 46
Figure 47: Petrobras scenarios for natural gas supply and demand .................................................... 46
Figure 48: Natural gas supply-demand outlook in Brazil, 2013–25 ...................................................... 48
Figure 49: Average DES prices of LNG as of November 2013 ............................................................ 49
Figure 50: Brazil’s LNG import volumes and LNG FOB prices ............................................................ 50
Figure 51: Gas infrastructure and interconnectivity in the Southern Cone ........................................... 52
Figure 52: The Bolivia–Brazil Pipeline .................................................................................................. 53
Figure 53: Bolivia’s gas balance, 2013 ................................................................................................. 53
Figure 54: Argentina’s gas balance, 2013 ............................................................................................ 54
Figure 55: Evolution of natural gas production in Argentina, Brazil and Bolivia ................................... 54
Figure 56: Natural gas imports and exports in the Southern Cone (Bcma), 2013 ................................ 56
Figure 57: Overview of onshore unconventional gas blocks in Brazil‘s November 2013 tender .......... 58
Figure 58: Evolution of Brazil and Argentina’s natural gas imports ...................................................... 59

                                                                    vii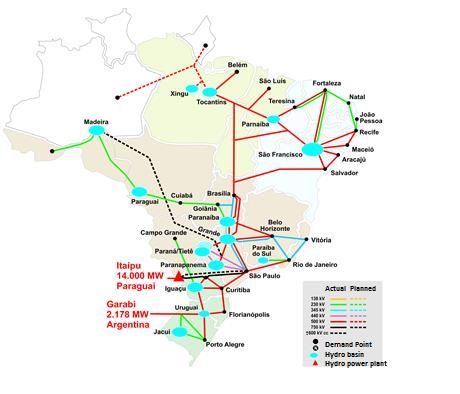
1. Introduction

Natural gas plays a relatively modest role in Brazil’s energy mix, accounting for less than 12% of the
domestic energy supply and 7.2% of the country’s final energy consumption 1 . This is due to the
predominant role of hydroelectricity in Brazil’s power generation, the country’s relatively undeveloped
gas infrastructure, government subsidies for LPG and the monopoly of Petrobras, which contributes to
balancing the supply of competing fuels – natural gas and low-value fuel oil.

In 2013 final gas sales totalled 32.7 Bcma, including 4.6 Bcma consumed by Petrobras refineries and
12 Bcma used in E&P operations and flaring. Brazil is a net gas importer: 12 Bcma was imported from
Bolivia in 2013 and 5.3 Bcma of LNG. The country has three floating LNG import terminals – one
each in the states of Ceara (2.5 Bcma), Rio de Janeiro (7.7 Bcma) and Bahia (5.1 Bcma), all owned
and operated by Petrobras. The dry season in 2012 and 2013 prompted Petrobras to source LNG to
meet the needs of its gas-fired power plants. Petrobras is also currently building its credentials as an
LNG trader; in 2013 it bought nearly 100 cargoes of LNG, around 4.4 mtpa, of which nearly 80
cargoes were imported into Brazil, several traded externally and one half of one cargo re-exported to
Argentina in a gas swap with a Brazilian power plant on the Argentine border. The continuation of the
dry season combined with the need to ‘keep the lights on’ during the World Cup in June/July 2014
and major elections in October will mean that similar amounts of LNG will be imported in 2014.

After nearly 40 years of state monopoly, the government began to gradually liberalise the oil and gas
sector. In 1999 the National Petroleum Agency (ANP) launched the first E&P tenders which received
bids from local and international players. As of 2013, there were more than 70 private companies
active in the upstream sector, either operating alone or partnering with Petrobras; of these, 29 are
already producing small volumes of natural gas, most of which is sold to Petrobras owning to lack of
access to the market. A growing number of private producers are positioning to market their
production independently in the medium term if they are given access to the pipeline infrastructure.

The oil and gas fiscal regime in Brazil is based on 30-year tax-royalty concessions for E&P. However,
in 2008 the government decided that the huge deepwater pre-salt2 resources in the offshore Santos
and Campos basins should be developed under PSCs with Petrobras as the operator with a minimum
participation of 30%. In order to allow the discussion and approval of a separate law for pre-salt
blocks, the government suspended the annual upstream exploration auctions in 2008; these were
resumed only in May 2013. Currently Brazil operates under three separate exploration regimes:
concession contracts for all areas except pre-salt, PSCs for pre-salt blocks and hybrid contracts for a
small number of pre-salt blocks granted exclusively to Petrobras under a rights transfer agreement
with the Brazilian government.

Petrobras’ previous forecasts indicated that the company would be producing 6 million bbl/d of oil and
80 Bcma of domestic gas by 2020, most of which would be associated gas from pre-salt discoveries.
In this scenario Brazil would become a net gas exporter. This prompted Petrobras and its partners to

1
 (EPE , 2013).
2
 Pre-salt refers to the geological strata beneath salt layers. Some petroleum that was formed in the pre-salt layer has not
migrated upwards to the post-salt layers. This is especially common off the coast of West Africa and Southeast Brazil.

                                                               1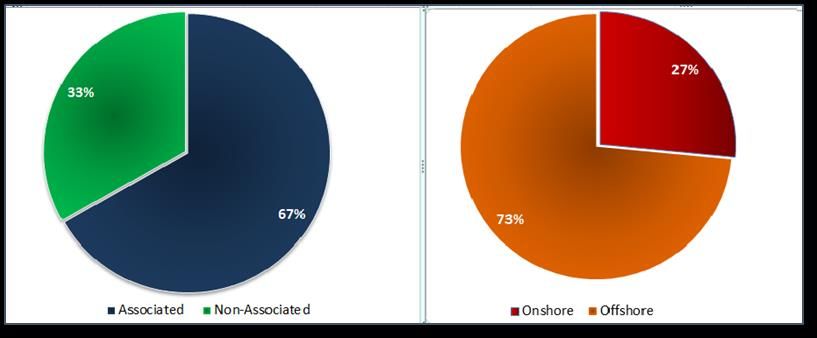
commission a FEED study in 2009 for a 2.7 mtpa FLNG to be built offshore Rio de Janeiro. Petrobras
originally planned to start LNG exports in 2016.

Delays in several upstream projects, uncertainty over gas reinjection volumes and the quality of pre-
salt gas (which is thought to have a high CO2 content), and the increasing demand for gas in power
generation led to major changes in the supply and demand forecasts for natural gas. The FLNG
project was suspended in 2010 and Petrobras increased its LNG import capacity, with three FSRUs
commissioned between 2009 and 2014. Only recently, the industry agreed a forecast for domestic
gas production, which is expected to grow to approximately 50 Bcma by 2020, of which 31.4 Bcma
will be available for sale3. Thus in the long term Brazil will continue to depend on imported gas to
meet domestic demand. If the seasonal scarce rainfall persists in coming years and if there is no
policy change promoting base-load gas generation, Brazil will continue to be a significant player in the
LNG spot market.

In 2013 the Brazilian government resumed E&P leasing auctions. In May of that year, 142 onshore
and offshore blocks were awarded at a concession auction to 39 companies that together paid
signature bonuses in excess of $1.3 bn. In October Brazil completed the first pre-salt bid under the
new PSC regime; only one consortium – formed by Petrobras, Shell, Total and CNPC – took part. In
November the ANP offered another 240 onshore blocks for auction, but the response was limited.

This paper provides an overview of the natural gas market fundamentals in Brazil – supply, demand
and pricing – as well as a supply and demand forecast to 2025. It reviews the outlook for
unconventional and pre-salt gas in Brazil and the current status of and prospects for gas trading
(imports and exports) with Bolivia and Argentina. In addition, it discusses key issues impacting on the
penetration of natural gas in the industrial, power and NGV sectors: price competitiveness, access to
infrastructure and the challenges in increasing the share of gas-fired power generation in the hydro-
dominated power mix, including matching LNG contractual terms with the unpredictable dispatch of
gas-fired power plants.

2. Brazil in Context

Brazil is the fifth-largest country in the world in terms of surface area (8.5 million km 2), larger than
either the continental US or Western Europe. Its population of approximately 201 million4 lives mainly
in coastal areas – vast swaths of the country remain covered by the Amazonian forest. Brazil is a
federation of 27 states, each of which has its own constitution and elected local parliament (State
Assembly). The federal government system is a presidential one in which the elected head of state
has a four-year mandate. The parliament is made up of a lower chamber (Congresso Federal) and an
upper chamber (Senado), which represents the federal states.

Brazil’s economy is the seventh-largest in the world: in 2013 GDP amounted to $2.2 trillion5. Owing to
several setbacks, the economy is predicted to grow by only 1.67% in 2014, significantly below the
record 7.5% growth in 2010.

3
  The balance is to be used for oil field reinjection and production facility fuel gas.
4
  http://g1.globo.com/brasil/noticia/2013/08/populacao-brasileira-ultrapassa-marca-de-200-milhoes-diz-ibge.html
5
   IMF:
http://www.imf.org/external/pubs/ft/weo/2014/01/weodata/weorept.aspx?pr.x=55&pr.y=14&sy=2012&ey=2019&scsm=1&ssd=1
&sort=country&ds=.&br=1&c=223&s=NGDP_R%2CNGDPD&grp=0&a=

                                                        2
Brazil’s economy is quite diversified: the services sector accounts for 59% of GDP, followed by
industry (21%) and agriculture (15%). Similarly the industrial sector is very diverse, catering for the
domestic and export markets and encompassing segments ranging from aerospace to automakers,
consumer goods, ship-building, chemicals, aluminium, ceramics, glass and textiles. However,
Brazilian industry has been struggling to compete with cheaper Chinese manufactured products while
at the same time being faced with a strong domestic currency (Brazilian Real) and high energy prices
and taxes.
Brazil is an important exporter of agricultural products, in particular soya beans, sugar cane, maize
and wheat. It is also one of the world’s leading producers of iron ore, manganese, bauxite, nickel and
limestone.
Figure 1: Brazil’s GDP growth, 1998–2013
Source: http://g1.globo.com/economia/noticia/2014/02/economia-brasileira-avancou-23-em-2013-diz-ibge.html
The city of Sao Paulo is the largest financial market in South America and one of the largest in the
world. However, there are 15 other cities in Brazil with more than 1 million inhabitants 6.
Following are other important factoids about Brazil:
It is the world’s fourth-largest market for bulk and passengers transportation vehicles and the
third-largest for computers.
It has the largest private helicopter fleet and the second-largest executive jet fleet in the world.
In 2010 Brazilian consumers purchased 12 million TV sets.
In 2011 there were 215 million mobile phones in operation in Brazil, making it the fourth-
largest mobile phone market in the world.
Brazil is the 11th-largest oil producer in the world and the second-largest producer of
hydroelectricity.
6
http://exame.abril.com.br/brasil/noticias/as-300-cidades-mais-populosas-do-brasil-em-2013
3Figure 2: Composition of Brazil's GDP, 2013
Source: http://g1.globo.com/economia/noticia/2014/02/economia-brasileira-avancou-23-em-2013-diz-ibge.html
Brazil is a member of the Mercosur free trade area, which comprises Argentina, Uruguay, Chile,
Paraguay and Venezuela as well as Bolivia as an acceding member. The purpose of Mercosur is to
promote free trade and the free movement of goods, people and currencies.
2.1 Brazil’s energy matrix is becoming less green
Brazil’s energy policymakers are very proud of the country’s ‘green’ energy credentials: renewable
energy plays a large role if the share of hydropower and biomass7 is taken into account. Wind power
is not yet significant, despite an increase in wind projects being built in the northeast region over the
past 10 years. However, the share of renewable energy in the overall energy mix decreased from
44% in 2011 to 42.4% in 2012 owing to the decrease in the consumption of ethanol and the increase
in the consumption of petrol, diesel and natural gas 8. The share of renewable energy, particularly
hydropower and ethanol, is expected to decrease further but still be significantly larger than the world
average of 13.2%9. In 2012 the primary energy offer was 283 MTOE.
Figure 3: Brazil’s primary energy mix, 2012
Source: (EPE , 2013)
7
Figures include sugarcane ethanol.
8
(EPE , 2013).
9
http://www.iea.org/aboutus/faqs/renewableenergy/
4Natural gas accounts for 12% of Brazil’s primary energy consumption, while oil accounts for 39%. Oil
products are used primarily in the transportation and residential sectors. Despite the significant role of
anhydrous ethanol, which is used in a 22% mixture with petrol and as a popular standalone fuel in
flexi cars10, the Brazilian fleet is highly dependent on diesel and petrol, while bottled LPG is the main
fuel used for cooking.
In order to shield the country from the 2008–09 world economic crisis, the Brazilian government
embarked on a policy of fuelling domestic demand by facilitating credit to families, increasing the
distribution of cash grants to the poor and reducing taxes and customs duties for consumer-oriented
industries such as automakers and white-good manufacturers.
From 2001 to 2012 Brazil’s vehicle fleet jumped from 34.9 million to 76.1 million – an increase of
138%, compared with population growth of 11.8% in the same period 11. At the same time, there was a
sharp increase in the purchase of home appliances and equipment such as computers, mobile
phones, refrigerators, TVs and air-conditioning sets.
To rein in demand-driven inflation, the government froze Petrobras’ ex-refinery petrol and diesel
prices and ended a compensation mechanism (CIDE) previously used to neutralising currency and
price fluctuations. The freeze on petrol prices impacted negatively on the ethanol industry because
ethanol prices are pegged to petrol prices and producers could no longer compete with the price of
petrol ex pump. As regards the power sector, the Ministry of the Environment established new rules
for permitting power projects that virtually prevent hydroelectric power plants with reservoirs from
being built. Previously, such plants were built with firm energy equivalent to 55% of their total
capacity. Nowadays hydro power plants are only built as “run-of-the-river”. The new environmental
rules contribute to reducing the availability of hydropower during the dry season.
Overall, the consumption of energy increased 3.4% in 2011–12, while losses in transformation rose
8% owing to the increase in thermal power generation.
Despite very modest GDP growth of 0.9% in the period 2011–12, the government policy of fuelling
domestic demand resulted in disproportionately high growth in the consumption of electricity and
liquid fuels, as Figure 4 below shows. The consumption of petrol alone increased 17% in 2011–12.
10
A ‘flexi-car’ can burn any mixture of hydrated ethanol and petrol. This development has slowed down the conversion of cars
to natural gas in Brazil.
11
(Instituto Nacional de Ciencia e Tecnologia, 2013)
5Figure 4: Comparative energy and economic indicators, 2011–12
Source: (EPE , 2013)
Brazil’s total installed capacity in 2012 was close to 121 GW, compared with 89 GW in the UK12.
Hydropower plants account for approximately 84 GW (70%) and thermal plants (gas, oil and coal) for
32.5 GW. The share of hydro in the power generation mix decreased from 464.2 TWh in 2011 to
455.6 TWh in 2012 owing to the unusually long dry season and the reduction in storage capacity.
Figure 5: Brazil's power generation capacity, 2012
Source: (EPE , 2013)
The power sector in Brazil is reeling from the damaging impact of several developments: the
recurrence of abnormally dry seasons, which has resulted in the reduced availability of cheaper
hydropower; losses of profitability for power generation and distribution companies owing to higher
generation costs and the government’s mandatory reduction in electricity tariffs in the period before
the 2012 municipal elections; and mismatch between demand and contracted power, causing a ‘hole’
12
https://www.gov.uk/government/uploads/system/uploads/attachment_data/file/279546/DUKES_2013_Chapter_5.pdf
6of 3000 MW that was covered by distribution companies through purchases on the spot market.
According to power sector specialists, in 2015 Brazilian consumers will have to pay an additional
$18–23 bn in order to contain the haemorrhage in the sector13.
Petrobras – the main E&P investor in Brazil – is also the largest gas-to-power generator. Be that as it
may, the oil and gas sector is expected to play a big role in Brazil’s economy in the short and long
term. Planned investment in oil and gas for the period 2013–16 will total approximately $200 bn,
exceeding combined investment in the other industrial sectors. The Ministry of Energy’s 10-year Plan
for 2012–22 estimates that $550 bn will be needed to increase the availability of electricity, oil and gas
and biofuels. According to the plan, the power sector will require investment totalling $124 million to
increase capacity from almost 121 GW currently to 183 GW in 202214.
Figure 6: Planned investment in Brazil by sector, 2013–16
Source: (EPE , 2013)
2.2 The Brazilian gas industry: Genesis and evolution
The Brazilian gas industry was founded in 1851, when the Baron of Maua, a Brazilian entrepreneur,
signed a contract to provide street lighting in the city of Rio de Janeiro15. In 1854 the Rio de Janeiro
Gas Company – later known as CEG (Companhia Estadual de Gas) – was incorporated. This was
followed by the incorporation of the Sao Paulo Gas Company (Comgas) in 1872 and several city gas
distribution companies in other Brazilian cities. Medium calorific gas was produced through the
distillation of coal in retorts. The advent of electricity in the early 1900s contributed to the collapse of
all city gas companies except for Comgas and CEG, both of which continued to produce medium
calorific gas from coal for cooking purposes until the 1960s, when they switched to naphtha. Until the
late 1980s, city gas in Brazil was a mix of methane, hydrogen and carbon dioxide distributed to a
small number of households and industrial consumers. CEG and Comgas were state-owned
companies that had very limited market reach owing to the lack of gas supplies and funding.
In 1953 the nationalist government of President Getulio Vargas established a state-owned oil
company, Petróleo Brasileiro S.A. (Petrobras), following a country-wide campaign under the motto ‘O
13
http://noticias.r7.com/economia/conta-criada-no-setor-de-energia-pode-ir-a-r-52-bilhoes-10042014-1
14
(EPE, 2013).
15
https://www.gasnaturalfenosa.com.br/br/conheca-nos/quem+somos/historia/1297092019569/historia+rio.html
7petróleo é nosso’16. The monopoly of Petrobras in the oil and gas sector, except in gas distribution
and importation, was subsequently enshrined in the Brazilian Constitution. Petrobras started to
prospect for and find oil in onshore locations in northeast and southeast Brazil and to market
associated natural gas to industrial consumers near its oil fields.
From 1960 to 1984 two gas distribution regimes existed in Brazil: city gas17 distribution in the cities of
Sao Paulo and Rio de Janeiro and natural gas industrial distribution by Petrobras in eight states in the
north-eastern part of the country and in the interior of the state of Rio de Janeiro. Following the
discovery of large offshore oil fields in the Campos Basin (Rio de Janeiro), which provided large
volumes of associated gas, Comgas and CEG entered into negotiations with Petrobras and signed
gas supply and purchase agreements allowing them to expand the distribution network. The
governments of several states particularly those served by Petrobras’ gas distribution system,
established their own city gas distribution companies (LDCs) in a bid to exert more control over the
expansion of the natural gas grid. At the same time, the federal government wanted to provide
incentives for private investment in oil and gas E&P because of Petrobras’ limited investment
capability and Brazil’s continued dependence on imported crude.
Initially, Petrobras was very reluctant to supply gas to the LDCs as it competed with low-value fuel oil
produced at Petrobras’ 11 refineries. In 1995, following a campaign by the LDCs to be allowed to
import gas from Bolivia, a constitutional amendment ended Petrobras’ monopoly by allowing private
and state-controlled companies to explore for, produce, transport, and import and distribute petroleum
and natural gas. The Petroleum Law (9478) of August 6, 1997 created a regulatory body, the ANP,
and established a regulatory framework for the petroleum sector, which was later expanded to
biofuels. Meanwhile, the distribution of natural gas remained within the competence of the federal
states.
Even after the formal end of its monopoly, Petrobras continued to play a huge role in controlling
Brazil’s gas industry and infrastructure and to dictate both the pace of infrastructure expansion and
gas pricing. This prompted another campaign to reduce Petrobras’ grip on the gas sector, which
resulted in the enactment of the Gas Law (11909) of March 4, 2009, which is yet to be fully
implemented.
During the period 1997–99 the states of Sao Paulo and Rio de Janeiro privatised their gas distribution
companies, while other states decided in favour of a tripartite ownership model in which the state
government, Petrobras and private investors were shareholders. All states granted a 30–50 year
exclusive geographical franchise to gas distribution concessionaires. The states of Sao Paulo,
Espirito Santo and Rio de Janeiro regulation allow large consumers to become so-called free
consumers after the 11th anniversary of the concession contract, but even free consumers are
obliged to pay a distribution fee regulated by the state’s regulatory agency. Since Petrobras remains
the only supplier of gas and since the same distribution fee must be paid by free and captive
consumers, there is no incentive to become a free consumer.
Despite all the setbacks and the lack of a clear government policy to provide incentives for the
production and utilisation of natural gas, the Brazilian gas industry has witnessed some progress,
particularly between 1999 and 2005 following the commissioning of the Bolivia-Brazil gas pipeline.
16
‘The petroleum belongs to us’.
17
Medium calorific value city gas was manufactured from naphtha.
8Gas consumption increased from 1 Bcma in 1980 to approximately 33 Bcma in 2013 while the
number of consumers rose from under 500,000 in 1999 to 2.4 million in early 201418.
3. Key Industry Players and Regulation
Following the enactment of the 1997 Petroleum Law and the creation of the ANP, Brazil initially
granted a transition period for the exploration blocks held by Petrobras and then developed the rules
for holding E&P auctions on a yearly basis. The first pre-salt blocks were auctioned in the second
exploration bidding round, which took place in 2000, when there was still little knowledge of the
country’s resource potential. The auctions attracted a significant number of domestic and international
oil companies. Currently, 77 companies – both domestic and international – hold 329 exploration
concessions.
The sedimentary basins in Brazil cover an area of 7.5 million km 2. Little is known about the resource
potential of several offshore and onshore basins, particularly in the north of the country. Out of Brazil’s
27 federal states, only 10 are gas-producing, with 66% of overall production concentrated in three
basins – Campos, Urucu (Amazonas state) and Espirito Santo.
3.1 Brazil’s E&P fiscal regime
The E&P fiscal regime in Brazil follows three models:
Royalty-tax concessions, for all exploration contracts signed before 2012 and new
exploration blocks that are not part of the pre-salt.
Hybrid (Transfer of rights), under which the federal government granted exclusive rights to
Petrobras to explore a number of pre-salt blocks.
In 2010 the federal government granted Petrobras exclusive rights to produce up to 5 bn BOE
over 40 years in seven pre-salt areas and prospects, in six definitive blocks and in one
contingent block]19. Petrobras paid BRL74.8 bn ($42.5 bn) to the federal government for the
transfer of rights, implying an average price of $8.51/BOE.
Petrobras and the ANP hired, respectively, DeGolyer and MacNaughton and Gaffney, Cline &
Associates to certify 2C contingent (best estimate) 20 and prospective resources in the
assigned discoveries/prospects and to conduct a discounted cash flow analysis of the net
present value of hydrocarbons in situ. Gaffney, Cline estimated 2C contingent resources and
best-estimate prospective resources of 7.05 bn BOE, with an NPV ranging from $6.39/BOE to
$11.76/BOE at a 10% discount rate 21 . After negotiations with the government, Petrobras
agreed to pay $42.5 bn for the rights. Petrobras then issued shares to pay for the rights and
to finance part of its ambitious investment programme; a 2010 share issue raised $71.6 bn –
the largest-ever sum to be raised by this means. In practical terms, the share issue increased
18
(ABEGAS, 2014) (BP , 2013).
19
Tupi Sul, Florim, Tupi Nordeste, Peroba, Guará and Franco e Iara are the definitive blocks and Peroba the contingent block.
20
‘Those quantities of petroleum estimated, as of a given date, to be potentially recoverable from known accumulations by
application of development projects, but which are not currently considered to be commercially recoverable due to one or more
contingencies.’ (Gaffney, Cline & Associates, 2010).
21
(Gaffney, Cline & Associates, 2010).
9the Union’s shareholding in Petrobras from 39.8% to 48.3%, diluted minority shareholdings
and contributed to creating a surplus on the 2010 primary account.
Production Sharing Contracts (PSC), for all pre-salt blocks granted after 2010 and for new
‘strategic areas’.
According to the new legislation approved by the Congress in 2010 Petrobras is the sole
operator with a minimum 30% interest in all PSC blocks. The first pre-salt block (Libra) in the
new PSC regimen was auctioned in October 2013, although there was only one bidder – the
consortium formed by Petrobras, Shell, Total and CNPC. The signature bonus was $6.8 bn
and the bidder offered the minimum profit oil percentage of 41.65%. The ANP expects the
Libra block to contain 8–12 bn BOE.
Table 1: Blocks granted to Petrobras via transfer of rights
Block Volume (MMBOE) Price ($/BOE)
Florim 467 9.01
Franco 3058 9.04
South Guara 319 7.94
Entorno de Yara 600 5.82
South Tupi 128 7.82
Northeast Tupi 428 8.54
Peroba tbd 8.53
Total 5000 8.51
Source: (Rocha, 2011)
In Brazil the exploration bidding round consists of a pre-qualification stage, in which investors may
qualify as operator type A (any area, including deepwater), B (shallow water and onshore), C
(onshore) or non-operator, and the depositing of a bank or parent company guarantee. On the day of
bidding, which is a public event, bidders are asked to make bids for the following:
Bidding bonus (which should be equal to or exceed a pre-determined value);
Percentage of local content (percentage for the exploration stage differs from that for the
development stage).
The winner is immediately awarded the block(s) and must sign a concession contract within one
month of the bidding date. There is no restriction on the number of bids per bidder and companies are
allowed to form consortia, provided they meet the pre-qualification criteria. As regards bids for pre-salt
blocks, the government fixes the bidding bonus and the percentages of local content and cost oil. The
bidder is asked to make a bid for the percentage of profit oil to be transferred to the federal
government.
In 2008, following the pre-salt discoveries, the government suspended the annual auctions and sent a
bill to the Congress providing for a new fiscal regime for pre-salt and strategic blocks. At that time, it
was estimated that the pre-salt blocks could hold reserves of 30–50 bn BOE and that the exploration
risk was very low, which justified increased control and a larger government take. Law No 12.351 of
December 22, 2010 introduced the pre-salt regime, created a new state company to manage the
government’s interests in PSCs – Pre-Sal Brasil S. A. – and granted additional rights to Petrobras.
Also, a new law on royalties was enacted in 2012 under which all Brazilian states receive royalty
revenues – the previous relevant legislation had benefited only the producing states – and pre-salt
royalties can be used for education and health. In 2013 the government launched new bidding
rounds. Hence, all in all, the review of legislation on pre-salt and strategic blocks resulted in a five-
year hiatus that has unpredictable consequences for future supplies of oil and gas in Brazil.
10To summarise, the main changes introduced by the new petroleum legislation are:
Pre-salt and strategic blocks are to be allocated under a production-sharing regime. All other
blocks are to be allocated through concession licences. Pre-salt blocks allocated before the
enactment of the new legislation will continue to be explored under concession licences.
The government has created a new state-owned company – Pre-Sal Brasil S.A. – to
represent the government’s interests in pre-salt contracts. This company will have majority
and veto rights in all pre-salt joint operating agreements
Petrobras will be the sole operator of all pre-salt blocks with a minimum stake of 30%.
The Congress has approved the creation of a special fund to invest pre-salt revenues in
health and education.
Producing and non-producing states will share equally the royalty proceedings which in the
past were allocate only to producing states. Although there is no fixed percentage of local
content established by law, the ANP has maintained a high threshold for bids, despite the
conclusions of a study from ONIP 22 showing that local providers usually supply goods at
higher cost than international suppliers. .
Figure 7: Evolution of Brazil’s oil & gas legislation
Source: Author
3.2 Natural gas regulation
In Brazil there are two distinct jurisdictions for the regulation of the natural gas industry. The federal
government sets all policy and regulation on the upstream and midstream, while the state
governments supervise distribution activities and approve end-user prices.
22
(Oportunidades, desafios e competitividade para a rede de fornecedores de O&G no Brasil, 2013).
11Federal level
The Ministry of Mines and Energy (MME) sets sector policies, executes high-level planning,
authorises the import and export of natural gas; the MME is also in charge of putting in place
a 10-year plan for the expansion of the gas transportation system;
The National Council of Energy Policy (CNPE) approves the exploration blocks to be
auctioned by the ANP (see immediately below) and sets guidelines for the development of
Brazil’s energy resources;
The National Petroleum Agency (ANP) organises E&P auctions and gas transportation bids,
monitors the execution of E&P activities, authorizes the construction of LNG import terminals
and mediates conflicts involving producers, transporters, distributers and users;
The Energy Planning Company (EPE) is responsible for forecasting long term energy demand
as well and organise auctions for three and five year power capacity and availability,
respectively A-3 and A-5 auctions.
States level
The regulatory agencies of the states approve distribution margins and tariffs and monitor
LDC concession contracts.
Apart from the restrictions governing the participation on the pre-salt blocks, any company established
under Brazilian law can participate in any activity in the gas value chain. E&P concessionaires are
allowed to dispose freely of their share of natural gas and oil.
According to the 2009 Gas Law, two regimes exist for the construction and operation of gas pipelines:
international pipelines are authorised by the MME, whereas domestic pipelines fall under a regime
whereby concessions are granted to the bidder offering the lowest tariffs. The owner of pipelines built
or authorised before 2009 are granted 10-years’ exclusivity. There is no open access to LNG
terminals.
Gas distribution concessions are granted by individual states. Most states have established energy
regulatory agencies to ensure quality of service and approve the margins and tariffs of
concessionaires. The states are not obliged to follow a uniform federal framework, which causes
some discomfort for large industrial end-users that have premises in more than one state since they
have to abide by more than one set of rules and price levels.
In the downstream segment, there are 27 gas distribution companies (LDCs). Most states have just
one LDC, while Sao Paulo has three and Rio de Janeiro two. According to the Brazilian Constitution,
the states either operate gas distribution services directly or grant concessions to third parties. As
noted above, gas distribution concessions award exclusive geographical franchise rights for 30–50
years. End-user prices are either bundled or cost of service, depending on the legislation of the
relevant state, and readjusted on a yearly basis.
12Table 2: Key players in Brazil's gas value chain23
Source: Author’s research
Figure 8: Geographical location of LDCs in Brazil
Source: http://www.abegas.org.br/Site/?page_id=839
23
PEMAT: MME 10-year Plan for the expansion of natural gas pipelines.
134. Brazil’s Gas Reserves: Significant Growth
Brazil’s gas reserves, though dwarfed by Venezuela’s, have increased 25% over the last five years
thanks to Petrobras and private companies investing in oil and gas exploration and development. In
fact, Brazil, Peru, Venezuela and, to a certain extent, Colombia are the only countries in South
America to have seen growth in gas reserves, while traditional exporters such as Bolivia and
Argentina are experiencing a dramatic change in fortunes. Bolivia’s takeover of foreign oil companies’
assets and the nationalisation of gas reserves in 2006 have resulted in a sharp reduction in E&P
investment. As a consequence, Bolivia’s gas reserves more than halved over the last five years –
from 26.13 Tcf in 2007 to just 11.2 Tcf in 201224. According to the Oil & Gas Journal, its proven
reserves are only 9.9 Tcf, whereas the US Energy Information Agency (EIA) 25 estimates that its
technically recoverable reserves are 48 Tcf. Argentina is suffering from the same problem: its gas
reserves fell from 15.5 Tcf in 2007 to 11.3 Tcf in 2012.
The Global Petroleum Survey 2013 of the Fraser Institute polled the views of 864 respondents
representing 762 companies in the oil and gas sector 26. The survey ranked Bolivia and Salta Province
in Argentina among the 10 least attractive regions for investment out of 147 global jurisdictions. The
ranking is based on five commercial environment index factors: fiscal terms, taxation in general, trade
barriers, quality of infrastructure, and labour availability and skills 27.
The state-owned Yacimientos Petroliferos Fiscales Bolivianos (YPFB) is trying to develop E&P
partnerships with foreign companies in a bid to double natural gas production by 2015. According to
the EIA, YPFB aims to negotiate and approve 18 exploration contracts and drill 14 wells by 2015.
Following the development of a new service contract model, a few deals were inked in 2013 with
international companies, including the south-eastern Azero block (Gazprom/Total/Tecpetrol) and the
Cedro and Huacareta areas (Petrobras and BG Group respectively).
24
(BP, 2008) (BP , 2013).
25
(US Energy Information Administration, 2012).
26
(Fraser Institute, 2013).
27
(Wilson, 2013).
14Figure 9: Evolution of gas reserves in South & Central America
Sources: (BP , 2013) (BP, 2008)
At 16 Tcf, Brazil’s gas reserves are larger than those of Trinidad & Tobago, twice the size of the UK’s
and half of Azerbaijan’s. Although the gas R/P in 2012 was 26 years, Brazil’s domestic gas production
is insufficient to meet its gas demand.
Figure 10: Gas reserves of Brazil compared with other selected gas producers, 2012
Source: (BP , 2013)
154.1 Domestic gas production
As of January 2014, Brazil had 329 blocks in the exploration phase, 72 fields in the development
phase and 437 concessions in the production phase –– operated by 23 companies. There were 8,980
producing wells, of which 8213 were onshore and 767 offshore28.
Figure 11: Brazil's E&P sedimentary basins
Source: Petrobras (http://www.fool.com/investing/international/2014/05/17/will-petrobras-production-grow.aspx)
In 2013 Brazil produced on average 77 MMm3d of natural gas (27.8 Bcma). Approximately 67% is
associated gas, while 73% of is produced offshore. In January 2014 Brazil’s gas production reached
80.4 MMm3/d (29.3 Bcma); the field with the largest production was the pre-salt oil field Lula, which
produced 2.4 Bcma, of which 0.4 Bcma was flared. According to Petrobras, in March 2014 Brazil’s
domestic production reached a record 100 MMm3/d (35 Bcma)29.
28
http://www.anp.gov.br/?pg=70027&m=&t1=&t2=&t3=&t4=&ar=&ps=&cachebust=1395447983965
29
Presentation by Petrobras at the CWC Rio Gas Forum, April 10, 2014.
16Figure 12: Breakdown of Brazil's gas production, 2013
Source: (MME, 2014)
In 2013 only 57% of Brazil’s domestic gas production reached the market. Approximately 12 Bcma
are used by Petrobras in E&P operations and at its gas processing units or re-injected and flared.
Petrobras also uses a large share of the marketed production at its refineries and fertilizer plants (4.6
Bcma).
Figure 13: Brazil’s domestic natural gas production vs available supply
Sources: (ANP, 2008) (MME, 2014)
Gas production in Brazil is dominated by Petrobras, which accounts for 83.4% of the country’s total
output. There are currently nine private companies producing gas, most of which in partnership with
Petrobras. Only one consortium sells gas independently; the others sell to Petrobras at the wellhead.
17Figure 14: Breakdown of Brazilian gas production by company (MMm3/d)
Source: (MME, 2014)
Several major IOCs are currently active in Brazil, most of them in the exploration or development
phase: BG, BP, Shell, Exxon, Chevron, Total, GDF Suez, GALP, Repsol and Statoil.
Table 3 below shows the companies that are producing gas in Brazil alongside Petrobras, albeit in
significantly smaller volumes than the Brazilian NOC. Six of the smaller producers are independent
Brazilian companies.
Table 3: Gas production in Brazil by producer, 2013
Producer Gas Producer (Mm3/d) Type of company
Parnaiba Gas 3.92 Brazilian independent
Queiroz Galvao 2.79 Brazilian independent
BG Brasil 1.77 IOC
Petra Parnaiba 1.68 Brazilian independent
Brasoil Manati 0.62 Brazilian independent
Petrogal Brasil 0.62 IOC
Rio das Contas 0.62 Brazilian independent
EP Energy 0.59 Brazilian independent
Repsol Sinopec 0.35 IOC
Petrobras 65.1 Brazilian NOC
Total 78.06 IOC
Source: (MME, 2014)
4.1.1 Brazil’s pre-salt hopes
Brazil’s pre-salt blocks consist of several clusters on the continental shelves offshore the Campos and
Santos basins, in south-eastern Brazil. The hydrocarbon formations are buried under a 2000m layer
of salt at a water depth of 2000–3000m. It is estimated that pre-salt covers an area of 122,000km 2, of
which 41,000km2 have already been allocated for exploration/development. Brazil’s pre-salt oil is of
good quality (28–310 API) and has a gas-to-oil ratio of 250–300m3 of gas/m3 oil and CO2 content of 8–
15%30. The Santos Basin Pre-Salt Cluster comprises six blocks operated by Petrobras with various
30
(Pre-salt Production development in Brazil, 2011).
18You can also read