European farmers' intentions to invest in 2014-2020: survey results - Core
←
→
Page content transcription
If your browser does not render page correctly, please read the page content below
LF-NA-26672-EN-N
                                                                                                                  JRC SCIENCE AND POLICY REPORTS

                                                                                                                  European farmers’ intentions to
                                                                                                                  invest in 2014-2020: survey results

                                            European farmers’ intentions to invest in 2014-2020: survey results
                                                                                                                                        Marianne Lefebvre,

                                                                                                                                        Kim De Cuyper, Ellen Loix,

                                                                                                                                        Davide Viaggi, Sergio Gomez-y-Paloma

JRC Mission                                                                                                                             2014

As the Commission’s
in-house science service,
the Joint Research Centre’s
mission is to provide EU
policies with independent,
evidence-based scientific
and technical support
throughout the whole
policy cycle.

Working in close
cooperation with policy
Directorates-General,
the JRC addresses key
societal challenges while
stimulating innovation
through developing
new methods, tools
and standards, and sharing
its know-how with
the Member States,
the scientific community
and international partners.

Serving society
Stimulating innovation
Supporting legislation

doi:10.2791/82963
ISBN 978-92-79-38475-2
                                                                                                                                                                          Report EUR 26672 EN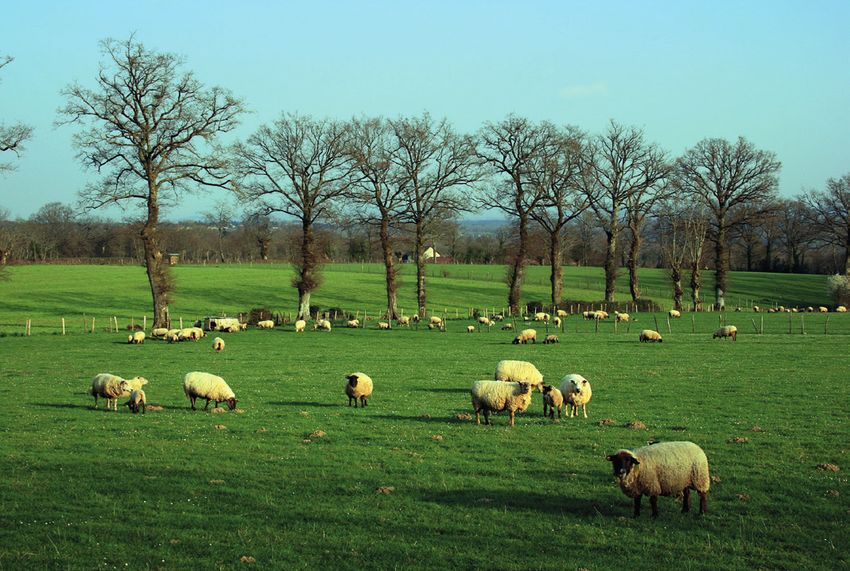
European Commission Europe Direct is a service to help you find answers to your questions about the European Union
Joint Research Centre Freephone number (*): 00 800 6 7 8 9 10 11
Institute for Prospective Technological Studies (*) Certain mobile telephone operators do not allow access to 00 800 numbers or these calls may be billed.
Contact information A great deal of additional information on the European Union is available on the Internet.
Address: Edificio Expo. c/ Inca Garcilaso, 3. E-41092 Seville (Spain) It can be accessed through the Europa server http://europa.eu.
E-mail: jrc-ipts-secretariat@ec.europa.eu
Tel.: +34 954488318 How to obtain EU publications
Fax: +34 954488300
Our priced publications are available from EU Bookshop (http://bookshop.europa.eu),
https://ec.europa.eu/jrc where you can place an order with the sales agent of your choice.
https://ec.europa.eu/jrc/en/institutes/ipts
The Publications Office has a worldwide network of sales agents.
Legal Notice You can obtain their contact details by sending a fax to (352) 29 29-42758.
This publication is a Science and Policy Report by the Joint Research Centre, the European Commission’s in-house science service.
It aims to provide evidence-based scientific support to the European policy-making process. The scientific output expressed
does not imply a policy position of the European Commission.Neither the European Commission nor any person
acting on behalf of the Commission is responsible for the use which might be made of this publication.
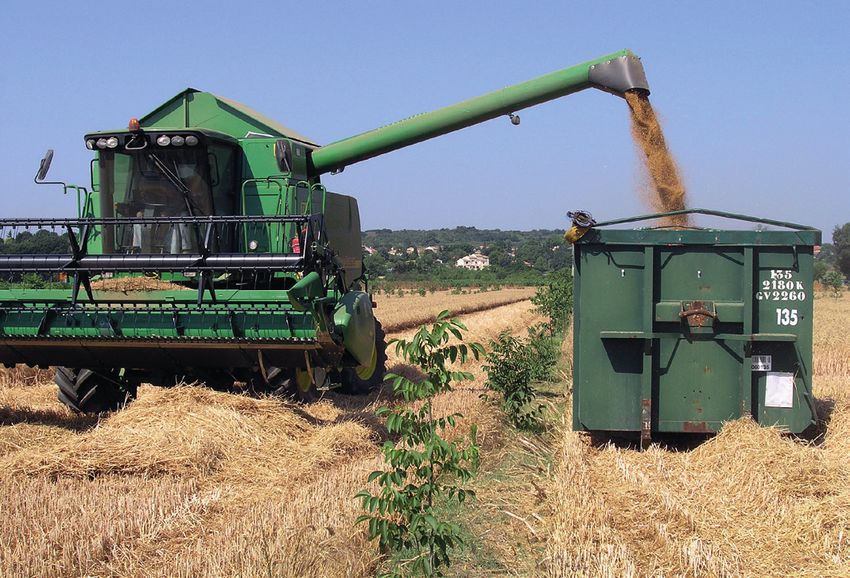
Pictures in the cover page represent investments in land (top left), machinery and equipment (top right), building (bottom left)
and training (bottom right).
Top: © agroof
Bottom: © European Network for Rural Development 2012
JRC90441
EUR 26672 EN
ISBN 978-92-79-38475-2 (PDF)
ISSN 1831-9424 (online)
doi:10.2791/82963
Luxembourg: Publications Office of the European Union, 2014
© European Union, 2014
Reproduction is authorised provided the source is acknowledged.
European Commission
EUR 26672 EN – Joint Research Centre – Institute for Prospective Technological Studies
Title: European farmers’ intentions to invest in 2014-2020: survey results
Authors: Marianne Lefebvre, Kim De Cuyper, Ellen Loix, Davide Viaggi, Sergio Gomez-y-Paloma
Luxembourg: Publications Office of the European Union
Abstract 2014 – 96 pp. – 21.0 x 29.7 cm
The present study aims to analyse farmers’ intentions to invest in the period 2014-2020, focussing on investments in land, EUR – Scientific and Technical Research series –ISSN 1831-9424 (online)
buildings, machinery and equipment, training, and quotas and production rights. It provides up-to-date information on EU farm
investment patterns that is not otherwise available in traditional agricultural statistics (such as Farm Accountancy Data Network ISBN 978-92-79-38475-2 (PDF)
or the Eurostat Farm Structure Survey). Use of the data in this study contributes to the general understanding of the determinants
of investment decisions and farmers’ reaction to EU Agricultural policy. doi:10.2791/82963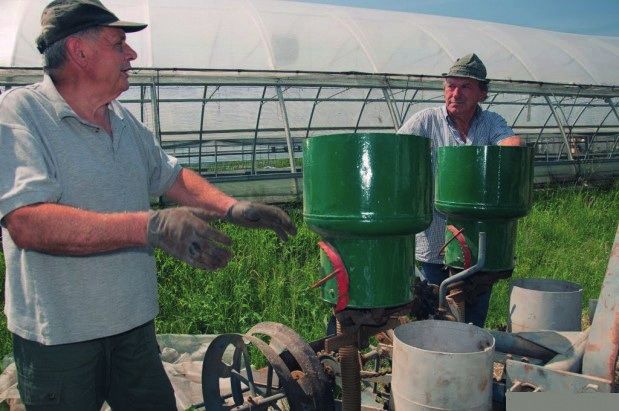
JRC SCIENTIFIC
AND POLICY REPORTS
       European farmers’
       intentions to invest in
       2014-2020: survey results
       Marianne Lefebvre1, Kim De Cuyper2, Ellen Loix2,
       Davide Viaggi3, Sergio Gomez-y-Paloma1

       1 European Commission, Joint Research Centre, IPTS, Seville, Spain
       2 GfK, Arnould Nobelstraat 42, 3000 Leuven, Belgium
       3 Department of Agricultural Sciences, University of Bologna, Italy

       2014

       Joint Research Centre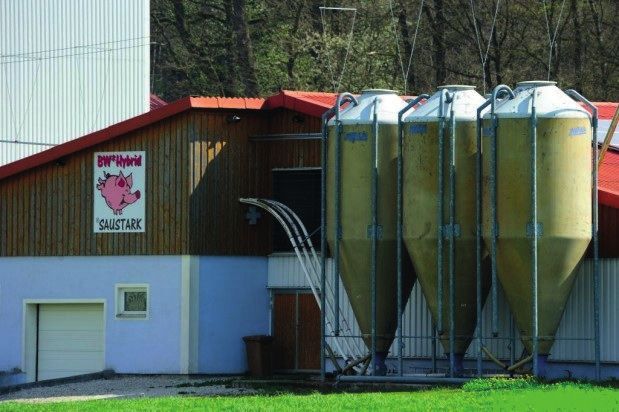
Acknowledgements

Acknowledgements
The survey on which this report is based was funded by the     Delincé for his comments on sampling, and Mercedes Obra
IPTS, an institute of DG-JRC of the European Commission,       and Malgorzata Palczewska (GfK) for their participation in
in the context of the project ‘Survey and Data analysis        the questionnaire design, as well as colleagues from DG
on EU farmers’ expected investment decisions and their         Agriculture and rural development: Hubertus Gay, Annette
determinants’, Contract 153025-2012 A08-BE.                    Hurrelmann, Edit Konya, Teresa Lopez-Garcia Usach,
                                                               Rachele Rossi, Mariusz Legowski, and Andreas Lillig for
The authors would like to thank Teresa Lopez-Garcia Usach,     their active participation in the kick-off and dissemination
Meri Raggi, and Koen Dillen for acting as reviewers, Jacques   meetings.

Disclaimer
The views expressed are purely those of the authors and
should not in any circumstances be regarded as stating an
official position of the European Commission.

                                                                                                                        3
Contents
Executive summary                                                      11

1 Introduction                                                         15

2 Methodology                                                          17
  2.1 Intention survey                                                 17
  2.2 Questionnaire                                                    18
  2.3 Sampling                                                         20
  2.4 Data Collection                                                  23
		 2.4.1 Contact procedure                                             23
		 2.4.2 Field work                                                    23
  2.5 Weighting                                                        23
		 2.5.1 Methodology                                                   23
		 2.5.2 Implementation                                                24

3 Sample description                                                   25
   3.1 Farm size                                                       25
   3.2 Crop and animal production                                      26
   3.3 Farmers’ profiles                                               27
   3.4 Legal status                                                    28
   3.5 Farm location                                                   28
   3.6 CAP payments                                                    28

4 Intentions to invest in 2014-2020                                    29
   4.1 Nature of the investments foreseen in the period 2014-2020      29
   4.2 Reasons underlying the investment intentions                    32
   4.3 Financing the planned investment                                34
   4.4 Recent investments undertaken by the farmer                     35
   4.5 Characteristics of the farms with an intention to invest        37
		 4.5.1 Farm location                                                 37
		 4.5.2 Farm size                                                     39
		 4.5.3 Farm specialisation                                           40
   4.6 Characteristics of the farmers with an intention to invest      41
		 4.6.1 Farm household life cycle                                     41
		 4.6.1 Farmers’ education                                            43
		 4.6.1 Diversification of farmers’ activities                        44
		 4.6.2 Farmers’ attitudes                                            45

5 The role of the CAP in fostering intentions to invest                47
   5.1 Results from the literature                                     47
   5.2 CAP payments received by the farmers with intention to invest   49
   5.3 Change in CAP payments                                          51

6 Discussion and policy implications                                   55

7 Further research                                                     57

Annex 1: Questionnaire                                                 59

Annex 2: Population data                                               89

Annex 3: Investments in quotas                                         91

References                                                             93
List of tables
Table 1: Classification of farms in four farm specialisations according to community typology on
types of farming (TF) (REG 85/377/EEC) 21
Table 2: Regions selected and number of farms interviewed in each cluster 22
Table 3: Proportion of each farm specialisation per country 24
Table 4: CAP payments per farm 28
Table 5: Expected benefits of future investments 32
Table 6: Proportion of farmers intending to invest in each asset class, according to whether they have
invested recently in 2008-2012 36
Table 7: Support to farm investments in RD Policy 2007-2013 (EU-27 level) 48
Table 8: Classification of farmers according to their responses in question F10 (CAP scenarios) 52
Table 10: Population data. Main indicators used to select the regions sampled (CZ, DE, ES) 89
Table 11: Population data. Main indicators used to select the regions sampled (FR, IT, PL) 90
List of figures
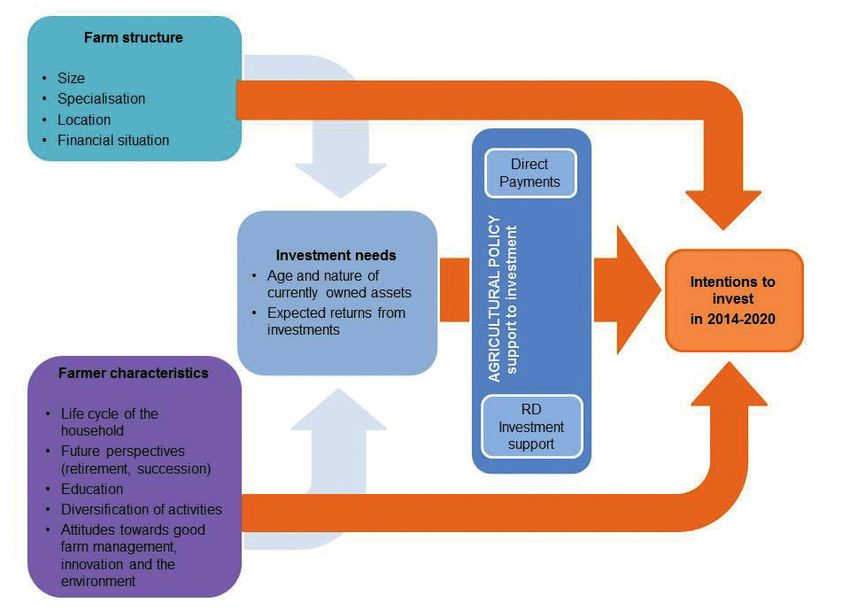
Figure 1: Questionnaire framework 18
Figure 2: Distribution of farm holdings by farm size (UAA) in the population (left) and sample (right) 25
Figure 3: Arable crops grown by arable farms (Percentage of farms growing each category of crop) 26
Figure 4: Perennial crops grown by perennial farms (Percentage of farms growing each category of crop) 26
Figure 5: Animals bred by livestock farms (Percentage of farms breeding each category of animals) 26
Figure 6: Arable crops grown and animals bred by mixed farms (Percentage of farms growing/breeding
each category of crops/animals) 26
Figure 7: Distribution of farm managers by age in the general population (left) and the survey sample (right) 27
Figure 8: Percentage of farmers intending to invest in other assets among those intending to invest 29
Figure 9: Intentions to purchase land by total number of hectares to be bought in 2014-2020 30
Figure 10: Intentions to invest in machinery and equipment by type 30
Figure 11: Intentions to invest in buildings by type 30
Figure 12: Intentions to invest in training by type 30
Figure 13: Total amount of investments intended in the period 2014-2020 per farmer (EUR) 31
Figure 14: Reasons for not investing (multiple responses allowed) 33Figure 15: Percentage of intended investments that will be financed mainly though farm revenues, bank loans,
investment subsidies and off-farm revenues 34
Figure 16: Number of investments undertaken recently (2008-2012) 35
Figure 17: Value of the investments realised in the period 2008-2012, grouped by intentions to invest in 2014-2020. 36
Figure 18: Percentage of farmers intending to invest per country 37
Figure 19: Percentage of farmers intending to invest in each type of asset per country
(in proportion of the farmers intending to invest) 38
Figure 20: Percentage of farmers intending to invest by farm location (plain, hill, mountain) 38
Figure 21: Intention to invest by farm size (Left: UAA in hectares; Right: LSU of livestock and mixed farms) 39
Figure 22: Intention to invest per farm specialisation 40
Figure 23: Plan to stop farming 42
Figure 24: Successor for the farm 42
Figure 25: Intentions to invest by farm head age 42
Figure 26: Intention to invest by expected date of retirement from farming 42
Figure 27: Intention to invest by succession profile 42
Figure 28: Farmers’ education 43
Figure 29: Farmers’ intentions to invest by level of education 43
Figure 30: Non farming income in EUR 44
Figure 31: Farmers’ attitudes towards good farm management practices 45
Figure 32: Farmers’ attitudes towards innovation 46
Figure 33: Farmers’ attitudes towards the environment 46
Figure 34: Percentage of farmers intending to invest among the beneficiaries and non-beneficiaries of CAP payments 49
Figure 35: Average CAP payments (EUR) received by farmers intending to invest and farmers not intending to invest
(average for the sample of CAP payment beneficiaries only) 49
Figure 36: Number of applications for investment support in the last four campaigns (2008-2012)
and average success rate of applications (in parenthesis) 50
Figure 37: Share of each measure supporting investment in all the applications 50
Figure 38: Type of investment undertaken with the RD investment support 51
Figure 39: Impact of different direct payment scenarios on farmers’ Intention to invest 52
Figure 40: Impact of different scenarios concerning the funds available for investment support in
the region on farmers’ Intention to invest 52
Figure 41: Farmer’s recent investments and intention to invest in quotas in 2014-2020 by country
and type of quotas 91Abbreviation list
CAP: Common Agricultural Policy
CZ: Czech Republic
DE: Germany
EAFRD: European Agricultural Fund for Rural Development
ES: Spain
EU: European Union
EU-15: 15 Member States belonging to the European Union before 2004 (Germany, Belgium, France, Italy, Luxembourg,
Netherlands, Denmark, Ireland, United Kingdom, Greece, Spain, Portugal, Austria, Finland and Sweden).
EU-N10: 10 New Member States in 2004 (Cyprus, Czech republic, Estonia, Hungary, Latvia, Lithuania, Malta, Poland,
Slovakia, Slovenia)
FADN: Farm Accountancy Data Network
FR: France
FSS: Farm Structure Survey
II: Intention to Invest
IT: Italy
LSU: Livestock Units
NUTS: Nomenclature of Territorial Units for Statistics
PL: Poland
RD: Rural development
RDP: Rural Development Payments
SAP: Single Area Payment
SFP: Single Farm Payment
UAA: Utilised Agricultural AreaExecutive summary
Executive summary
The present study aims to analyse farmers’ intentions to frame of mind and expectations about the evolution of
invest in the period 2014-2020, focussings on investments their environment and their business confidence, which are
in land, buildings, machinery and equipment, training, otherwise difficult to capture.
and quotas and production rights. It provides up-to-date
information on EU farm investment patterns that is not To capture the data, a questionnaire was developed. The
otherwise available in traditional agricultural statistics (such first part of this questionnaire concerned the farm assets,
as Farm Accountancy Data Network or the Eurostat Farm including land, buildings, machinery and equipment, training,
Structure Survey). Use of the data in this study contributes to and quotas and production rights. Details requested
the general understanding of the determinants of investment included purchase year, purchase value, and plans to sell,
decisions and farmers’ reaction to EU Agricultural policy. replace or renovate the asset. The second main part of the
However, it should be noted that given the limitations of the questionnaire included questions on farmers’ intentions to
sample, the data cannot be used to predict farm investment invest in the period 2014-2020. More details on the cost of
in the EU-28 over the period 2014-2020, nor to evaluate the investment, the planned date of the investment, the ways
to what extent Common Agricultural Policy (CAP) payments of financing this investment, and the reasons for investing
stimulate investment in EU farms. or not investing were also collected. Beyond the farmers’
intentions to invest, data on the potential determinants of
Methodology investments on the farm were also collected.
The data were collected in spring 2013, through face-to- The survey results are presented in this report. Differences
face interviews. The survey covers 780 farm-households in can clearly be seen between the characteristics of the farms
six EU countries (Czech Republic, Germany, Spain, France, and farmers intending to invest in the period 2014-2020
Italy and Poland), four different farm specialisations (arable and those not intending to invest. The report also includes
crops, livestock, perennial crops and mixed farms), as well as updated information from the current literature on the role
different farm sizes. of various factors that influence investment decisions.
A cluster-sampling procedure was used to select the Main results
farms. Three to four NUTS2 regions were selected per farm
specialisation in each of the six countries. The sample was Intentions to invest in 2014-2020: 56% of the farmers
then selected at random, within those regional farm type surveyed intend to invest in the period 2014-2020. Overall,
cells, from a list of farms developed by the survey company 40% of the farms planned to invest in machinery and
‘Gfk’. Each observation was weighted in order to account for equipment, while investment intentions in land, buildings,
potential disproportionate stratifications and non-responses. training, and quotas and production rights among farmers
Despite the adjustments, however, it must be noted that the intending to invest are less frequent (21% in land, 20% in
weighted sample remains non-representative of the EU farm buildings, 16% in training, and 3% in quotas and production
population and is biased toward larger farms and younger rights). Most farmers intend to invest in several types of
farmers compared to the actual general farm population of assets over the period 2014-2020. 28% of the farmers only
the six countries covered by the study. This study can be seen intend to invest in one asset. The main benefits expected
to focus on the more active farmers, as these are more likely from the investments foreseen in 2014-2020 are improved
to have interesting investment behaviours. working conditions on the farm and an increase in production
quality. Interestingly, cost reduction and an increase in
The methodology selected to analyse the farm investment production quantity are not as often cited.
foreseen in 2014-2020 involved development of an
‘intention survey’, followed by an analysis of the results, Financing investment: Farmers intending to invest mainly
as previous empirical research has shown that ‘stated envisage using farm resources as the major source of
intentions’ are a reasonably good approximation of ‘realised funding, and only rarely do they envisage relying mainly on
actions’ in the case of farm investments. Moreover, intention bank loans and/or subsidies. A 3% minority of the investments
surveys offer other advantages, such as revealing a farmer’s planned in land, buildings, and machinery and equipment
11‘European farmers’ intentions to invest in 2014-2020: survey results
will be funded mostly via off-farm revenues. Furthermore, positive attitudes towards innovation and to follow good
a lack of financial resources does not appear to be the main farm management practices, such as obtaining professional
limitation to investment, indeed, 43.5% of the farmers advice, regularly testing their equipment, having agricultural
showed no intention to invest during the 2014-2020 period; insurance or selling their production on contracts.
the main reasons being: (i) the uncertain expected returns on
investment, and (ii) their lack of need for new assets. The influence of farm strategy: Farmers’ investment
strategies were found to be ‘path dependant’, in that farms
Despite the fact that very few farmers declared relying with no historic expansion and modernisation strategy
exclusively on investment subsidies to finance their currently have limited investment plans, while 79% of the
investment, many of them did admit to applying for investment farmers currently intending to invest have also invested
support. Indeed, around a quarter of the farmers surveyed recently. Farmers who invested recently are more likely to
admitted to having applied at least once to rural development intend to invest again (compared to those who have not
investment support measures in the period 2008-2012, invested recently), both in the same asset class and for other
with the large majority of these applications concerning the assets. Moreover, the average value of the investments
‘121-modernisation of farm holdings’ measure, with most realised in 2008-2012 was significantly higher for the
aiming to finance investments in machinery and equipment. farmers intending to invest again compared to those who
Here, the number of applications and the average success do not intend to invest. However, for investments with longer
rate for applications varied quite substantially according lifespans and amortisation periods, such as investments in
to countries, but, generally, the average success rate was land or buildings, only a minority of the farmers that invested
high (89%). 41% of the farmers relied on credit, which was recently are intending to invest again.
mostly used to finance investment (76%) rather than to
cover consumption and general expenditures. The role of CAP payments: We found that CAP beneficiaries
(of both direct and rural development (RD)) are more intending
Heterogeneity in the patterns and determinants of to invest and the others. However, our results are insufficient
investment behaviours across countries and farm to draw a causality link between receiving these payments
types: Amongst the surveyed countries, we found that and investing. However, in the growing literature on the
Italian farmers stated they were less likely to intend to impact of CAP payments on farm investment, it is usually
invest than others in 2014-2020 (28%), while French and assumed that direct payments may favour investment by
German farmers are the most likely to invest (67% and two main channels: (i) by reducing the risk profile of income
76%, respectively). Farmers with intentions to invest have streams and as a result increasing farmers’ willingness to
significantly larger farms in terms of utilised agricultural take risky production decisions, including on investments;
area (UAA). Moreover, we observed that the largest farms and (ii) by relaxing credit constraints in the presence of
(i.e. those above 50 hectares or 50 livestock units (LSU) for capital market imperfections. Moreover, RD investment
livestock and mixed farms) have a greater intention to invest. support promotes investments that otherwise would not
We also observed differences in the intentions to invest by have been undertaken (the principle of ‘additionally’), e,g,
specialisation, with the respective values being 65% of the because the cost is too high and/or the farmer has limited
arable crop farmers, 54% of the livestock farmers, 49% of access to credit. One important complementary observation
the perennial crop farmers and 56% of the farmers with we have made is that a majority of farmers declared
mixed productions. We found land investments are most being dependent on the maintenance or increase in CAP
often planned by mixed farms, while livestock farms most payments (both direct payments and investment subsidies)
often foresee investing in buildings, and arable farms most to maintain their intentions to invest. However, a number of
often plan to invest in machinery and equipment and in farms showed that they were indifferent to the CAP (i.e. they
training. declared that they would invest whatever the level of direct
payment or investment subsidies available in the region, and
The importance of individual and behavioural factors, in particular even if payments decreased).
beyond the farm structure, in shaping investment
intentions: A farmer’s future perspective appears to Recommendations
be crucial for their decision to invest. Intentions to invest
are clearly influenced by the head of farm’s expectations The high heterogeneity in the investment intentions of
concerning the continuation of farming activity. Furthermore, farmers observed across countries, farm sizes and farm
we observe that farmers who are certain that they have no specialisations confirms the need for context-specific policy
successor are less likely to invest, whereas uncertainty on instruments to support investment. This is in line with the
succession does not seem to deter investments. However, new CAP, where the flexibility offered to Member States and
conversely, we did not observe that the presence of a regions to define the share of budget for investment support
successor increases a farmer’s intention to invest. and to adapt the implementation rules of Rural Development
(RD) measures (e.g. type of support, eligibility criteria) to
While environmental attitudes do not seem to play a role local needs has been reinforced.
in explaining intentions to invest, we observed that the
group of farmers intending to invest are more likely to have
12Executive summary
More specifically, our results allow proposing a few resources by selecting the best projects, we could imagine
recommendations. Current CAP investment support to establish a limit on the number of times that a beneficiary
schemes based on a one-time grant financing a share can receive support under the measure (e.g. 3 times for the
of the investment or on subsidised interest rates allow whole programming period). This would indirectly favour the
a relaxing of the budget constraints and, as a secondary new applicants by removing from the candidates’ pool the
effect, reducing the downside risk by reducing the actual farmers experimented in setting-up subsidy applications.
investment cost. However, the farmers we surveyed Similar eligibility conditions are already in place in the local
declared that uncertain returns on investment are a greater implementation rules of some RD programmes.
obstacle to investment than the lack of financial resources.
This suggests that instruments specifically designed to More generally, RD programmes may gain by including
reduce the risks associated with investing would be well clear statements on their objectives, focussing on one of
received by farmers. Indeed, loan guarantees, activated the following ideas: (i) giving priority to the types of support
only when farmers have difficulties reimbursing their farmers are more likely to find profitable to invest, therefore
loans, are already in place in some Member States (e.g. creating higher potential value-added for public money in
Belgium, Germany, Poland, and Spain) but may be further terms of economic return; (ii) focussing on farmers less
encouraged. likely to invest and modernise their farm autonomously,
with a subsequent higher return for the agricultural policy
Given the role of attitudes towards innovation, another in terms of compensatory and equal opportunity effects,
issue that needs attention is the connection between but potentially at the expense of economic returns; (iii)
innovation measures and investment measures. The link supporting a diversity of potentially relevant modernisation
between the modernisation of agricultural holdings (as pathways, in various sectors, even if their future profitability
supported under RD policy 2007-2013) and innovation in is uncertain, in order to maintain the diversity and resilience
the farming sector should be more clearly addressed in the of the agricultural sector.
CAP. A specific issue to address here is a better connection
between farm modernisation and the sector/chain/network The report concludes with recommendations for further
innovation strategy. research to support evidence-based policymaking in
the field of farm investment. If the objective of such a
We observed a path dependence of farm investment further study though is to collect up-to-date information
strategies: farmers intending to invest are largely the on investment intentions, the sampling methodology
same as those who invested recently. This suggests that should be revised, together with enlarging the sample,
investment support restricted to farms with on-going to achieve a true representative sample of the EU’s main
modernisation and expansion strategies may have limited farming systems and regions. The possibilities of running
effects, given that these farms may invest even without this survey over the phone or online and also reducing the
support. The selection criteria of investment projects length of the questionnaire should also be evaluated. If
already often include the socio-economic characteristics of instead the objective of such a further study is to evaluate
the farms, such as economic size (e.g. minimum revenue the role of the CAP in fostering investment and to provide
per annual work unit), the farmer’s age, or the location of clear recommendations on the design of specific policy
the farm (e.g. maximum support rates can be increased for measures, an approach based on the evaluation of case
young farmers and for areas facing natural constraints). studies could be more relevant. This would allow better
One could also imagine giving priority to farmers who accounting for the specificity of the local implementation of
have not received investment support recently. While this such measures and for comparing performances, including
should not go against the principle of best use of financial the evaluation of their net impact.
13Introducction
1 Introduction
Farm production is a function of several inputs, including the (Oude Lansink, Verstegen et al. 2001; Gardebroek and Oude
current level of capital (buildings, machinery and equipment, Lansink 2004; Oskam, Goncharova et al. 2009; Vesterlund
land), which depends on past investment decisions. Any policy Olsen and Lund 2011; Sauer and Zilberman 2012; Fałkowski
supporting investment will therefore influence farm output 2013). Guastella et al. (2013) conducted a multi-country
for some years into the future. The renewal and evolution of study (France, Germany, Hungary, Italy and United Kingdom)
farm assets is also an important driver of structural change in on investment demand for farm buildings and machinery
farming. Farm investment support is an essential component and equipment, but restricted this to specialised arable
of the productivity and sustainability enhancing strategy crop farms. A recent survey does provide recent and multi-
within the Common Agricultural Policy (CAP) in the EU. From country data on farmers’ intentions to invest (DLG Trend
a policy perspective, this raises two main questions: to what monitor Europe 2013). This survey has the advantage of
extent CAP support stimulates investment? And how can the being updated twice a year and covers a large sample of
support be targeted towards those farms and investments 2350 farmers. However the sample is biased towards large
for which the impact of support will be highest? ‘business-minded’ farmers in Europe, and is restricted to four
countries (Germany, Poland, France and United Kingdom).
The present study aims to contribute to the thinking related While our sample, albeit limited to 780 farms, contributes to
to the two questions above.1 Particularly, the objective is to the understanding of EU farmers decisions in a broader and
provide up-to-date information on a sample of EU farms’ more diverse range of farms and farmers’ situations.
intentions to invest in the coming CAP programming period
(2014-2020). This will contribute to the understanding of the The survey presented in this report is the third exercise
factors underlying and directing farmers’ intentions to invest. on farm investment conducted by JRC-IPTS in cooperation
This is a prerequisite to answer the two aforementioned with other research institutions. In 2006, JRC-IPTS started,
questions, and more generally for the successful formulation in agreement with Directorate-General for Agriculture and
of CAP policies. Rural Development (DG-AGRI), farm-level modelling activity
based on a survey of a non-representative sample of 248
The contribution of this study is threefold. First, the survey EU farmers, to investigate farmers’ investment behaviours,
provides ex ante data on investments likely to be realised and evaluate the impact of different CAP scenarios on a
in the period 2014-2020, while most studies focus on the selected group of farming systems. The report, Investment
determinants of investments already realised (Buysse, Behaviour in Conventional and Emerging Farming Systems
Verspecht et al. 2011; Esposti 2011; Ferto, Bakucks et under Different Policy Scenarios, was issued in 2008 (based
al. 2011; Kirchweger, Eder et al. 2011; Vesterlund Olsen on the 2006 survey). A second report, Farm Investment
and Lund 2011). Second, the survey covers intentions to Behaviour under the CAP Reform Process, was issued in
invest in various on-farm asset classes (land, machinery 2011 (based on the 2008 survey). This largely replicated
and equipment, buildings, training, quotas and production the 2006 study with a sample of 256 farms. These two
rights), as well as on farms and farmers’ characteristics. reports analysed the determinants of investments, but with
Last, and to the best of our knowledge, the study presented a main focus on the impact of the Single Payment Scheme
here is one of the very few cross-country and cross-farm (SPS). The main result of these two previous studies was
specialisation studies on on-farm investment. Most studies to show that farmers were to a great extent indifferent to
on the determinants of farmers’ investment decisions have decoupling their investment decisions. The amount received
focused on one country and/or on one farm specialisation from SPS was rarely reinvested (in 2008, on average 82% of
the payments from SPS were used to cover on-farm current
expenditures, whereas on-farm investments represented
only 14%). In the few cases where payments from SPS had
1 The evaluation of investment support under Rural Development Policy (December
2013-November 2014, AGRI-2013-EVAL-06) will provide more direct answers to these an impact on investment, they mainly reinforced existing
questions. More precisely, this evaluation is intended to measure the effectiveness, strategies: expansion for bigger and more efficient farms
efficiency and impact of the investment support in ten RD program territories selected vs extensification or abandonment for smaller and poorer
as case studies. It is also expected to provide an assessment of the methodologies
commonly used to evaluate the impact of investment support, as well as an performing farms. Among the other drivers of investment,
assessment of the mechanisms and criteria used to target investment support. markets (price of inputs and outputs, credit constraints)
15‘European farmers’ intentions to invest in 2014-2020: survey results
were more important than the level of payment received of the literature and policy agenda (CAP post-2013), the
(albeit with a high variability of impact across farms). The policy instruments analysed here go beyond just direct
simulations of reactions to different scenarios defined by payments, with a stronger focus on rural development
prices and policy changes showed that, given the narrow payments that support investment and the modernisation
profit margins, price decreases in the range of 20% would of farm holdings.
have a very detrimental effect on economic sustainability
and investment. The same happens, albeit with less extreme The current report is structured as follows. Section 2
results, if the SPS is removed. presents the questionnaire and sampling methodology. The
sample characteristics are then described in section 3. The
For the 2013 survey, the sample size was increased and patterns and determinants of the investment intentions in
the sampling approach was revised in order to achieve a 2014-2020 are presented in section 4. The specific results
better coverage of the main farming systems and regions on the role of the CAP are presented in section 5. The results
of the EU. Further emphasis was placed on the role of and their policy implications are then discussed in section
the individual and on the behavioural characteristics of 6, and section 7 concludes and highlights any limitations of
the head of the farm, as these are also likely to impact the study and prospective areas for future research.
investment decisions, beyond just the farm structure and
policy variables. Moreover, based on an updated review
16Methodology
2 Methodology
2.1 Intention survey future decisions and adjustments to potential changes
in their environment (Bougherara and Latruffe 2010;
The methodology selected to analyse farm investment Bartolini and Viaggi 2011; Raggi, Sardonini et al. 2012).
foreseen in 2014-2020 is an ‘intention survey’. The theoretical rationale behind the intention survey is the
Theory of Planned Behaviour (TPB). This theory assumes
In using an intentions survey it is worth noting that some that (i) people’s decisions originate from their intentions to
concerns have been raised in the literature on the ability of perform a specific behaviour; and (ii) a person’s intentions are
stated intentions to predict real behaviours. For instance, one influenced by their attitudes towards the behaviour, which
obvious reason why farmers’ decisions may not match their refers to the degree to which a person has a favourable or
original intentions is that more, or new, information becomes unfavourable appraisal of the behaviour in question. The
available following the survey, either because the environment TPB also stipulates that, to generate an intention to perform
has changed or because the farmer did not previously have a specific behaviour, a positive attitude is not enough, the
access to the information (Thomson and Tansey 1982; Manski individual also needs to hold a perception that others in
1990; Vare, Weiss et al. 2005). Beyond the factors related to their social network support the behaviour (social norms)
context, the literature points out two biases likely to impact and the individual also needs to feel that they can influence
farmers’ responses in intention surveys. First, ‘negligence and control their behaviour (perceived behavioural control)
bias’, which arises from the farmers devoting too little time (Ajzen and Madden 1986; Ajzen 1991). More generally, the
to answering the questionnaire, with a risk that the survey theory suggests that farmers take into account some of the
might not thus reveal their true preferences. The farmers investment constraints they may face when disclosing their
might also feel obliged to answer questions about intentions intentions to invest.
even though they have not yet made specific plans (Bagozzi
and Yi 1989; Vare, Weiss et al. 2005). The usual difficulties In practice, surveys of farmers’ intentions are used mainly for
related to questionnaire design are greater in intention two reasons. First, they are an attractive tool to investigate
surveys due to the need to pre-judge the basis upon which hypothetical situations, which is a common need in ex ante
the farmers respond to questions about their plans for the policy evaluations. Second, the survey results provide a good
future. Some may report their intentions on the basis of the insight into farmers’ expectations about the evolution of their
actual environment, which is in reality unlikely to persist, or environment and business confidence, which is very likely to
may extrapolate price and income trends and report their shape their actions in the short term (Harvey 2000). Given
intentions based on these (unreported) assumptions. In a the present high level of uncertainty surrounding farming
stated intention survey, the researcher should attempt to (e.g. regarding agricultural prices in the short term, the future
define explicitly the conditions under which the intentions of the Common Agricultural Policy in the medium term and
are to be formulated. However, the possibility of respondents climate change in the long term), behavioural components
ignoring or disagreeing with these assumptions cannot be such as farmers’ perceptions and attitudes toward risk are
disregarded (Thomson and Tansey 1982). The second type likely to play a fundamental role in agricultural decisions (Just
of bias is the ‘manipulation bias’, i.e. responses might be 2008). When complex human decisions are involved, surveys
biased if respondents think that their answers can influence on intentions may be more accurate than programming
the result of the survey and the subsequent policy decision models in the representation of behaviours, as they usually
(Thomson and Tansey 1982). Biased responses arise from require fewer assumptions than models and can rely on
the desire to look socially responsible or to exert influence the respondents’ perception to provide a synthesis of their
toward a desired end (Fujii and Gärling 2003). These are likely reactions to complex context variables. In these cases,
important concerns in studies regarding agricultural policy, it is reasonable to rely on surveys of stated intentions to
a field in which farmers’ lobbies are powerful and where it complement programming models, allowing for a consistent
may seem possible for some respondents that the parties comparison of results under different scenarios (Viaggi,
involved in policy negotiations may make use of the results. Raggi et al. 2011). Moreover, previous empirical research has
shown that stated intentions are a reasonably good predictor
Despite all these limitations, the reliance on ‘intentions data’ of realised actions in the case of land investments (Lefebvre,
is becoming increasingly common when studying farmers’ Raggi et al. 2013).
17‘European farmers’ intentions to invest in 2014-2020: survey results
2.2 Questionnaire aspects (via consultation with DG-AGRI) and recent results
in the literature on farm investment.
The questionnaire was developed according to the The English version of the questionnaire is available in
framework presented in Figure 1. It includes questions annex 1. Translations of the questionnaire were carried out
related to farmers’ investments intentions for 2014-2020, within the GfK network by translators with experience in
and information on farms and farmers’ characteristics likely the field of agriculture. Translations were also checked by
to explain these intentions to invest. The questionnaire from subject-matter experts from each country, assessing the
the two previous studies was used as a basis and modified quality of the translation and the accuracy of the technical
according to the interest shown by policymakers for specific terms.
Figure 1: Questionnaire framework
18Methodology
The screening questions were asked over the phone when Section C included questions on the people working on
the farmers were first contacted. They included NUTS region the farm: the number of permanent and temporary workers
where the farm is located, farm size in hectares and the and contractors employed by the farmer. Permanent workers
activities contributing most to the overall farm income (later are defined as persons working full time on the farm and
used to define farm specialisation). receiving a wage for their work on the farm. No information
was collected on the labour of family members that did not
Section A included traditional questions on the farm formally earn a salary. Moreover, the questionnaire includes
(including location, e.g. in plain, hill or mountain; share information on the nature and costs of externally contracted
of organic production; legal status) and the farmer’s activities.
characteristics (age, structure of the household, education,
future perspectives in terms of exit from farming and In section D, the farm’s currently owned assets were
succession). reported: type of assets, purchase date2 and value. The types
of past investments were split into the categories of land,
Besides the socio-demographic characteristics, a series machinery and equipment, buildings, training, and quotas
of questions were added in order to assess farmers’ and production rights. For the investments in buildings,
attitudes. Attitude is a disposition to respond favourably or machinery and equipment and training, farmers were asked
unfavourably to an object, person, institution or event (Kim about their plans for renovation, replacement and training
and Hunter 1993). The questionnaire focused on attitudes updates. For quotas and production rights, future plans for
towards good farm management practices, innovation, and the sale of these were also measured.
the environment, considered as potential subjects relevant
to investment intentions. To measure the attitudes towards Section E included questions concerning the farm’s
good farm management practices, the questionnaire was financial resources.
designed using the scale developed by Hansson & Lagerkvist
(2012) for risk attitudes. Farmers were asked ‘How likely are No information was collected on the total net income
you to ever find yourself in each of the following situations?’. of the farmers. Also this cannot be computed as we only
The list of farm management practices covers aspects of collected information on output price and yield, but not on
financial, production, environmental and social management costs. Moreover, the questionnaire focused on the activities
likely to have both positive or negative impacts. For the and production corresponding to the farm specialisation,
attitudes towards the environment and innovation, farmers and therefore does not cover all the activities of each farm.
were asked ‘To what extent do you agree or disagree with However, as a proxy for financial resources, we know the
the following statements?’. Farmers’ environmental attitudes hypothetical wage in an alternative profession that would
were evaluated using seven questions, four of which were cause the respondent to stop farming (section A). Moreover,
developed by Vogel (1996) and the others by the authors. the survey included information on annual off-farm income
Attitudes towards innovation were measured by means of for part-time farmers, and the total off-farm income of the
eight questions, based on a scale developed for consumer household (section C).
attitudes (Goldsmith and Hofacker 1991), completed by
a list of questions on openness to new ideas in business Information on CAP payments received (direct and rural
(Edwards-Jones, Deary et al. 1998). development payments) was collected. In particular, farmers
were asked whether they applied to any rural development
In section B, details on farm activities were collected. Farm measure supporting investment in the last four campaigns,
activities influence the type of assets farmers most need and in particular from Measures: 121 (modernisation of farm
therefore may influence their investment plans. The revenues holdings), 112 (support for setting up of young farmers) and
generated also differ according to the type of activities and 123 (support for adding value to agricultural and forestry
this therefore influences the potential return from investment. products). Details on the nature of the investment to be
Only information on the activities that contributed most to subsidised, whether the application was successful and
their overall farm income were questioned (e.g. animals for the farmers’ satisfaction with the process of applying for
livestock farms, crops for farms specialised in arable crops investment support were also collected. Farmers were also
and perennial crops, and both crops and animals for mixed asked whether they had bank loans in the period 2008-2012
farms). The information collected included area grown and (amount, period, and use of money), and whether they faced
average yield for crop farms or the number of animals for limitations in accessing credit.
livestock farms, as well as average prices received for their
production over the last four campaigns in 2008-2012 (in
order to flatten out the effects of specific weather conditions
or socio-economic conditions in a certain year). For each 2 The question on the investments made or planned, until the end of 2013 did not
specify a timeframe, therefore some farmers gave information on investments realised
of the crop or animal types, the respondents also provided a long time ago (e.g. the oldest investment cited dated back from 1900). However,
details on the proportion sold against the fixed/guaranteed given that there were a maximum number of past investments that could be declared
price. Furthermore, information on income from non-farming (seven investments for land, eight for machinery and equipment, eight for buildings,
three for training, and four for quota and production rights), we do not claim to have
activities was collected. collected information on all investments realised in the farmer’s professional lifetime.
Most of the farmers have provided information on their more recent investments. In
the analysis, we only focus on those investments realised between 2008 and 2012.
19‘European farmers’ intentions to invest in 2014-2020: survey results
In section F, farmers were asked their intentions to the willingness to carry out other investments. In building-
invest between 2014 and 2020. Farmers were also intensive systems (e.g. livestock farming), buildings may be
asked to predict the direction of their farming activity in the highly demanding in terms of investment. Machinery and
coming seven years. Intentions to invest were then detailed equipment are increasingly important components of farm
according to investment type, investment value, planned assets. An important part of innovation in farming is related
date for investment, ways of financing this investment, to the adoption of advanced technology (e.g. improved
and the rationale for the investment. This enables a full information systems for precision farming). In relation to
understanding of the farmer’s investment intentions, previous studies, investments in training were added in this
according to the type of assets, costs and expected benefits. survey, due to the increased policy interest in this subject.
Those who did not intend to invest gave reasons why not. Given that the main objective of the survey is to analyse
farm investment, we only collected information on training
The period 2014-2020 corresponds to the next CAP paid for by the farmer. We therefore do not have an accurate
programming period. We assumed some farmers already overall picture on the amount of training received by the
had information on the on-going discussions for CAP reform farmers; which might include training offered for free to the
at the time of the survey but we did not make any reference farmers from extension services, cooperatives and input
to the policy in the first part of question F. Then, for those suppliers. No information was collected on intentions to plant
farmers having stated an intention to invest, we tested the new trees (investment in plantation). Intentions to invest in
impact that hypothetical changes in the CAP payments milk and sugar beet quotas and vineyard production rights
would have on these investment plans. More precisely, are a special case, given the announced phasing out of these
farmers were asked whether their declared intentions to quotas (dairy quotas will expire in 2015, the planting rights
invest in the period 2014-2020 would be modified under system will end in 2018 at the latest, and sugar quotas will
different scenarios. The different scenarios tested concerned be abolished in 2017 (EC 2013)). These results are therefore
possible changes (i.e. increase of 50%, status quo, decrease presented separately in annex 3.
of 50%) in: (i) direct payments per hectare to be received in
the period 2014-2020; and (ii) rural development funds to
be allocated to farm modernisation (investment subsidies) 2.3 Sampling
at the regional level from 2014 onwards. Farmers had to
indicate for each scenario and for each class of assets The sample covers six countries with diverse agroclimatic
whether they were likely to invest (i.e. they would definitely conditions, farm structures and implementation modes of
realise the investment mentioned previously, or it is likely the Common Agricultural Policy, namely: Czech Republic,
that they will realise the investment) or they were not Germany, Spain, France, Italy and Poland. Germany and
likely to invest (i.e. it is likely that they will not realise the Italy were the largest countries that have implemented
investment or they will definitely not realise the investment). the Single Farm Payment since 2005, adopting different
decoupling mechanisms. Poland provides an example of a
The survey focuses on physical on-farm investment (land, country in Eastern Europe, with an important agricultural
buildings, machinery and equipment) and investments sector and with a different policy setting, characterised by
in training and quotas and production rights. Land is a increasing area payments through the Single Area Payment
peculiar asset in farming, as it covers most of the value (SAP) scheme. Spain complements the results from Italy with
to farms (except for some livestock farms with animal purely Mediterranean areas. Czech Republic complements
indoors and little land). The investment in land depends Poland with case studies from a different new Member
on diverse and complex factors, such as competition for State. France represents an important share of agriculture
land use, speculative forces in the land market, the design in the EU-15; furthermore it is a benchmark country for the
of the agricultural policy, etc. (Ciaian, Kancs et al. 2012). SFP implementation, as it has applied a partial decoupling.
Farmers operating family farms may also have individual or
personal reasons to sell or keep their land, including family The sample also covers the four main farm specialisations:
traditions, prestige, and lifestyle values. Investing in land arable crops, perennial crops, livestock and mixed farms.
requires time for planning and realisation, which makes it Farms are classified as specialised in livestock if at
more likely that farmers develop an intention to invest a least 66% of their overall income comes from livestock
few years before actually realising the investment. However, production (the same applies for the arable and perennial
the timing of operations in any land transaction may be specialisation), while mixed farms derive at least 33%
slow and delays are also possible, which can impact on the of their income from crop production and 33% from
connection between intentions and actions (Lefebvre, Raggi livestock production. The types of farming in the European
et al. 2013). Since land represents the main limiting factor Community typology covered by each farm specialisation
to size adjustment, the investment in land interacts with are presented in Table 1.
20Methodology
Table 1: Classification of farms in four farm specialisations according to community typology on types of
farming (TF) (REG 85/377/EEC)
Farm Specialisation Codes Grouping of TF on the basis of principal types of farming
Arable crops 13 Specialist cereals, oilseeds and protein crops
14 General field cropping
60 Mixed cropping
Perennial crops 20 Specialist horticulture
31 Specialist vineyards
32 Specialist fruit and citrus fruit
33 Specialist olives
34 Various permanent crops combined
Livestock 41 Specialist dairying
42 Specialist cattle - rearing and fattening
43 Specialist cattle – dairying, rearing and fattening combine
44 Sheep, goats and other grazing livestock
50 Specialist granivores
Mixed farms 71 Mixed livestock, mainly grazing livestock
72 Mixed livestock, mainly granivores
81 Field crops - grazing livestock combined
82 Various crops and livestock combined
A purely random sampling design was impossible due to of regions was made, can be found in annex 2 (2010 Farm
the limited budget and time, as well as the high costs of Structure Survey),; (2) The rankings of the four indicators
conducting face-to-face interviews. A cluster-sampling were then combined, resulting in an overall ranking; (3) The
approach was thus selected. Cluster sampling is more four regions with the highest overall ranking were selected
economical and practical than purely random sampling (except in the case of Czech Republic, where the top three
when the population under study is large and spread over a were selected). We can verify that, for each country and
wide geographical area. Resources are allocated to the few farm specialisation, the selected regions cover at least
selected clusters instead of the entire country. 40% of the national UAA of this farm specialisation.
In the first stage, clusters were selected on the basis of In the second stage, farms were selected randomly within
being regions in which a particular farm specialisation is each cluster. Given the sampling plan and budget constraint,
well represented (purposive sampling). For each of the four we initially aimed to interview 30 farmers for each farm
farm specialisations, three to four regions were selected by specialisation in each country (therefore seven or eight
country, adding up to 92 clusters in total. The selection of farmers per cluster). However in some regions, it was difficult
regions for each country and farm specialisation involved to find a sufficient number of farms willing to participate
three steps: (1) First, regions were ranked according to the in the study as foreseen in the sampling plan. Some
value of four indicators: the number of holdings, the utilised exceptions to the sampling plan were therefore made, and
agricultural area in hectares or the number of livestock to compensate, a higher number of interviews were realised
units for livestock farms, the economic importance of each in other regions or in other farm specialisations. A total of
farming type in that region in terms of standard output (€) 780 interviews were carried out. The number of interviews
and agricultural labour. The data from which the selection conducted in each cluster varied between 4 and 15 (Table 2).
21‘European farmers’ intentions to invest in 2014-2020: survey results
Table 2: Regions selected and number of farms interviewed in each cluster
Arable Perennial Livestock Mixed Total
Czech Republic
Jihov chod CZ06 10 11 13 11
Jihozápad CZ03 12 11
Severov chod CZ05 10 12 12
Severozápad CZ04 11
Strední Cechy CZ02 11 10
Total 32 31 37 34 134
Germany
Baden-Württemberg DE1 10 10 8 9
Bayern DE2 12 6 9 6
Niedersachsen DE9 8 8 8
Nordrhein-Westfalen DEA 9 8 9 7
Rheinland-Pfalz DEB 7
Total 39 31 34 30 134
Spain
Andalucía ES61 8 7 8 7
Aragón ES24 7
Castilla y León ES41 8 7 8
Castilla-la Mancha ES42 7 7
Cataluña ES51 8
Comunidad Valenciana ES52 8
Extremadura ES43 7 8
Galicia ES11 7 8
Total 30 30 29 31 120
France
Aquitaine FR61 7 10
Basse-Norm andie FR25 8
Bretagne FR52 15 7
Centre FR24 9
Champagne-Ardenne FR21 7 6
Languedoc-Roussillon FR81 10
Midi-Pyrénées FR62 12 10 4
Pays de la Loire FR51 7 8
Picardie FR22 7
Provence-Alpes-Côte
FR82 7
d’Azur
Total 35 30 40 29 134
Italy
Emilia-Romagna ITH5 8 8 7
Lombardia ITC4 7 8 7
Piemonte ITC1 7 8
Puglia ITF4 8 6
Sardegna ITG2 7
Sicilia ITG1 8
Toscana ITI1 8
Veneto ITH3 7 8 8
Total 30 30 30 30 120
Poland
Dolnoslaskie PL51 8
Kujawsko-Pomorskie PL61 8
Lódzkie PL11 7 8
Lubelskie PL31 9 9 9
Mazowieckie PL12 9 7 8 12
Podlaskie PL32 8
Swietokrzyskie PL33 8
Wielkopolskie PL41 9 8 11
Total 35 31 32 40 138
Total 201 183 202 194 780
22You can also read