Changes in the kidney proteome of vitamin D receptor knock-out mice
←
→
Page content transcription
If your browser does not render page correctly, please read the page content below
Institut für Experimentelle Genetik
       GSF-Forschungszentrum für Umwelt und Gesundheit
                           Neuherberg

    Changes in the kidney proteome of vitamin D
             receptor knock-out mice

                               Daniela Perovic

Vollständiger Abdruck der von der Fakultät Wissenschaftszentrum
Weihenstephan für Ernährung, Landnutzung und Umwelt der Technischen
Universität München zur Erlangung des akademischen Grades eines

                       Doktors der Naturwissenschaften

genehmigten Dissertation.

Vorsitzender:           Univ.-Prof. Dr. Alfons Gierl

Prüfer der Dissertation: 1. Univ.-Prof. Dr. Johannes Buchner
                         2. Univ.-Prof. Dr. Wolfgang Wurst

Die Dissertation wurde am 13.02.2003 bei der Technischen Universität München
eingereicht und durch die Fakultät Wissenschaftszentrum Weihenstephan für
Ernährung, Landnutzung und Umwelt am 15.04.2003 angenommen.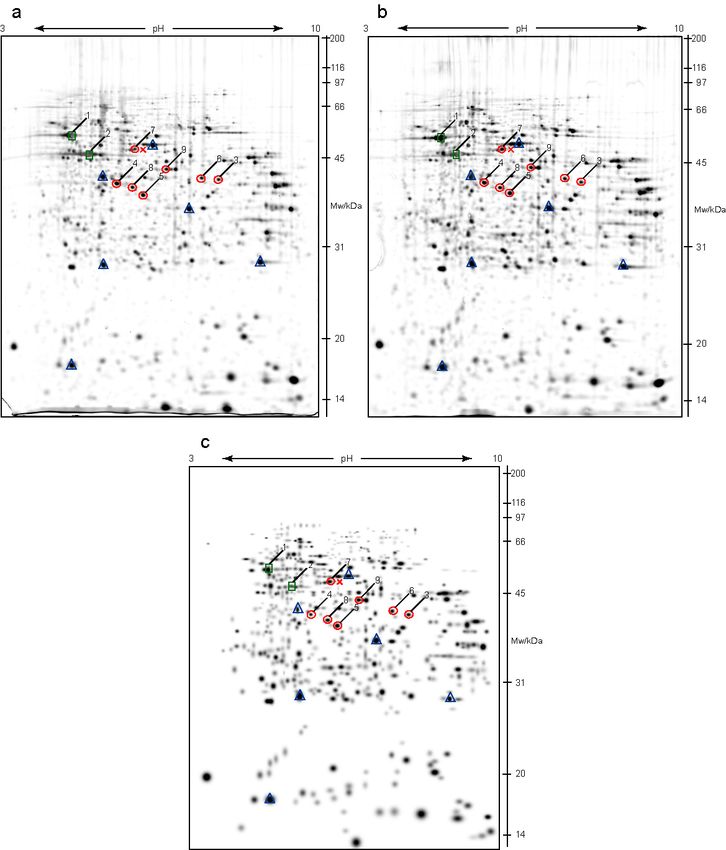
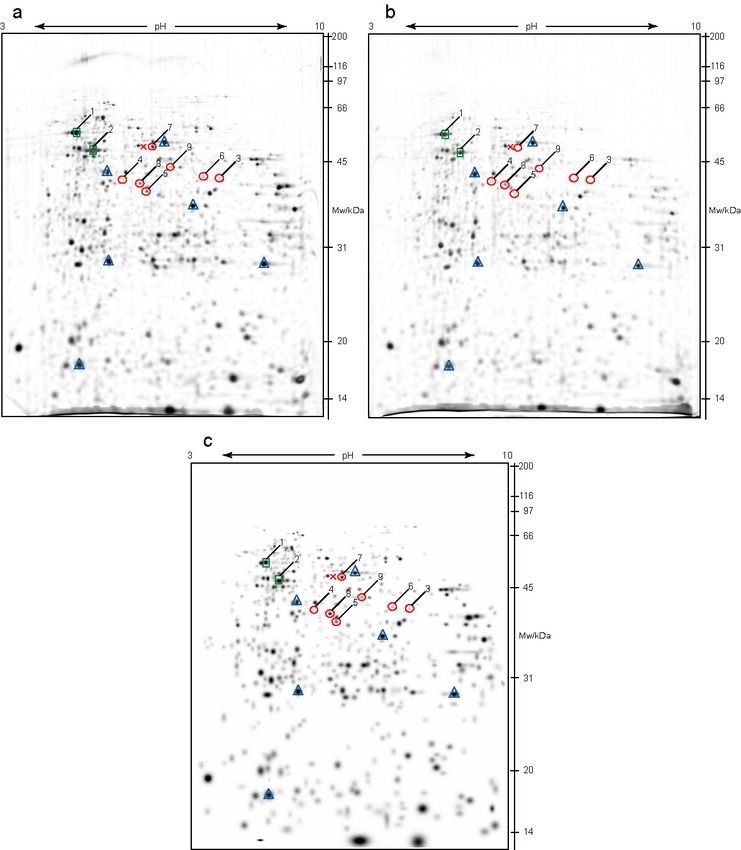
Table of content

Abstract                                                                   5
Zusammenfassung                                                            7
Abbreviations                                                              9

1. INTRODUCTION                                                            11

     1.1. Vitamin D                                                        11
            1.1.1. Metabolism                                              11
            1.1.2. The role of vitamin D                                   13
            1.1.3. Mechanism of action                                     13
     1.2. Nuclear vitamin D receptor (VDR)                                 16
     1.3. Vitamin D deficiency                                             17
            1.3.1. Phenotypic characteristics of VDR knock-out mice        17
                   1.3.1.1. Impact of VDR deficiency on renal tubular
                             calcium reabsorption                          18
     1.4. Aim of the study                                                 19

2. RESULTS                                                                 21

     2.1. Two-dimensional electrophoresis                                  21
            2.1.1. Isoelectric focusing                                    21
            2.1.2. SDS-polyacrylamide gel electrophoresis                  22
            2.1.3. PDQuest software analysis of 2-D electrophoresis gels   26
            2.1.4. 2-D electrophoresis in a narrow pH range                32
     2.2. Protein identification                                           34
            2.2.1. Visualization                                           34
            2.2.2. MALDI-TOF mass spectrometry                             36

3. DISCUSSION                                                              47

     3.1. Two-dimensional electrophoresis (2-D electrophoresis) as
           a method of choice in different protein expression analysis     47
             3.1.1. 2-D electrophoresis limitations                        48
             3.1.2. Improvement possibilities                              50
     3.2. Identified changes in protein expression and connection
           to vitamin D                                                    51
     3.3. Conclusions                                                      55

                                                                                3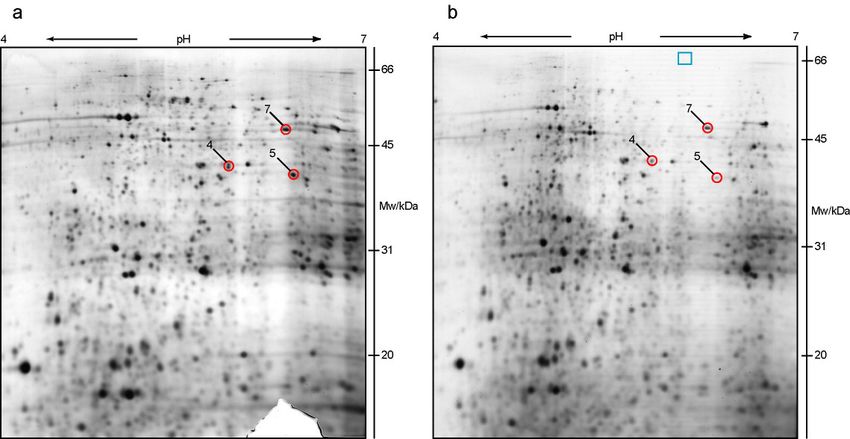
4. MATERIALS AND METHODS                                               57

       4.1. METHODS                                                    57
             4.1.1. Two-dimensional electrophoresis                    57
                     4.1.1.1. First dimensional isoelectric focusing   60
                     4.1.1.2. Second-dimension SDS-PAGE                64
                     4.1.1.3. Visualization                            66
                     4.1.1.4. Pattern evaluation                       67
             4.1.2. In-gel digestion                                   68
             4.1.3. MALDI-TOF mass spectrometry                        69

       4.2. MATERIALS                                                  75
             4.2.1. Buffers and solutions                              75
             4.2.2. Chemicals                                          79
                     4.2.2.1. General                                  79
                     4.2.2.2. Standards                                80
             4.2.3. Enzymes                                            80
             4.2.4. IEF material                                       80
             4.2.5. SDS-PAGE material                                  80
             4.2.6. Other material                                     80
             4.2.7. Animals                                            81
             4.2.8. Software                                           81
             4.2.9. Devices                                            81

Literature                                                             83

List of figures                                                        91

List of tables                                                         93

5. APPENDIX                                                            95

       5.1. Protein concentration measurement                          95

Acknowledgements                                                       99

4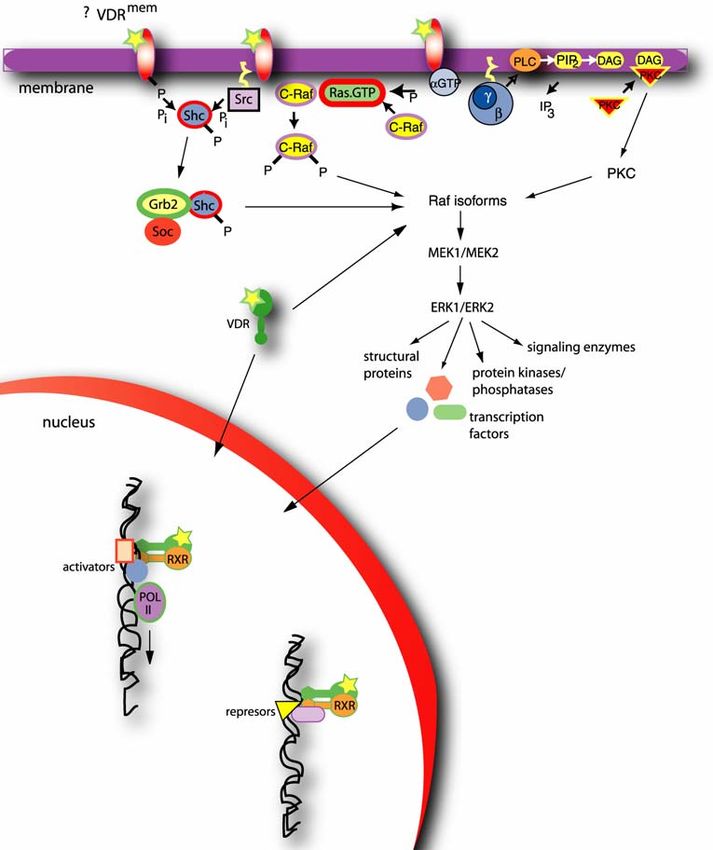
Abstract
   Vitamin D is a steroid hormone whose main function in organism is
regulation of Ca2+ metabolism. The hormone acts in various tissues, but
mostly in kidney, bone and intestine, either directly, influencing genomic
and nongenomic responses, or indirectly via regulation of Ca2+
homeostasis. To exert its genomic actions vitamin D binds to the vitamin D
receptor (VDR), whereupon liganded receptor binds to vitamin D response
elements (VDRE) in target gene promoter regions and activates
transcription. The mechanism of nongenomic responses, which take only
seconds/minutes and modulate different signalling pathways, is still
unclear.
   VDR belongs to the steroid hormone receptor superfamily and contains
several domains common to all members of the family, including an N-
terminal DNA binding domain, a ligand binding domain, a transcription
factor domain and a C-terminal domain responsible for interactions with
cofactors.
   In this study, VDR knock-out mice were examined, in which the DNA
binding domain of VDR was partially deleted, thus disabling DNA binding,
but the receptor was expressed and had an intact ligand binding domain.
This mutation caused ablation of both, genomic and nongenomic
responses in mice. Therefore, changes in the expression level of a large
number of different proteins, which are regulated by vitamin D, or involved
in vitamin D mediated response, were expected. Hence 2-dimensional
electrophoresis was used to investigate changes in the kidney proteome of
VDR knock-out mice. This approach enables an unbiased exploratory
survey of a huge number of proteins at the same time.
   Using this technique a number of differentially expressed proteins were
identified: VDR, cytosolic malate dehydrogenase, lactate dehydrogenase,
hydroxyacid oxidase and adenosine kinase. Except VDR, all of them were
significantly downregulated in VDR knock-out mice and they were
generally involved in central metabolic processes in the cell. Taken
together, downregulated expression of these enzymes implied lower
energy supplies in kidneys of VDR deficient animals. However, no major
functional abnormalities in VDR knock-out mice could be observed.
   Identification of VDR itself provided additional evidence that the
receptor was expressed, even with partially deleted DNA binding domain,
and therefore points to the importance of the N-terminal part of the protein
in vitamin D response.

                                                                          5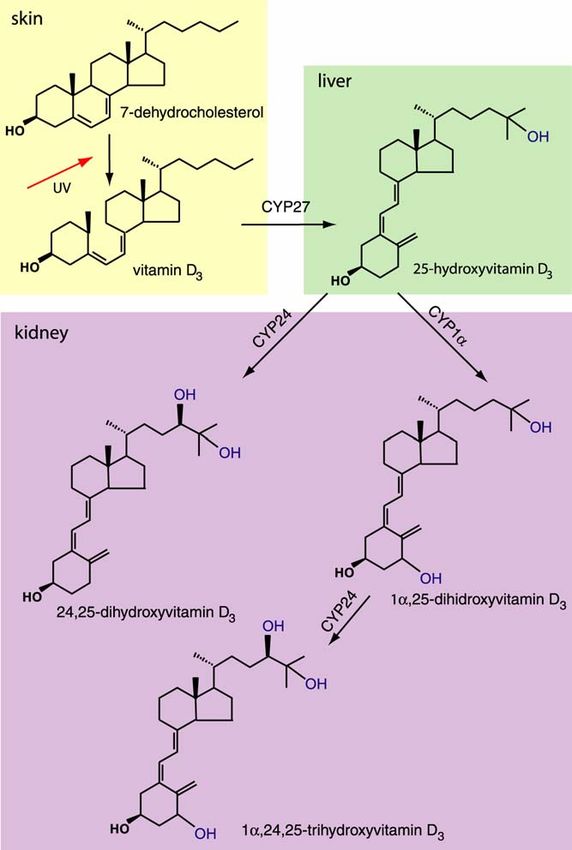
6
Zusammenfassung
   Vitamin D ist ein Steroidhormon, dessen Funktion hauptsächlich in der
Regulation des Calciummetabolismus besteht. Hierfür wirkt es in
zahlreichen Geweben, aber vor allem in der Niere, in den Knochen und im
Darm. Vitamin D kann direkt (genomische und nicht-genomische
Wirkweise) oder indirekt (Einfluss auf die Calciumhomöostase) wirken. Die
genomische Wirkung wird durch die Bindung und des Vitamin D an den
Vitamin D-Rezeptor (VDR) vermittelt. Dieser Komplex bindet an Vitamin D-
Response-Elemente (VDRE) in Promotoren von Zielgenen und aktiviert so
deren Transkription. Der Mechanismus der nicht-genomischen
Reaktionen, die innerhalb von Sekunden oder Minuten ablaufen und
verschiedene Signalwege modulieren, ist immer noch unklar.
   VDR gehört zur Steroid-Rezeptor-Superfamilie und enthält mehrere
Domänen, die allen Mitgliedern gemeinsam sind. Dazu gehören eine N-
terminale DNA-Bindungsdomäne, eine Liganden-Bindungsdomäne und
eine C-terminale Region, die für die Wechselwirkung mit Cofaktoren
zuständig ist.
   In der vorliegenden Arbeit wurden VDR-knock out-Mäuse (VDR-k.o.-
Mäuse) untersucht. Diese zeichnen sich durch eine teilweise verkürzte
DNA-Bindungsdomäne des VDR aus. Der Rezeptor wird zwar exprimiert,
kann aber nur Vitamin D und nicht mehr VDREs binden.
Erstaunlicherweise fallen dadurch sowohl die genomischen als auch die
nicht-genomischen         Reaktionen   komplett   aus.   Deshalb    wurde
angenommen, dass sich das Expressionsniveau zahlreicher Proteine, die
entweder von Vitamin D reguliert werden oder an der Vitamin D-Antwort
beteiligt sind, ändern sollte. Um diese Veränderungen zu untersuchen,
wurde das Nieren-Proteom von VDR-k.o.-Mäusen mit zwei-dimensionaler
Elektrophorese analysiert. Durch diesen Ansatz wird die Analyse einer
großen Zahl von Proteinen in einem einzigen Experiment auf
unvoreingenommene und umfassende Art ermöglicht.
   Eine Reihe unterschiedlich exprimierter Proteine wurde mit Hilfe dieser
Technik identifiziert: Neben VDR waren dies u.a. die zytosolische
Malatdehydrogenase, die Laktatdehydrogenase, die            Hydroxysäure-
oxidase und die Adenosinkinase. Mit Ausnahme von VDR sind alle diese
Proteine, die an zentralen intrazellulären Stoffwechselprozessen beteiligt
sind, in den untersuchten VDR-k.o.-Mäusen signifikant herunterreguliert.
Diese Daten weisen auf eine mangelhafte Energieversorgung in der Niere
der VDR-defekten Tiere hin. Allerdings wurden keine signifikanten
Funktionsstörungen beobachtet.
   Die Beobachtung, dass auch VDR selber in VDR-k.o.-Mäusen
fehlreguliert ist, lieferte einen zusätzlichen Hinweis, dass der Rezeptor
exprimiert wird, auch wenn ihm Teile der DNA-Bindungsdomäne fehlen.
Das bestätigt die wichtige Funktion der N-terminalen Rezeptor-Domäne
für die Vitamin D-Antwort.

                                                                        7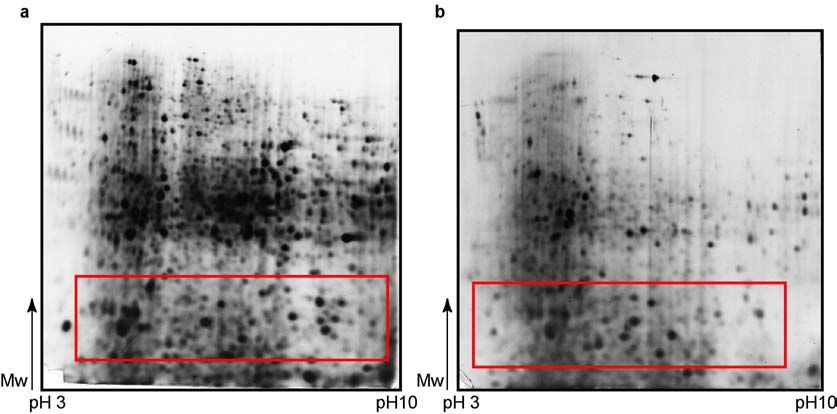
8
Abbreviations

1α,25-(OH)2D3         1α,25-dihydroxyvitamin D3
2-D electrophoresis   two-dimensional electrophoresis
25-OH-D3              25-hydroxyvitamin D3
A660                  absorbance at 660 nm
ACTB                  β-actin
ACTH                  adenocorticotropic hormone
ADH                   alcohol dehydrogenase
ADK                   adenosine kinase
AF-2 domain           affinity function domain
AMP                   adenosine monophosphate
ATP                   adenosine triphosphate
ATPB                  ATP synthase β-chain
BSA                   bovine serum albumin
CaR                   extracellular Ca2+( Ca o2 + )-sensing receptor
COOH terminus         carboxyl terminus
CYP1α                 25-hydroxyvitamin D-1α-hydroxylase
CYP24                 25-OH-D3-24-hydroxylase
CYP27                 vitamin D3-25-hydroxylase
DAG                   diacylglycerol
DBP                   vitamin D binding protein
DIGE                  difference gel electrophoresis
DNA                   deoxyribonucleic acid
DTE                   dithioerythritol
DTT                   dithiothreitol
EcaC -1 and -2        epithelial calcium channels 1 and 2
ERK1/ERK2             extracellular signal-regulated kinase 1 and 2
HAO3                  hydroxyacid oxidase 3
HCCA                  α-cyano-4-hydroxycinnamic acid
IEF                   isoelectric focusing
IL-4                  interleukin-4
IL-18                 interleukin-18
IP3                   inositol-1,4,5-trisphosphate
IPG strip             ready-made Immobiline DryStrip gels
ko                    knock-out
kVh                   kilovolt-hour
LDHB                  L-lactate dehydrogenase B-chain
MALDI-TOF             matrix assisted laser desorption/ionization
                      time-of-flight
MAP kinase            mitogen activated protein kinase
MDHC                  cytosolic malate dehydrogenase

                                                                       9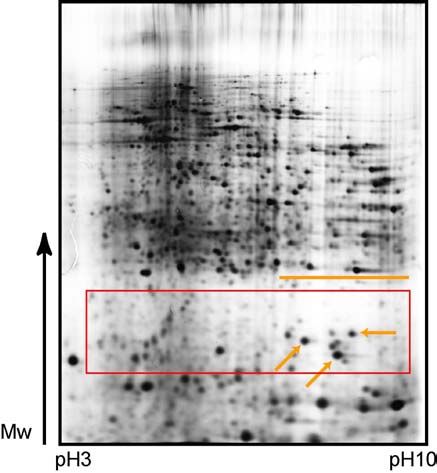
MEK1/MEK2      Raf kinases
mRNA           messenger ribonucleic acid
MS             mass spectrometry
Mw             molecular weight
NACh           nucleic acid conducting channel
NADH           reduced nicotineamide adenine dinucleotide
NADPH          reduced nicotinamide adenine dinucleotide
               phosphate
NC             nitrocellulose
n.c.           negative control
NCoR           nuclear corepressor
NH2 terminus   amino terminus
PBS            phosphate buffered saline
pI             isoelectric point
PIP2           phosphoinositoldiphosphate
PKC            protein kinase C
PLC            phospholipase C
PMF            peptide mass fingerprint
POL II         RNA polymerase II
ppm            parts per million
PTH            parathyroid hormone
RNA            ribonucleic acid
RXR            retinoid acid receptor
SDS-PAGE       sodium dodecylsulfate polyacrylamide gel
               electrophoresis
SELDI          surface enhanced laser desorption/ionization
Shc            steroid hormone coactivator
SMRT           silencing mediator for retinoid and thyroid
               hormone receptors
Src            steroid receptor coactivator
V              volt
VDR            vitamin D receptor
VDRmem         putative vitamin D membrane receptor
VDRB1          vitamin D receptor with extended amino
               terminus
VDRE           vitamin D response elements
TFA            trifluoroacetic acid
TGF-β1         transforming growth factor-β
TNF-α          tumor necrosis factor-α
UV             ultraviolet radiation
wt             wild type

10
1. INTRODUCTION
1.1. Vitamin D
1.1.1. Metabolism
Formation of vitamin D3 from 7-dehydrocholesterol represents the first step
in vitamin D metabolism. The process is taking place in the skin, by
exposure to ultraviolet light. Alternatively, vitamin D, in the form of either
vitamin D2 or vitamin D3 can be derived from dietary sources. The
biologically active form, 1α,25-dihydroxyvitamin D3 (1α,25-(OH)2D3) is
formed in two further activation processes, involving first 25-hydroxylation
in the liver, followed by 1α-hydroxylation in the kidney. The product of the
25-hydroxylation step, 25-OH-D3 is the major circulating form of vitamin D,
due to its strong affinity toward vitamin D binding protein in blood (DBP).
Its further metabolic fate depends on the calcium requirement in the
organism.
Metabolic activation of vitamin D3 is catalysed by specific cytochrome
P-450-containing enzymes, the vitamin D3-25-hydroxylase (CYP27) and
the 25-hydroxyvitamin D-1α-hydroxylase (CYP1α) in the renal proximal
tubular cell, with the later one being tightly regulated by the levels of
plasma 1α,25-(OH)2D3 and calcium (Jones G. et al. 1998). In addition to
its final metabolic activation in kidney, 25-OH-D3 can be also inactivated
by action of the 25-OH-D3-24-hydroxylase (25-OH-D-24-OHase). In early
‘90s, this cytochrome P-450 containing enzyme, CYP24, was cloned and it
was reported that it performs the 24-hydroxylation and subsequent
reactions leading to inactivation of both 1α,25-(OH)2D3 and 25-OH-D3
(Akiyoshi-Shibata M. et al. 1994; Beckman M.J. et al. 1996). The
mechanisms of vitamin D activation and inactivation processes are shown
in Figure 1.
In response to hypocalcaemia, the parathyroid glands, the main calcium
sensing organs in vertebrates, secrete parathyroid hormone (PTH), which
induces 25-hydroxyvitamin D-1α-hydroxylase (Shinki T. et al. 1998.). At
the same time, PTH suppresses 25-OH-D-24-OHase (Shinki T. et al.;
1992.). This leads to further increment in 1α,25-(OH)2D3 plasma level.INTRODUCTION Figure 1. Activation and inactivation steps in vitamin D metabolism. The first step in vitamin D metabolism is conversion of 7-dehydrocholesterol to vitamin D3 under the influence of UV light in the skin. Active form of vitamin D is formed in two subsequent steps, 25-hydroxylation step catalysed by specific vitamin D3-25-hydroxylase (CYP27) in liver, followed by additional hydroxylation step catalysed by 25-hydroxyvitamin D-1α- hydroxylase (CYP1α) in kidneys. Inactivation of both 25-hydroxyvitamin D3 and 1α,25- dihydroxyvitamin D3 is catalysed by the same enzyme, 25-hydroxyvitamin D-24- hydroxylase (CYP24) in kidneys. 12
INTRODUCTION

1.1.2. The role of vitamin D

The major role of vitamin D in the organism is calcium mobilization.
Elevation in 1α,25-(OH)2D3 plasma levels causes increased intestinal
calcium absorption involving calbindin and possible other proteins by so
far unknown mechanisms (Jones G. et al. 1998). At the same time PTH
and 1α,25-(OH)2D3 stimulate bone resorption by promoting differentiation
of osteoclast. This mechanism involves osteoblast mediated activation of
RANK on the osteoclast surface and triggering of several downstream
signalling cascades, which causes osteoclast to resorb bone (Jones G. et
al. 1998; Purroy J. and Spurr N.K. 2002). The action of vitamin D in
stimulating bone resorption is not only to provide bone calcium for the
plasma, but to complete bone-remodelling required for bone shaping and
repairing processes.
    Recently, additional roles of vitamin D have been discovered in various
organs like pancreas, skin, ovaries, parathyroid gland, as well as
mammary epithelium, neuronal tissue, macrophages and T-lymphocytes.
In parathyroid gland, vitamin D suppresses PTH secretion, and in T-
lymphocytes, it suppresses production of TNF-α and interferon-γ by
stimulating production of TGF-β1 and IL-4 (Cantorna M.T. et al. 2000). In
skin, vitamin D induces keratinocyte differentiation. Vitamin D also
influences insulin secretion from the pancreas by raising plasma calcium
concentration (Chertow B.S. et al. 1983). Additionally, studies performed
on vitamin D deficient mice revealed possible vitamin D involvement in
both, male and female fertility (Yoshizawa T. et al. 1997).

1.1.3. Mechanism of action

Vitamin D acts via specific vitamin D receptor(s) (VDR) and elicits two
different kinds of responses, a fast nongenomic response in a time range
of seconds/minutes, and a slower genomic response, which needs hours
or days. The mechanism of genomic action is very well known and it is a
result of vitamin D association with nuclear VDR, which leads to binding to
and activation of the vitamin D response element (VDRE) in various gene
promoter regions. The functional form of nuclear VDR is heterodimer with
retinoid acid receptor (RXR). Binding of this heterodimer to the response
element induces a bend in the DNA of the promoter and interaction with
other transcription factors, which act as coactivators of transcription
(Kimmel-Jehan C. et al. 1999; Kimmel-Jehan C. et al. 1997). Recent
research implied that these coactivator proteins might posses intrinsic
histone acetylase activity (Chen H. et al. 1997). Thus binding of VDR in
promoter region and recruitment of its coactivators, might result in histone
acetylation and subsequent release from DNA. This in turn leads to the
opening of the promoter to the transcriptional machinery (Figure 2).

                                                                          13
INTRODUCTION Except as an activator, VDR may act as a repressor of transcription as well (Figure 2), but the mechanism of repression is less understood. A current model suggests that class II nuclear receptors, to which VDR belongs, form complexes with corepressors when ligand is not present. Therefore, all nuclear hormone-responding genes are initially in repressed state, due to the chromatin condensation (Torchia J. et al. 1998). 14
INTRODUCTION

Figure 2. Vitamin D mediated genomic and nongenomic response. The nongenomic
response is proposed to be mediated via a putative vitamin D membrane receptor
(VDRmem), as well as classical nuclear vitamin D receptor (VDR). In both cases binding of
the 1α,25-(OH)2D3 (presented with a star) results in activation of mitogen activated
protein (MAP) kinases ERK1 and ERK2, which in turn phosphorylate a number of
proteins involved in regulation of processes in nucleus and cytosol. The signal
transduced via membrane receptor(s) can utilize 3 possible mechanisms: membrane
receptors with intrinsic tyrosine kinase activity that can interact with Shc/Grb2/Soc and
then Raf; membrane receptors without intrinsic tyrosine kinase activity, which utilize Src
to phosphorylate Shc that consequently interacts with Grb2/Soc and activates Raf; or
those that activate G-proteins to generate either membrane Ras.GTP or activate PLC to
generate PIP2 and DAG, which is further linked to activation of PKC. Genomic response
on 1α,25-(OH)2D3 can result in either activation or repression of transcription. In both
cases VDR forms homo- or hetero-dimers, the later one usually with retinoic acid receptor
(RXR). After the binding to the vitamin D responsive element (VDRE) in promoter region,
it recruits activation factors, which in turn leads to activation of transcription. The more
detailed explanation can be found in the text. In the case of repression it is suggested
that VDR/RXR heterodimer recruits repressors when 1α,25-(OH)2D3 is not present.
However, it was observed that on some promoters, repressors stay bound even after
binding of 1α,25-(OH)2D3 to its receptor. Shc - steroid hormone coactivator; Src – steroid
receptor coactivator; PLC – phospholipase C; PIP2 – phosphoinositoldiphosphate; DAG –
diacylglycerol; PKC – protein kinase C; IP3 – inositol-1,4,5-trisphosphate; MEK1/MEK2 –
Raf kinases; ERK1/ERK2 – extracellular signal-regulated kinase 1 and 2; POL II – RNA
polymerase II.

   VDR homo- and hetero-dimers were reported to interact with nuclear
corepressor (NCoR), silencing mediator for retinoid and thyroid hormone
receptors (SMRT) and Alien (Tagami T. et al. 1998; Polly P. et al. 2000).
It was shown however, that addition of 1,25-(OH)2D3 causes incomplete
dissociation of repressors from VDR, suggesting that another mechanism
of repression, by which VDR can serve as a downregulator of transcription
might exist (Polly P. et al. 2000).
   Until now, even less is known about mechanisms of nongenomic
response to vitamin D. The nongenomic response is believed to be
mediated via putative vitamin D membrane receptor (VDRmem) (Norman
A.W. et al. 2001). So far, a wide array of rapid responses to 1α,25-
(OH)2D3, including activation of protein kinase C (PKC), activation of MAP
kinases, opening of Ca2+ and Cl- channels in varieties of tissues have
been reported (Zanello L.P. and Norman A.W. 1997; Beno D.W. et al.
1995; Song X. et al. 1998). These rapid actions have been postulated to
regulate cell biologic function and potentially to interact with other
membrane mediated-kinase cascades, or to cross talk with the cell
nucleus to control the genomic responses associated with cell
differentiation and proliferation (Berry D.M. et al. 1996). The suggested
mechanism for the nongenomic response is shown in Figure 2.

                                                                                         15
INTRODUCTION 1.2. Nuclear vitamin D receptor (VDR) The VDR is generally expressed at relatively low levels in vivo, although target tissues, such as bone, kidney, intestine, may have relatively high levels of the receptor in comparison to the other tissues. Like the other nuclear receptors, VDR can be divided into several functional domains as shown in Figure 3. At the NH2 terminus is an A/B domain of ∼20 amino acids, followed by the DNA binding domain comprised of two zinc finger motifs. It was shown that the A/B domain of estrogen, progesterone and glucocorticoid receptors has much longer amino acid sequence and functions as a transcriptional activation domain (Wilson J.D. and Foster D.W. 1992), while its function in VDR is still unknown. The ligand binding domain of the protein is a complex region responsible for high-affinity binding of ligand, for dimerization with RXR, and for binding to the basal transcription machinery (Jones G. et al. 1998). The COOH-terminal portion of the protein, termed the AF-2 domain, has been shown to be critical for transcription. Removal of this domain results in decreased ligand-binding affinity and loss of transcriptional activation, due to inability to interact with other transcription factors. In contrast to many related receptors, VDR is predominantly nuclear already in the ligand-free state and it has to form heterodimers (mostly with RXR) to be able to bind efficiently to its response elements in promoter region. The regulation of transcription is modulated by the subsequent binding of coactivators or corepressors as already described. Recently a new form of VDR, named VDRB1 with an extended N-terminus was reported. It was found to be expressed exclusively in kidney, osteoblasts and intestine and it was characterized by reduced transactivation activity and a ligand-responsive speckled intranuclear localization (Sunn K.L. et al. 2001). Figure 3. Schematic structure of vitamin D receptor. The most important domains are: DNA binding domain (C), ligand binding domain (E) and affinity function domain (AF-2) that is responsible for interaction with cofactors. DNA binding domain contains two zinc finger motifs (N1 and N2), and one phosphorylation site (Ser51). Additional phosphorylation site is at Ser208. Transcriptional factor (TFIIB) binds overlapping the ligand binding domain (D-E1), and at the N-terminal part of the receptor are ~20 amino acids (A/B) with still unknown function. 16
INTRODUCTION

1.3. Vitamin D deficiency

Since vitamin D plays a major role in Ca2+ metabolism and bone mineral
homeostasis, the most prominent feature of vitamin D deficiency, either by
acquired or hereditary defects in the metabolic activation of the vitamin D
to its hormonal form, or in the subsequent functions of the hormone in
target cells, is defect in bone mineralization, characterized by impairment
of skeletal growth in rickets and a number of rachitic syndromes. As
already mentioned, vitamin D might play additional roles in other tissues,
but its precise function there is still unclear.
   Further insights in physiological actions of 1α,25-(OH)2D3 became
possible after generation of vitamin D receptor deficient mice.

1.3.1. Phenotypic characteristics of VDR knock-out mice

Currently, three mouse models with VDR deficiency are available.
Heterozygous mice show no apparent difference in comparison to wild
type (WT) animals. Homozygous mutant mice are normal until weaning,
but then display reduced body weight and growth retardation throughout
life. Severe secondary hyperparathyroidism develops during the growth
phase, accompanied with hypocalcaemia. All animals show histological
signs of rickets and alopecia. No impact was observed on both male and
female fertility, except in case of mice generated by Yoshizawa et al., but
this is believed to be a consequence of genetic background rather than
direct vitamin D involvement (Yoshizawa T. et al. 1997; Kinuta K. et al.
2000; Erben R.G. et al. 2002; Li Y.C. et al. 1997). The consequences of
vitamin D deficiency were also seen in the immune system. Recent
studies showed that production of interleukine 18 (IL-18), which is a Th1-
promoting cytokine was reduced in macrophages from VDR deficient
homozygous mice. In accordance with that, antigen-stimulated spleen
cells from those animals showed an impaired Th-1 response (O’Kelly J. et
al. 2002).
    The impact of vitamin D on development and especially development of
the nervous system was also investigated. Although VDR was expressed
in E11.5 embryos in the neural tube, telencephalon, mesencephalon,
rhombencephalon and spinal nerves as well as in other organs, its
deficiency had no impact on ontogenesis, implying that the absence of
VDR during development can be compensated by other still unknown
factors (Erben R.G. et al. 2002).
    At least some of the described effects of VDR deficiency are shown to
be caused by hypocalcaemia rather than receptor deficiency itself, and
could be corrected by rescue diet enriched with calcium. This diet
normalized growth and prevented the development of rickets and
parathyroydism, but not alopecia (Li Y.C. et al. 1998).

                                                                         17
INTRODUCTION It was already mentioned that vitamin D invokes rapid, nongenomic responses, probably via a putative membrane receptor that differs from the classical nuclear VDR. Recent studies performed on mice, in which deoxyribonucleic acid (DNA) binding domain of VDR was partially deleted, thus disabling DNA binding but maintaining receptor expression and ligand binding, revealed impairment in both genomic and nongenomic functions, despite a presumably intact VDRmem. The rapid response to 1α,25- (OH)2D3 was completely absent in osteoblasts from those mice, as well as responses in skin, bone, intestine, parathyroid glands and kidney, implying that vitamin D signalling pathways other than those mediated through the classical nuclear receptor are of minor physiological importance (Erben R.G. et al. 2002). 1.3.1.1. Impact of VDR deficiency on renal tubular calcium reabsorption In accordance with previous findings that vitamin D facilitates renal calcium reabsorption, recent studies on VDR knock-out mice given the Ca2+ reach rescue diet, confirmed increased Ca2+ excretion in the urine (Erben R.G. et al. 2002). One of the possible mechanisms by which 1,25- (OH)2D3 can execute this stimulatory action may involve induction of the intracellular calcium-binding proteins calbindin D9k and calbindin D28k (Bouhtiauy I. et al. 1994a and 1994b). In the kidney of VDR deficient mice, the mRNA levels of calbindin D9k were found to be strongly downregulated, while those of calbindin D28k were only moderately decreased or unchanged (Yoshizawa T. et al. 1997; Van Cromphaut S.J. et al. 2001; Li Y.C. et al. 1997). Furthermore, the recently cloned and characterized apical epithelial calcium channels (EcaC-1 and –2) may also play an important role in vitamin D renal calcium absorption, since its mRNA and protein levels were shown to be decreased in the kidney of vitamin D-deficient rats (Hoenderop J.G. et al. 2002). However, recent data published by Van Cromphaut et al. and Erben et al. showed the involvement of EcaC-1 and -2 in renal calcium reabsorption to be unlikely, since its levels were either unchanged in VDR deficient animals or corrected by a rescue diet. Furthermore, the observed changes in mRNA levels of calbindin D9k and calbindin D28k in VDR deficient mice, fed with either normal or rescue diet (Erben R.G. et al. 2002), can not explain efficiently the molecular defect of the renal calcium reabsorption. 18
INTRODUCTION

1.4. Aim of the study

From the data presented in the previous chapters it is clear that vitamin D
exhibits complex actions in various tissues, either directly, influencing
genomic and nongenomic responses, or indirectly via regulation of Ca2+
homeostasis. It acts via VDR that is able to form complexes with variety of
transcription factors, which in turn modulate different signalling pathways.
   The main vitamin D-responsive tissues are bone, kidney, and intestine.
They are involved in Ca2+ mobilization and absorption. Until now, a little is
known about exact mechanisms and proteins involved in triggering those
events, especially in case of renal calcium reabsorption. Although, based
on the present data, calbindin D9k represents a possible candidate
involved in this process, further studies are necessary to support those
findings.
   In this study, changes in kidney proteome (the expressed protein
complement of a genome) were investigated by 2-dimensional
electrophoresis (2-D electrophoresis) of mice in which the DNA binding
domain of VDR was partially deleted but the truncated receptor was
expressed and could bind the ligand (Erben R.G. et al. 2002).
   Proteome analysis should be particularly suited to characterize the
molecular mechanism of rapid, nongenomic actions of vitamin D, which
would escape classical mRNA-based approaches, as it is, e.g., able to
identify changes in protein phosphorylation that underlie many rapid
intracellular signalling pathways. At the same time, fluctuations at the
message level that are not represented at the translated protein level will
be filtered out, providing a more specific picture of vitamin D-related
changes than mere genomic techniques.
   The focus was on kidney as a first target, not only because large
samples of sufficiently homogenous tissue were readily available to
optimize the technical parameters (various for each tissue), but also
because in this tissue rapid, nongenomic vitamin D responses are
supposed to play a prominent role. This approach should give a better
insight into mechanisms that are underlying the pathologically relevant
aspects of vitamin D action in kidney.

                                                                           19
2. RESULTS Two-dimensional electrophoresis (2-D electrophoresis) was used to investigate changes in the kidney proteome of vitamin D receptor (VDR) knock-out mice. In order to achieve an optimised protocol for our study, it was necessary to optimize the complex 2-D electrophoresis technique, including several modifications in protein sample preparation, and as well in the second dimension separation (sodium dodecyl sulphate polyacrylamide gel electrophoresis; SDS-PAGE). After separation it was possible to identify a number of differentially expressed proteins by matrix assisted laser desorption/ionization time–of-flight (MALDI-TOF) mass spectrometry (MS). Many of these genes were related to cellular energy metabolism and are remarkably downregulated in VDR knock-out mice. 2.1. Two-dimensional electrophoresis Vitamin D receptor knock-out mice, as already mentioned, have ablated genomic and nongenomic actions of vitamin D in the organism (Erben R.G. et al. 2002). Considering the fact that vitamin D affects many different pathways in different cells of the organism, changes in the expression level of many proteins involved in these actions were expected. Therefore, the 2-D electrophoresis method was used, since it enables screening of large number of proteins at the same time and studying of differential protein expression. 2.1.1. Isoelectric focusing Considering the high susceptibility of the isoelectric focusing (IEF) method to the amount of protein applied on the Immobiline DryStrip (IPG Strip), it was important to know the protein concentration of the sample. Therefore, colorimetric assay based on copper ions and Folin-Ciocalteu’s phenol reagent for phenolic groups, was used. According to the average concentration (see Appendix), all kidney protein isolates were diluted in lysis buffer to a final concentration of 10mg/ml of total proteins.
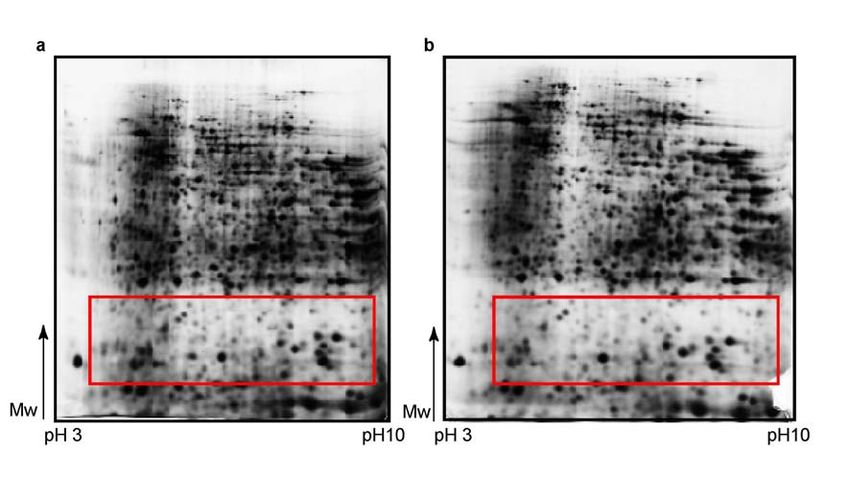
RESULTS

2.1.2. SDS-polyacrylamide gel electrophoresis

In contrast to the IEF, whose protocol was easily established, the second
dimension separation (SDS-PAGE) required several optimisation steps to
achieve reliable results.
   Although protein separation on the gel was good, first results brought in
question the problem of proteolysis in lower molecular weight (Mw) region
that influenced accuracy of results. Red box on Figure 4a indicate the
region with huge number of small protein spots with low Mw that pointed to
the sample proteolysis. Better results couldn’t be achieved even after
inclusion of proteinase inhibitor Pefabloc in lysis buffer during protein
isolation (Figure 4b). Again red box indicates the same area on the gel,
where no reduction in proteolysis level can be seen. Therefore, protein
isolation protocol was changed. First step was homogenisation of the
frozen kidneys in solution of proteinase inhibitor cocktail in water, and
lyophilization over the night. The next day lyophilised tissue was
resuspended in lysis buffer and ultracentrifuged to remove DNA, salts and
other interfering components. In that way proteolysis was reduced, and
good protein separation on the gels (Figure 5a and 5b) was not disturbed.

Figure 4. Analysis of wild type mice kidney proteome by 2-D electrophoresis. First
dimension has been done on a wide pH range (pH 3-10), at 180mm - separation
distance, and sample application made by in-gel rehydration. Isoelectric focusing (IEF)
was done up to 36 kVh. Second dimension was vertical SDS-PAGE on 12%
polyacrylamide gel. Proteins were visualized by silver staining. Samples were prepared: a
–without proteinase inhibitor; b – with 10 mM Pefabloc proteinase inhibitor included in
lysis buffer. Red marked boxes indicate low molecular weight regions with prominent
proteolysis.

22
RESULTS

Figure 5. Analysis of wild type mice kidney proteome by 2-D electrophoresis. First
dimension has been done on a wide pH range (pH 3-10), at separation distance of 180
mm. Sample application was made by in-gel rehydration and IEF was done up to 41 kVh.
Second dimension was vertical SDS-PAGE on 12% polyacrylamide gel. Proteins were
visualized by silver staining. a and b – proteinase inhibitor cocktail, used in the first step
of protein isolation, and lyophylization step, reduced the level of sample proteolysis that
can be noticed in the reduced number of small blur protein spots in red box’s marked
area on the gels, compared to Figure 4.

   Still, the problem of protein diffusion in the protein spots on the gels,
during SDS-PAGE, was present. It was necessary to focus spots better in
order to enlarge the amount of protein in the protein spot, so that more
sample would be available for further analysis on MALDI-TOF MS. The
subsequent set of experiments was done with following modifications: in
current (mA) or voltage (V) used for run, temperature of gel holders
(cooling of the cores), and temperature at which run was done (room
temperature or in the cold room).
1) First run was done at constant voltage (80V), in the cold room (+4°C),
without additional cooling, but the time acquired to complete the run was
too long (24:15 hrs), so protein diffusion was still strong. Arrows on the
Figure 6a are pointing on the protein spots with emphasized protein
diffusion.
2) At constant current (20 mA/gel), in the cold room, without additional
cooling, focusing was better, but the “smile”-effect appeared on the gels.
Orange lines on the Figure 6b show the distortion of protein pattern
(“smile”-effect) that reduced reproducibility and made the comparison of
results impossible.

                                                                                           23
RESULTS 3) When cooling (+4°C) of the gel holders was included, but electrophoresis run was done at room temperature, at constant current (40mA/gel), it was expected that buffer ions mobility would not be impaired, although gels are cold. Surprisingly, results were even worse, showing the strong “smile”-effect, which is marked on Figure 6c. 4) The same conditions (cooling of the cores at +4°C; room temperature run) were repeated, but this time with lower current, only 20 mA/gel. Still, the “smile”-effect was strong in higher pH range (Figure 6d). 5) Combination of the last two conditions (3 and 4), showed that 40 mA/gel in the cold room with additional cooling of the cores to +4°C, could not improve focusing and caused bad pattern reproducibility, due to distortions in protein migration over the whole pH range (Figure 6e). 6) Therefore, constant voltage instead of constant current was applied, and the run was carried out in the cold room, together with cooling of the cores (+4°C), first at 250V for 5 hours, and then it was completed at 300V for 1 hour. It was now easier to compare the gels, but the constant “smile”- effect, present in high pH range, was not removed (Figure 6f). 7) The last introduced modifications were constant voltage during the whole run (100V), carried on room temperature, with cooling of the gel holders at +15°C. In this way, duration of the run was reduced and protein diffusion avoided. Arrows on the Figure 7 are pointing at the protein spots that are not blurred anymore, and orange lines stress the disappearance of “smile”-effect, due to low voltage applied. Since proteolysis was not aggrevated by these modifications (Figure 7, red box), these parameters were applied for all following experiments. Figure 6. Set of 2-D electrophoresis gels with differentially modified second dimension SDS-PAGE. For all gels, first dimension was done at high pH range (pH 3- 10) at separation distance of 180 mm, and sample application was made by in-gel rehydration. IEF was done up to ~40 kVh. Second dimension was vertical SDS-PAGE at 12% polyacrylamide gel, and proteins were visualized by silver staining. Figures a-f represent different modifications used in the experiment. The run was done a – with constant voltage (80V) applied in the cold room (4°C). Arrows are pointing on strong protein diffusion in the protein spots; b – with constant current (20mA/gel), applied in the cold room (4°C). Lines are indicating distortions in the protein pattern; c – with constant current (40mA/gel) applied at room temperature, with cooling of gel holders (4°C). Note even stronger distortions on the gel. The gel was scanned after the excision of test protein spots; d – with applying lower current (20mA/gel) at room temperature, without cooling of the cores. Note that distortions remained in the very low and high pH range areas, marked by orange lines; e – with constant current (40 mA/gel), in the cold room, and with cooling of the gel holders (4°C). “Smile”-effect is visible through the whole pH range; f – with constant voltage (250V) for 5 hours that was then switched to 300V for an additional hour. The entire run was carried on in the cold room and has included the cooling of gel holders (4°C). Note that no improvement in the results could be observed. 24
RESULTS

     25
RESULTS
Figure 7. 2-D electrophoresis gel with reduced proteolysis and protein diffusion.
First dimension separation was done on a wide pH range (pH 3-10), at separation
distance of 180 mm, with sample application made by in-gel rehydration. IEF was done
up to 37 kVh. Second dimension was vertical SDS-PAGE on 12% polyacrylamide gel,
and proteins were visualized by silver staining. Running conditions were: constant voltage
(100V), applied at room temperature, with cooling of the gel holders at 15°C. Red box
indicates reduced proteolysis in low Mw region of the gel and arrows are pointing on spots
with lowered protein diffusion. There is no distortion in protein pattern on the gel, which
can be especially noticed in higher pH range (stressed with orange line).
2.1.3. PDQuest software analysis of 2-D electrophoresis gels
To ensure that differential expression is not due to biological noise, many
samples for each condition were analysed. Kidneys were isolated from 5
wild type, and 5 VDR knock-out mice and each sample was analysed
separately, in triplicates, by 2-dimensional electrophoresis. Beside
genomic difference between animals of the same type, this approach also
excluded slight changes due to experimental procedure.
Using 2-D electrophoresis analysis software (PDQuest, BioRad) the
original gel scan was filtered and smoothened to clarify the spots. The
background was substracted and spots were automatically identified by
creating the gaussian spots from the clarified spots, with help of “Spot
Detection Wizard”. A gaussian spot is a precise three-dimensional
representation of an original scanned spot, where gaussian curves are
fitted to the scanned spot in the x and y dimension.
26RESULTS
All separately processed gels of the wild type (Figure 8a and 8b), or
knock-out samples (Figure 9a and 9b), were combined in a matchset gel,
respectively (Figure 8c and 9c). A matchset gel is an abstract, higher
level gel, which presents combination of two or more gels showing equal
protein spots or differentially expressed protein spots. In this study a
matchset of all wild type samples, and a matchset of all knock-out
samples, were compared on the higher level, and differentially expressed
proteins were identified.
Figures 8a and 8b are showing 2-D electrophoresis gels of two
independent kidney samples from wild type mice. Both of them have
proteins separated in a wide pH range (pH 3-10) and protein pattern
doesn’t show significant difference, as it was expected. Blue triangles on
the figures mark some of equally expressed proteins that are used as
landmarks in PDQuest analysis. According to these spots gels were
overlaid, and small differences caused by gel shrinking or twisting, during
the experimental work, were overcame. Usually, the number of landmarks
per gel is about 10% of total number of protein spots on the gel. After
setting the landmarks, all spots were automatically matched and
corrections, when necessary, were done manually.
Green squares, marked with numbers 1 and 2 (Figures 8 and 9),
represent positive control spots that were chosen according to the SWISS-
2D polyacrylamide gel electrophoresis map of human kidney
(http://www.expasy.ch/cgi-bin/map2/def?KIDNEY_HUMAN). These two
proteins were highly expressed and showed no difference in expression
between wild type and VDR knock-out mice. Red circles, numbered 3-9,
mark protein spots that were chosen for further analysis.
On Figure 9 2-D electrophoresis gels of two independent kidney
samples from VDR knock-out mice are shown. The analysis of gels and
combining in a matchset was done in the same way as for wild type
samples. Again, the landmarks are marked by blue triangles, positive
control with green squares (numbers 1 and 2), and differentially expressed
proteins with red circles, numbered 3-9.
Figures 8c and 9c present matchsets that contain equal protein spots,
of wild type and VDR knock-out samples, respectively. When comparing
gels in a matchset, there are often some variations in spot size and
intensity signal between gels that is not due to differential protein
expression. These nonexpression-related variations in spot intensity can
be compensated by normalization. The normalization was performed
according to the method specified by PDQuest software, where the raw
quantity of each spot (intensity of each spot) in a member gel was divided
by the total quantity of the valid spots in the gel.
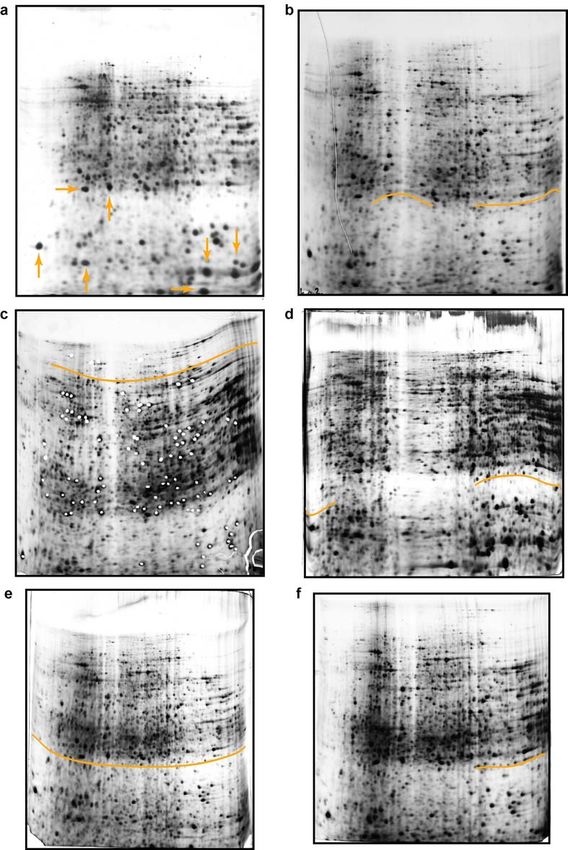
27RESULTS Figure 8. PDQuest analysis of wild type 2-D electrophoresis gels. a and b are filtered images of two independent gels made on a wide pH range separation (pH 3-10), at separation distance of 180 mm, and IEF up to 37 kVh. Second dimension was vertical SDS-PAGE on 12% polyacrylamide gel, which were then stained with silver. c represents a matchset image of wild type gels with equal protein spots. Marked by blue triangles are landmark spots with the same level of expression on both, wild type and VDR knock out gels. Green squares, numbered 1 and 2, designate protein spots taken as a positive control, and red circles with numbers 3-9, mark differentially expressed proteins, taken for MALDI-TOF MS identification. Red cross shows the position at which protein 7 was shifted in some gels (see text for details). 28
RESULTS

Figure 9. PDQuest analysis of knock-out 2-D electrophoresis gels. Filtered images of
two independent gels are presented in a and b. First dimension separation was done on
a wide pH range (pH 3-10), at 180 mm separation distance, with IEF up to 37 kVh.
Second dimension was vertical SDS-PAGE on 12% polyacrylamide gel, and visualization
of protein spots was done by silver staining. c is a matchset of VDR knock-out gels, made
of equal protein spots. Blue triangles mark landmark spots, green squares (1 and 2)
emphasize positive control protein spots, and with red circles (numbers 3-9) differentially
expressed proteins (compared to the wild type gels) are marked. Red cross designate
position where protein 7 was expressed in wild type gels presented in Figure 8.

                                                                                        29
RESULTS After comparison of wild type and VDR knock out matchsets, there were many proteins identified as differentially expressed. Even after the normalization was done, some of the differentially expressed proteins were found to be false positives, due to the method reproducibility, which was never 100%. To confirm these findings, each protein spot was checked also by visual comparison of all gels, on each gel separately (15 wild type – gels and 15 VDR knock-out – gels). In the end, 7 proteins (Figures 8 and 9, numbers 3-9), that showed differential expression both on matchset gels and on separate gels, were taken for further analysis by mass spectrometry. Protein 3 was highly expressed in almost all wild type samples. Only in 3 gels the expression level was a bit lower. In 8 of 15 VDR knock-out gels, the expression of the same protein was downregulated three times or more, while in the remaining 7 gels, it was downregulated more than two- fold. Protein number 4 showed at least three times lower expression in all VDR knock-out gels when compared to the wild type gels. In case of protein spot 5, there was not such a big difference noticed, but it was about two times downregulated in all VDR knock-out samples examined, in comparison to high expression in all wild type samples analysed. Number 6 was equally expressed in all wild type samples, while in 11 of 15 VDR knock-out gels the expression level was two times lower, and in the remaining 4 of 15 gels around three times lower, in comparison to the wild type. Protein number 7 had unexpected pattern, that differed from gel to gel, no matter if wild type or a VDR knock-out sample was analysed. In 5 wild type gels, the protein spot showed normal expression, while in 9 gels it was not visible at all. In one case, it was present, but shifted to a higher pH region. On the other hand, in 5 VDR knock-out gels the expression was the same as in wild type samples. In 3 gels, the expression level was two times lower, and in 6 gels it was not present at all. Similar to the wild type, in 1 VDR knock-out gel the expressed protein was shifted to a higher pH, to the same position as on the wild type gel. A shift might be caused by a posttranslational modification or due to irregularities in the sample preparation. This pattern can be seen on Figures 8 and 9. In both wild type gels, presented on Figures 8a and 8b, the protein spot can be observed at the same position (red circle, number 7), and the position to which it was shifted is marked by red cross. On the contrary, first VDR knock-out gel (Figure 9a) shows shifted position of the protein (red circle, number 7), while on the second gel (Figure 9b) it was not present at all. Surprisingly, in the matchset gel (Figure 9c), the spot was present. This was due to the creation of the matchset with equal protein spots, where all spots from many gels are combined in one matchset. Therefore, it was of high importance to check each gel separately, to exclude the false positives. Considering the interesting and unusual pattern, this protein was also taken for further analysis. 30
RESULTS

   Both protein spot 8 and 9 were showing high expression in all wild type
gels examined. Number 8 expression was two times lower in all VDR
knock-out gels, while number 9 showed only two times downregulation in
10 gels, out of 15, and more than three times downregulation in rest of the
gels. Unfortunately, neither protein 8, nor protein 9, could be identified,
due to insufficient amount of peptides, after the in-gel digestion of proteins
from the protein spot.

                         Downregulation level (n-fold)
        Protein     3       4       5      6        7        8      9
          ko1      >2x     ~3x    ~2x     ~2x     n.p.     ~2x     ~2x
          ko1      >2x     ~3x    ~2x     ~2x     n.d.     ~2x     ~2x
          ko1      >2x     ~3x    ~2x     ~2x     n.d.     ~2x     ~2x
          ko2      >3x     ~3x    ~2x     ~3x     ~2x      ~2x     >3x
          ko2      >3x     ~3x    ~2x     ~3x     n.p.     ~2x     >3x
          ko2      >3x     ~3x    ~2x     ~3x     n.p.     ~2x     >3x
          ko3      >3x     ~3x    ~2x     ~2x     n.d.     ~2x     ~2x
          ko3      >3x     ~3x    ~2x     ~2x     ~2x      ~2x     ~2x
          ko3      >3x     ~3x    ~2x     ~3x     ~2x      ~2x     >3x
          ko4      >2x     ~3x    ~2x     ~2x     n.p.     ~2x     >3x
          ko4      >3x     ~3x    ~2x     ~2x     n.p.     ~2x     ~2x
          ko4      >2x     ~3x    ~2x     ~2x     n.p.     ~2x     ~2x
          ko5      >2x     ~3x    ~2x     ~2x     n.d.     ~2x     ~2x
          ko5      >2x     ~3x    ~2x     ~2x     n.d.     ~2x     ~2x
          ko5      >3x     ~3x    ~2x     ~2x    shifted   ~2x     ~2x

Table 1. List of proteins that were differentially expressed in the VDR knock-out
kidney samples. Proteins are designated by the same numbers as on both matchset
and separate gels. Downregulation level is expressed in n-fold, relative to the wild type
samples analysed. In the case of protein number 7, where some irregularities in
expression pattern were observed (see text for more details), additional symbols are
used: n.p. for protein not present at all, n.d. for protein not downregulated in comparison
to the wild type gels, and “shifted” for a shift of the protein to a higher pH region. ko1-ko5
are VDR knock-out kidney samples that were analysed in triplicates by 2-D
electrophoresis.

                                                                                           31
RESULTS 2.1.4. 2-D electrophoresis in a narrow pH range Selected proteins were additionally tested on so called “zoom-in” gels, where protein separation was done in a narrow pH range. The isoelectric focusing was done in two different overlapping pH ranges. The first one was pH 4-7 (Figure 10), and the second one pH 6-9 (Figure 11), while the second dimension separation (SDS-PAGE) was done in the same way as for pH range 3-10. Compared at Figure 10 are two representative gels, wild type (Figure 10a) and VDR knock-out (Figure 10b). Again, differentially expressed proteins taken for further analysis, are marked by red circles and designated by the same numbers as on Figures 8 and 9. Small blue square in high molecular weight region of the VDR knock-out gel (Figure 10b) represents the small region of the “clear gel”, containing no protein spots, that was taken as a negative control for MALDI-TOF MS analysis. Often, there are impurities in the gel that can interfere with peptide analysis in mass spectrometry and with protein identification in the database. Therefore, a “clear gel” section was processed the same way as the protein samples, and its spectrum was used to exclude false positives. On Figure 11, two gels are presented with pH 6-9 separation range, showing two spots already identified at broad pH range separation experiment, that are marked again by the same numbers. 32
RESULTS
Figure 10. “Zoom-in” 2-D electrophoresis gels of wild type (a) and VDR knock-out (b)
kidney proteome, that are separated at narrow isoelectric focusing range (pH 4-7), but on
wide separation distance (180 mm), with 47 kVh in total. Red circles emphasize the same
differentially expressed proteins, as identified on wide pH range (Figures 8 and 9),
designated by the same numbers. Blue square at figure b marks small piece of gel
without any protein spots, that was taken as a negative control for MALDI-TOF MS
analysis.
Figure 11. “Zoom-in” 2-D electrophoresis gels at narrow pH range (6-9), with wide
separation distance (180 mm), of wild type (a) and VDR knock-out (b) kidney proteome.
Isoelectric focusing was done up to 47 kVh and second dimension separation was
vertical SDS-PAGE at 12% polyacrylamide gel. Two differentially expressed proteins (3
and 6), marked by red circles, have confirmed the results achieved on a wide pH range
(pH 3-10), seen at Figures 8 and 9.
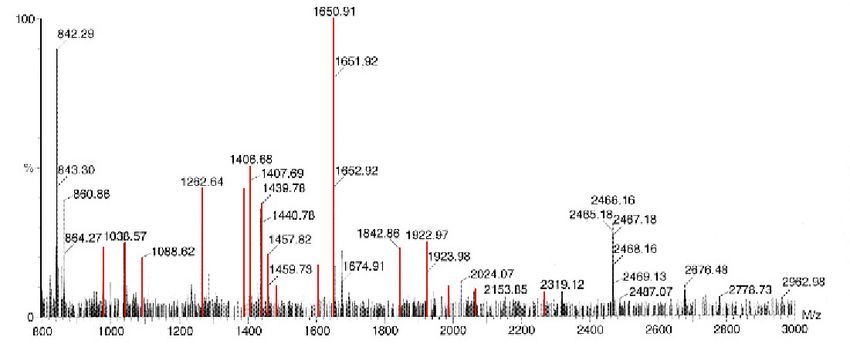
33RESULTS 2.2. Protein identification 2.2.1. Visualization After PDQuest analysis of all gels, differentially expressed proteins were cut from the gels and peptides were isolated by in-gel digestion. Before further analysis by MALDI-TOF MS was done, the system sensibility was checked by applying different molecular weight markers in specified concentrations. They were separated on polyacrylamide gel, stained with Coomassie Blue (Figure 12) and peptides were isolated by the same in-gel digestion method as it was done for 2-D electrophoresis proteins. Identification was successful for different markers, applied in different amount of peptides, by MALDI-TOF MS analysis. In case of albumin (45 kDa protein), bovine serum albumin (66 kDa) and alcohol dehydrogenase (150 kDa), 30 ng was enough for identification, while for β-amylase (20 kDa) approximately 600 ng was the lowest amount of protein that could be identified. Figure 12. PAGE of different molecular weight protein markers. Each sample was applied in three different amounts, 100 ng, 500 ng and 1 µg, respectively. Separation was done at 10% polyacrylamide gel and proteins were visualized by Coomassie stain. A - bovine serum albumin; B - carboanhydrase; C - albumin; D - alcohol dehydrogenase; E - β-amylase; F – apoferritin; G - thyroglobulin. When first test sample, cut out from silver stained gel, was analysed, spectrum revealed no peaks that could be matched to the peptides in the database (Figure 13). Only peaks coming from matrix (M/z 845,17; 863,74), trypsin (M/z 1033,00; 1045,00; 2211,96) and adenocorticotropic hormone, used as an internal standard (ACTH; M/z 2465,13), were achieved. Although MALDI-TOF is considered to be a “soft” ionisation technique, there are often some peaks coming from double charged ions, as it is the peak at M/z 1279,46 that is ACTH-double charged peak, present in almost all spectra. 34
RESULTS

Another peak (M/z ~1074) was showing up in many samples, even in the
negative control spectrum (Figure 15c), which could be coming from
some impurities in the gel, or chemicals used in sample preparation, for
example trifluoroacetic acid.
   Silver staining was used for visualization of the protein spots on the gel
because Coomassie staining method was not sensitive enough (Figure
14). The detection limit between 1 and 10 ng for silver staining was much
better applicable for 2-D electrophoresis, compared to the 50 to 100 ng for
the Coomassie staining. The additional advantage of silver staining, in
contrast to staining by dyes, is that it does not act by binding to the
protein, and therefore decreases the number of necessary washing steps
(Rabilloud T. 1990).
   But the main disadvantages are that a very good visible spot on the gel
does not guarantee sufficient amounts of peptides for the analysis, and
that the silver staining technique includes protein treatment with a strong
oxidizing agent that leads to oxidative attack on the protein and can cause
chemical modifications or destruction. To avoid that, the silver nitrate
treatment was performed at 4°C in order to minimize oxidation reactions
(Shevchenko et al. 1996) and the sensitization treatment with sodium
thiosulfate, necessary to obtain completely transparent gel background,
was used, and it was found to be harmless toward protein molecules.

Figure 13. Reflectron MALDI-TOF MS spectrum of test protein spot. Peptides were
obtained by in-gel digestion of the spot cut from a wild type gel. Presented spectrum is in
range M/z 800-3000 and peak intensities are relative to the strongest signal present.
Marked in green are peaks that correspond to matrix (M/z 845,17; 863,74), trypsin (M/z
1033,00; 1045,00; 2211,96), ACTH (M/z 2465,13; 1279,46) and one peak, present
probably due to impurities (M/z 1074,76).

                                                                                        35
RESULTS Figure 14. 2-D electrophoresis gel of a wild type mouse kidney proteome. First dimension separation was done in a wide pH range (pH 3-10), at separation distance 180 mm, with IEF up to 26 kVh. Second dimension separation was vertical SDS-PAGE on a 12% polyacrylamide gel, and visualization of proteins was done by Coomassie stain. Only a few spots are visible on the gel due to the insufficient Coomassie stain sensitivity. 2.2.2. MALDI-TOF mass spectrometry In peptide mass fingerprint (PMF) analysis, as it was used here, a group of experimentally obtained peptide masses are compared to theoretical mass fingerprints of protein sequences available in databases. As a consequence, this type of analysis strongly depends upon the availability of the protein sequence in the database. Especially when working with proteins originating from species of which only a limited amount of genomic sequence data is available, as it is the case for most mammalian organisms, the success rate of this approach can be rather low. Beside that, detection sensitivity in MALDI-TOF MS is limited not only by the absolute analyte quantity available, but also by chemical noise, which derives from sample contaminants. This can be seen also in Figure 17, where strong background noise is present, so it is hard to distinguish between peptide peaks and contaminants. Therefore, the best signal-to- noise ratio was obtained when only a portion of the spot at the center of staining intensity, where the analyte-to-background ration is the highest, was used for analysis. Also, to increase the amount of peptides, the same spots were cut from three separate gels and all three were combined together in one trypsin digest. 36
You can also read