ESTIMATING INFECTIOUSNESS THROUGHOUT SARS-COV-2 INFECTION COURSE - SCIENCE
←
→
Page content transcription
If your browser does not render page correctly, please read the page content below
RESEARCH ARTICLES

                                                                                                                         Cite as: T. C. Jones et al., Science
                                                                                                                          10.1126/science.abi5273 (2021).

Estimating infectiousness throughout
SARS-CoV-2 infection course
Terry C. Jones1,2,3†, Guido Biele4,5†, Barbara Mühlemann1,2, Talitha Veith1,2, Julia Schneider1,2,
Jörn Beheim-Schwarzbach1, Tobias Bleicker1, Julia Tesch1, Marie Luisa Schmidt1, Leif Erik Sander6,
Florian Kurth6,7, Peter Menzel8, Rolf Schwarzer8, Marta Zuchowski8, Jörg Hofmann8,
Andi Krumbholz9,10, Angela Stein8, Anke Edelmann8, Victor Max Corman1,2, Christian Drosten1,2*
1
Institute of Virology, Charité-Universitätsmedizin Berlin, corporate member of Freie Universität Berlin, Humboldt-Universität zu Berlin, and Berlin Institute of
Health, 10117 Berlin, Germany. 2German Centre for Infection Research (DZIF), partner site Charité, 10117 Berlin, Germany. 3Centre for Pathogen Evolution,
Department of Zoology, University of Cambridge, Cambridge CB2 3EJ, UK. 4Norwegian Institute of Public Health, 0473 Oslo, Norway. 5University of Oslo, 0315
Oslo, Norway. 6Department of Infectious Diseases and Respiratory Medicine, Charité–Universitätsmedizin Berlin, corporate member of Freie Universität Berlin and

                                                                                                                                                                   Downloaded from http://science.sciencemag.org/ on August 13, 2021
Humboldt-Universität zu Berlin, 10117 Berlin, Germany. 7Department of Tropical Medicine, Bernhard Nocht Institute for Tropical Medicine, and Department of
Medicine I, University Medical Centre Hamburg-Eppendorf, 20359 Hamburg, Germany. 8Labor Berlin–Charité Vivantes GmbH, Sylter Straße 2, 13353 Berlin,
Germany. 9Institute for Infection Medicine, Christian-Albrechts-Universität zu Kiel and University Medical Center Schleswig-Holstein, Campus Kiel, 24105 Kiel,
Germany. 10Labor Dr. Krause und Kollegen MVZ GmbH, 24106 Kiel, Germany.
†These authors contributed equally to this work.
*Corresponding author. Email: christian.drosten@charite.de

Two elementary parameters for quantifying viral infection and shedding are viral load and whether samples
yield a replicating virus isolate in cell culture. We examined 25,381 German SARS-CoV-2 cases, including
6110 from test centres attended by pre-symptomatic, asymptomatic, and mildly-symptomatic (PAMS)
subjects, 9519 who were hospitalised, and 1533 B.1.1.7 lineage infections. The youngest had mean log10
viral load 0.5 (or less) lower than older subjects and an estimated ~78% of the peak cell culture replication
probability, due in part to smaller swab sizes and unlikely to be clinically relevant. Viral loads above 109
copies per swab were found in 8% of subjects, one-third of whom were PAMS, with mean age 37.6. We
estimate 4.3 days from onset of shedding to peak viral load (8.1) and cell culture isolation probability
(0.75). B.1.1.7 subjects had mean log10 viral load 1.05 higher than non-B.1.1.7, with estimated cell culture
replication probability 2.6 times higher.

Respiratory disease transmission is highly context depend-                        tiousness, timing of loss of infectiousness, rates of infec-
ent and difficult to quantify or predict at the individual lev-                   tiousness increase and decrease, and how these relate to
el. This is especially the case when transmission from pre-                       onset of symptoms (when present), and 3) differences in
symptomatic, asymptomatic, and mildly-symptomatic                                 infectiousness due to inherent properties of virus variants.
(PAMS) subjects is frequent, as with SARS-CoV-2 (1–8).                                These interrelated issues can all be addressed via the
Transmission is therefore typically inferred from popula-                         combined study of two clinical virological parameters: the
tion-level information and summarized as a single overall                         viral load (viral RNA concentration) in patient samples and
average, known as the basic reproductive number, R0.                              virus isolation success in cell culture trials. While viral load
While R0 is an essential and critical parameter for under-                        and cell culture infectivity cannot be translated directly to
standing and managing population-level disease dynamics,                          in vivo infectiousness, and the impact of social context and
it is a resultant, downstream characterisation of transmis-                       behavior on transmission is very high, these quantifiable
sion. With regard to SARS-CoV-2, many finer-grained up-                           parameters can generally be expected to be those most
stream questions regarding infectiousness remain                                  closely associated with transmission likelihood. A strong
unresolved or unaddressed. Three categories of uncertainty                        relationship between SARS-CoV-2 viral load and transmis-
are 1) differences in infectiousness among individuals or                         sion has been reported (9), comparing favorably with the
groups such as PAMS subjects, according to age, gender,                           situation with influenza virus, where the association is less
vaccination status, etc., 2) timing and degree of peak infec-                     clear (10, 11).

First release: 25 May 2021                                          www.sciencemag.org               (Page numbers not final at time of first release) 1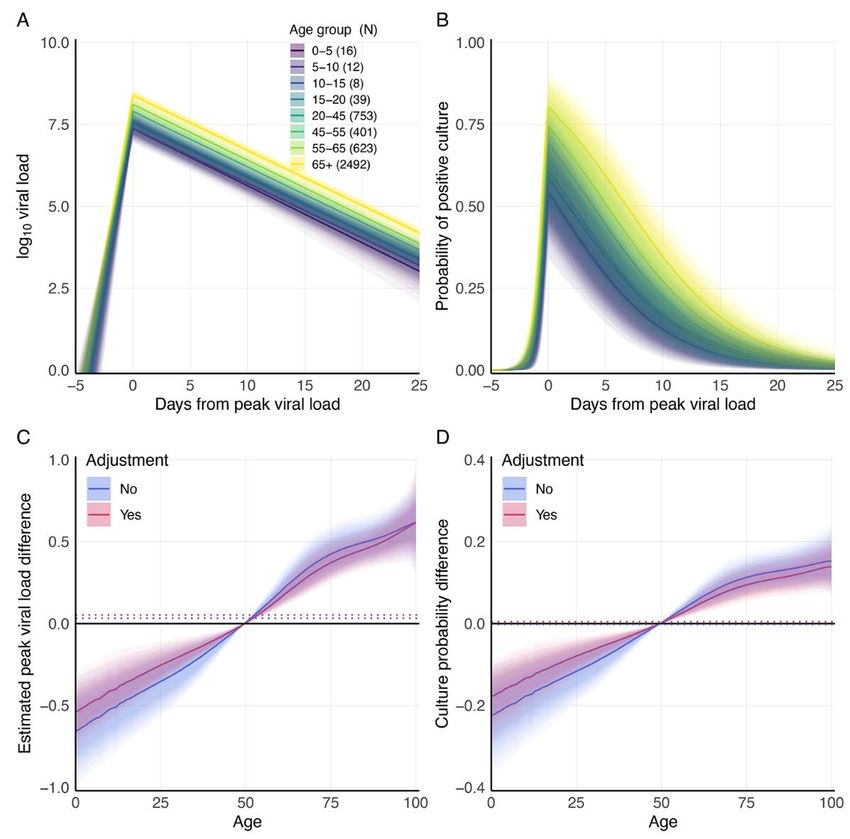
The emergence of more transmissible SARS-CoV-2 vari-         PCR results from 415,935 subjects aged 0-100 years from
ants, such as the B.1.1.7 lineage (UK variant of concern,         February 24, 2020 to April 2, 2021. Samples were collected
202012/01), emphasizes the importance of correlates of            at test centres and medical practices mostly in and around
shedding and transmission. The scarcity of viral load data in     Berlin, Germany, and analyzed with LightCycler 480 and
those with recent variants and PAMS subjects of all ages          cobas 6800/8800 systems from Roche. Of all tested subjects,
(12) is a blind spot of key importance because many out-          25,381 (6.1%) had at least one positive RT-PCR test (Table 1).
breaks have clearly been triggered and fuelled by these sub-      Positive subjects had a mean age of 51.7 years with high
jects (2, 13–17). Viral load data from PAMS cases are rarely      standard deviation (sd) of 22.7 years, and a mean of 4.5 RT-
available, greatly reducing the number of studies with in-        PCR tests (sd 5.7), of which 1.7 (sd 1.4) were positive. Of the
formation from both symptomatic and PAMS subjects and             positive subjects, 4344 had tests on at least three days (with
that span the course of infections (12, 18). Making matters       at least two tests positive), and were included in a time se-
worse, it is not possible to place positive RT-PCR results        ries analysis.
from asymptomatic subjects in time relative to a non-                  We divided the 25,381 positive subjects into three
existent day of symptom onset, so these cases cannot be in-       groups (Fig. 1). Hospitalised: 9519 (37.5%) subjects, includes
cluded in studies focused on incubation period. Additional-       all those who tested positive in an in-patient hospitalised

                                                                                                                                       Downloaded from http://science.sciencemag.org/ on August 13, 2021
ly, viral load time courses relative to the day of symptom        context at any point in their infection; PAMS: 6110 (24.1%)
onset rely on patient recall, a suboptimal measure subject to     subjects whose first positive sample was obtained in any of
human error and which overlooks infections from pre-              24 Berlin COVID-19 walk-in community test centres, provid-
symptomatic or asymptomatic contacts (12). An alternative         ed they were not in the Hospitalised category; and Other:
and more fundamental parameter, the day of peak viral             9752 (38.4%) subjects not in the first two categories (table
load, can be estimated from dated viral load time series da-      S1). As Fig. 1 shows, there were very few elderly PAMS sub-
ta, drawn from the entire period of viral load rise and fall      jects, and relatively low numbers of young subjects in all
and the full range of symptomatic statuses.                       three groups. The validity of the PAMS classification is sup-
     To better understand SARS-CoV-2 infectiousness we an-        ported by the fact that of the overall 6159 infections detect-
alyzed viral load, cell culture isolation, and genome se-         ed at walk-in test centres, only 49 (0.8%) subjects were later
quencing data from a diagnostic laboratory in Berlin              hospitalised. Subjects testing positive at these centres are
(Charité – Universitätsmedizin Berlin Institute of Virology       almost certainly receiving their first positive test, because
and Labor Berlin). We first address a set of questions re-        they are instructed to immediately self-isolate and our data
garding infectiousness at the moment of disease detection,        confirms that such subjects are rarely re-tested: only 4.6% of
especially in PAMS subjects whose infections were detected        people with at least three test results had their first test at a
at walk-in community test centres. Because these people are       walk-in test center. Of the 9519 subjects who were ever hos-
circulating in the general community prior to the detection       pitalised, 6835 were already in hospital at the time of their
of their infections, and are healthy enough to present at         first positive test. PAMS subjects had a mean age of 38.0
such centres, their prevalence and shedding are of key im-        years (sd 13.7), typically younger than Other subjects (mean
portance to the understanding and prevention of transmis-         49.1 years, sd 23.5), with Hospitalised the oldest group
sion. As well as PAMS subjects, we consider the                   (mean 63.2 years, sd 20.7). Typing RT-PCR indicated that
infectiousness suggested by first-positive tests from hospi-      1533 subjects were infected with a strain belonging to the
talised patients, and differences according to age, virus vari-   B.1.1.7 lineage, as confirmed by full genomes from next-
ant, and gender. A further set of temporal questions are          generation sequencing (see materials and methods).
then addressed by studying how infectiousness changes dur-
ing the infection course. Using viral load measurements           First-positive viral load
from patients with at least three RT-PCR tests, we estimate       Across all subjects, the mean viral load (herein given as log10
the onset of infectious viral shedding, peak viral load, and      RNA copies per swab) in the first positive-testing sample
the rates of viral load increase and decline. Knowledge of        was 6.39 (sd 1.83). PAMS subjects had viral loads higher
these parameters enables fundamental comparisons be-              than the Hospitalised for ages up to 70 years, as exemplified
tween groups of subjects and between virus strains, and           by a 6.9 mean for PAMS compared to a 6.0 mean in Hospi-
highlights the misleading impression created by viral loads       talised adult subjects of 20-65 years. Crude comparisons of
from first-positive RT-PCR tests if the time of testing in the    viral loads in age groups show no substantial difference in
infection course is not considered.                               first-positive viral load between groups of people aged over
                                                                  20 years (Table 1), and that children and adolescents have
Study composition                                                 mean first-positive viral loads differences ranging between
We examined 936,423 SARS-CoV-2 routine diagnostic RT-             -0.49 (-0.69, -0.29) and -0.16 (-0.31, -0.01) compared to

First release: 25 May 2021                            www.sciencemag.org       (Page numbers not final at time of first release)   2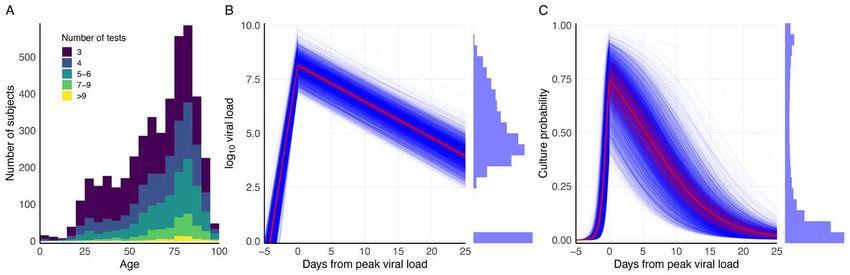
adults aged 20-65 (Table 2). Here and below, parameter dif- positive subjects (8.78%) with a first-positive viral load of at
ferences between age groups show the younger value minus least 9.0 log10, corresponding to an estimated culture proba-
the older, so a negative difference indicates a lower value in bility of ~0.92 to 1.0. Of these 2228 subjects, 804 (36.09%)
the younger group. Ranges given in parentheses are 90% were PAMS at the time of testing, with a mean (median) age
credible intervals. of 37.6 (34.0) and sd of 13.4 years. PAMS subjects are over-
We used a Bayesian thin-plate spline regression to esti- represented in this highly-infectious group among those
mate the relationship between age, clinical status, and viral aged 20-80 years, and Hospitalised subjects are over-
load from the first positive RT-PCR of each subject, adjust- represented in those aged 80-100 years (fig. S3).
ing for gender, type of test center, and PCR system used.
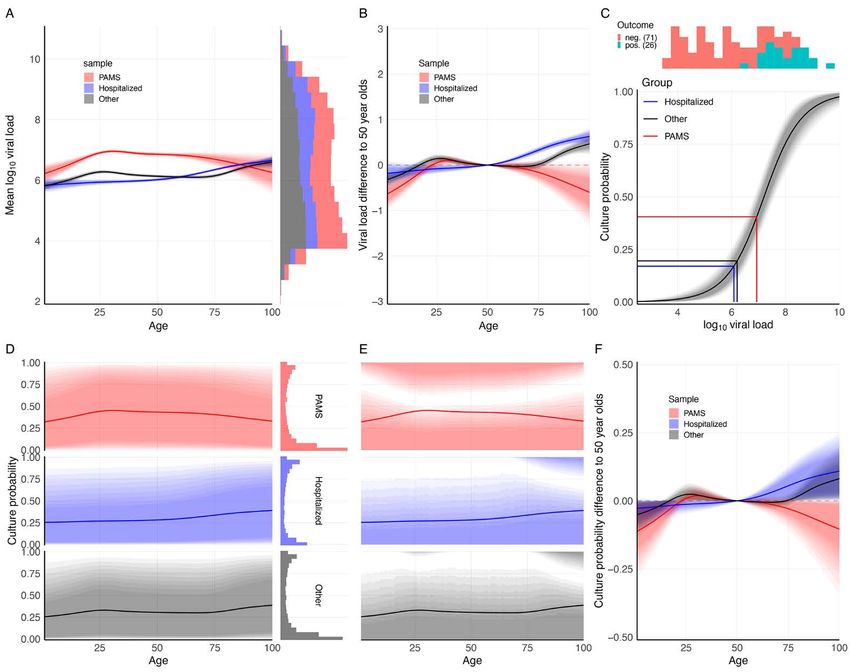
The Bayesian model well represents the observed data (Fig. Estimating B.1.1.7 infectiousness at first-positive test
1B, Table 2, and fig. S1). The raw data and the Bayesian es- The 1533 subjects infected with a B.1.1.7 virus in our dataset
timation (Fig. 2A), suggest considering subjects in three age had an observed mean first-positive viral load of 7.38 (sd
categories: young (ages 0-20 years, grouped into five-year 1.54), which is 1.05 log10 higher (0.97, 1.13) than non-B.1.1.7
brackets), adult (20-65 years), and elderly (over 65 years). subjects in the full dataset. To increase specificity, we com-
We estimated an average first-positive viral load of 6.40 pared 1453 B.1.1.7 cases with 977 non-B.1.1.7 cases using viral
Downloaded from http://science.sciencemag.org/ on August 13, 2021
(6.37, 6.42) for adults and a similar mean of 6.35 (6.32, 6.39) loads only from centres with B.1.1.7 and non-B.1.1.7 cases,
for the elderly (Fig. 2A). Younger age groups had lower and only from the same day or one day before or after the
mean viral loads than adults, with the difference falling B.1.1.7 sample was taken. This analysis adjusted for clinical
steadily from -0.50 (-0.62, -0.37) for the very youngest (0-5 status, gender, RT-PCR system, subject age, and also mod-
years) to -0.18 (-0.23, -0.12) for older adolescents (15-20 eled random test center effects. The results show that B.1.1.7
years) (Table 2). Young age groups of PAMS subjects have cases are associated with a 1.0 (0.9, 1.1) higher viral load
lower estimated viral loads than older PAMS subjects, with (Fig. 3 and table S2). This results in a mean estimated B.1.1.7
differences ranging from -0.18 (-0.29, -0.07) to -0.63 (-0.96, subject culture probability of 0.50 (0.03, 0.97), considerably
-0.32). Among Hospitalised subjects these differences are higher than the overall figure of 0.31 (0.00, 0.94) for the
smaller, ranging from -0.18 (-0.45, 0.07) to -0.11 (-0.22, 0.01) non-B.1.1.7 subjects in the comparison, corresponding to a
(Table 2 and Fig. 2B). Viral loads of subjects younger than median 2.6 (50% credible interval: 1.4, 5.1) times higher cul-
65 years were around 0.75 higher for PAMS than for Hospi- ture probability for samples from B.1.1.7 cases. To investi-
talised subjects (Fig. 2A), likely due to a systematic differ- gate whether there might be a difference in cell culture
ence in RT-PCR test timing, discussed below. infectivity due to a factor other than viral load, we isolated
virus from 105 samples (22 B.1.1.7, 83 B.1.177) in Caco-2 cells
Associating viral load with cell culture infectivity from a collection of 223 samples with matched viral loads.
We estimated the association between viral load and suc- While no statistical difference was seen in the distribution
cessful cell culture isolation probability (hereafter “culture of viral loads that resulted in successful isolation (fig. S4),
probability”) by combining the Bayesian regression estima- uncertainty due to the routine diagnostic laboratory context,
tions with cell culture isolation data from our own laborato- including uncontrolled pre-analytical parameters such as
ry (19) and from Perera et al. (20) (Fig. 2C). Across all ages, transportation time and temperature, together with the
the average estimated culture probability at the time of first small isolation-positive sample sizes are insufficient to sup-
positive RT-PCR was 0.35 (0.01, 0.94). The mean culture port a conclusion that the distributions do not differ (see
probability is higher for PAMS cases, at 0.44 (0.01, 0.98), materials and methods).
than Hospitalised cases, at 0.32 (0.00, 0.92) (Fig. 2D). Com-
paring PAMS cases, we found differences, in particular for Estimating infectiousness over time
children aged 0-5 compared to adults aged 20-65, with aver- To investigate viral load over the course of the infection, we
age culture probabilities of 0.329 (0.003, 0.950) and 0.441 estimated the slopes of a model of linear increase and then
(0.008, 0.981) respectively, and a difference of -0.112 (-0.279, decline of log10 viral load using a Bayesian hierarchical
-0.003). Age group differences in Hospitalised cases range model. The analysis used the time series of the 4344 sub-
from -0.028 (-0.104, 0.009) to -0.018 (-0.055, 0) (Table 2). jects who had RT-PCR results on at least three days (with at
First-positive viral loads are weakly bimodally distribut- least two tests being positive). The number of subjects with
ed (Figs. 1A and 2A), which is not reflected in age-specific multiple test results skews heavily toward older subjects,
means. The resultant distribution of culture probability in- with very few below the age of 20 meeting the criterium
cludes a majority of subjects with relatively low, and a mi- (Fig. 4A). We estimated time from onset of shedding to peak
nority with very high culture probability (Fig. 2E and fig. viral load of 4.31 (4.04, 4.60) days, mean peak viral load of
S2). The highly-infectious subset includes 2228 of 25,381 8.1 (8.0, 8.3), and mean decreasing viral load slope of -0.168
First release: 25 May 2021 www.sciencemag.org (Page numbers not final at time of first release) 3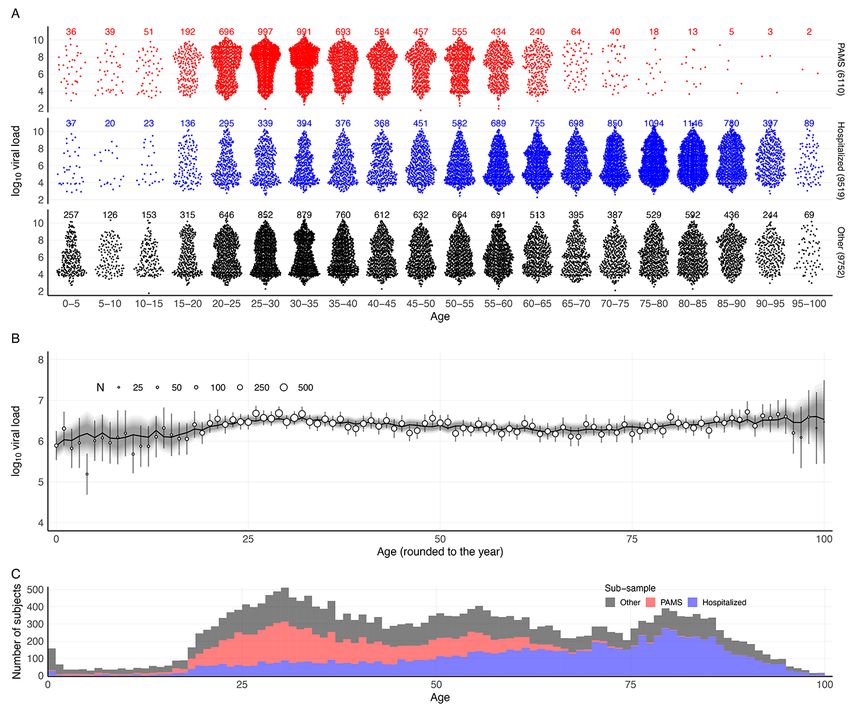
(-0.171, -0.165) log10 per day (fig. S5). Figure S6 shows that     Discussion
while Hospitalised patients are estimated to be uniformly          Limitations
highly infectious at peak viral load, the infectiousness of        Our analysis attempted to account for effects of gender, PCR
PAMS subjects at peak load is more variable.                       system, and test center type. Although we could not incor-
     The temporal placement of the full 18,136 RT-PCR re-          porate inter-run variability or the variability in the sample
sults from these 4344 subjects (80% of whom were hospital-         pre-analytic, such as type of swab or initial sample volume
ised with COVID-19 at some point in their infections) is           in our conversion of RT-PCR cycle threshold values to log10
shown in fig. S7. Per-subject trajectories can differ consider-    viral load values, these variabilities apply to all age groups
ably from that described by the mean parameters (Fig. 4B           and do not affect the interpretation of data for the purpose
and fig. S8). Across all subjects, PAMS cases were on aver-        of the present study. If the proportion of subjects with a
age detected 5.1 (4.5, 5.7) days after peak load, 2.4 (1.7, 3.0)   certain clinical status differs between age groups in the
days before non-PAMS cases, which were on average detect-          study sample, this could lead to over- or underestimation of
ed 7.4 (7.2, 7.6) days after peak load. We estimate that 962       differences in viral load between age groups. However, as
(914, 1010) of the 4344 subjects (22.14% (21.04, 23.25)) had a     our study compares viral load between age groups stratified
first positive test before the time of their peak viral load,

                                                                                                                                        Downloaded from http://science.sciencemag.org/ on August 13, 2021
                                                                   by clinical status, it appears unlikely that differential testing
with a mean of 1.4 (1.3, 1.5) days before reaching peak viral      biases our results.
load. Among the infections detected after peak viral load,
the timing of the first positive RT-PCR test is estimated at       Interpreting first-positive viral loads
9.8 (9.6, 10.0) days after peak viral load, with sd of 6.9 (6.8,   Viral loads and their differences are not easy to interpret,
7.0) days, reflecting a broad time range of infection detec-       absent knowledge of when in the disease course the samples
tion. Estimated peak viral loads were higher in Hospitalised       were taken and the correspondence between viral load and
subjects than Other, and higher in Other than PAMS, with           shedding. The higher first-positive viral loads in PAMS sub-
differences of 0.68 (0.83, 0.52) and 0.96 (0.33, 1.53) respec-     jects than Hospitalised subjects are likely due to time of
tively (fig. S9 and table S3). No differences were seen ac-        detection. This is suggested in the first place by the estimat-
cording to gender. Viral load time courses are similar across      ed 2.4 (1.7, 3.0) day difference in test timing, which would
age groups, though younger subjects have lower peak viral          produce a viral load difference of ~0.4 using the -0.168 daily
load than adults aged 45-55 (Fig. 5, A and C, fig. S10, and        viral load decline gradient from the (mainly hospitalised)
table S4). Model parameters suggest slightly longer time to        time series subjects. Additionally, the time series of PAMS,
peak, higher peak, and more rapid decline in viral load            Other, and Hospitalised subjects estimates that, throughout
when the analysis is restricted to subjects with successively      the infection course, the Hospitalised group have higher
higher numbers of RT-PCR results (fig. S11 and table S5),          viral loads than Other, who are in turn higher than PAMS
with an increasing percentage of hospitalised subjects. Dif-       (fig. S9 and table S3). This relationship holds across age
ferences in model parameters according to the number of            groups (fig. S13) and also in a fine-grained split of test cen-
tests in subjects may reflect increased parameter accuracy         tres by clinical severity (fig. S14). Similarly, the lower first
due to additional data, though other factors associated with       positive viral loads in elderly PAMS subjects may be due to
being tested more frequently may be responsible. The Bayes-        these subjects being less likely to be tested as early due to
ian estimation of the model agrees well with a separate sec-       being more likely to be house-bound, less likely to be em-
ond implementation based on simulated annealing (fig. S12,         ployed, less mobile, more cautious and inclined to get tested
table S5, and supplementary text).                                 with only mild symptoms, etc. The impact on infectiousness
     We estimate that the rise from near-zero to peak culture      of differences in viral load must be informed by where the
probability takes 1.8 (1.3, 2.6) days, with a mean peak cul-       viral loads fall on the viral load / infectivity curve. In our
ture probability of 0.74 (0.61, 0.85). Mean culture probability    data, the viral loads involved in the difference between the
then declines to 0.52 (0.40, 0.64) at five days and to 0.29        means in children and adults and the difference between
(0.19, 0.40) at ten days after peak viral load. Subject-level      means in B.1.1.7 and non-B.1.1.7 subjects result in quite dif-
time courses can deviate substantially from these mean es-         ferent corresponding culture probabilities (see below).
timates (Fig. 4C). Peak culture probabilities for age groups
range from a low of 0.54 (0.39, 0.71) for 0-5 year olds to 0.80    A highly-infectious minority and over-dispersion
(0.67, 0.90) for subjects over 65 years. The least infectious      The bimodal distribution of culture probabilities (Fig. 2, D
youngest children have 78% (61, 94) of the peak culture            and E) shows a small group of 8.78% of highly-infectious
probability of adults aged 45 to 55 (Fig. 5, B and D, and ta-      subjects. This qualitatively agrees with a model (21) and a
ble S4). Insufficient data precludes a reliable B.1.1.7 viral      study (22) concluding that 10% and 15% of index cases, re-
load time series analysis at this point.                           spectively, may be responsible for 80% of transmission. Oth-

First release: 25 May 2021                             www.sciencemag.org       (Page numbers not final at time of first release)   4
er studies reported that 8-9% of individuals harboured 90% lack of cooperation, and the sample volume carried by
of total viral load (23), that in cases from India (24) and smaller pediatric swab devices is lower than in larger swabs
Hong Kong (6) ~70% of index cases had no secondary cases. used for adults (36). Infections in mildly-symptomatic chil-
The risk posed by PAMS subjects is highlighted by the fact dren may be initially missed and only detected later (37),
that 36.1% of the highly-infectious subjects in our study resulting in lower first-positive viral loads. Our results of
were PAMS at the time of the detection of their infection, similar viral load trajectories for children and adults (Fig.
that their mean age was 37.6 years with a high standard 5), and the numeric range of the viral load values in ques-
deviation of 13.4 years (figs. S2 and S3), and our estimate tion (Fig. 2C), suggest that viral load differences between
that infectiousness peaks 1-3 days before onset of symptoms children and adults are too small to alone produce large
(if any). differences in infectiousness. The relative impact on trans-
mission of general age-related physiological differences,
Comparison with influenza virus such as different innate immune responses (38), may be
Absent direct knowledge from a large number of SARS-CoV- small as compared to the impact of large differences in fre-
2 transmission events, we could try to draw conclusions re- quency of close contacts and transmission opportunities.
garding infectiousness from studies of other respiratory vi-
Downloaded from http://science.sciencemag.org/ on August 13, 2021
ruses, such as influenza. However, it has become clear that Timing of estimated peak infectiousness relative to
there are important differences and uncertainties that onset of symptoms
would cast doubt on such a comparison. Influenza may have We estimated the time from onset of shedding to peak viral
later onset of viral shedding, shedding finishes earlier, there load at 4.3 days. Previous studies and reviews of COVID-19
may be a lower secondary attack rate, viral loads are much report mean incubation times of 4.8 to 6.7 days (4, 39–44),
lower, there is variation between virus subtypes, the role of which suggests that, on average, a period of high infectivity
asymptomatic subjects in transmission is uncertain or can start several days before symptoms onset. Viral load rise
thought to be reduced, and the frequency of asymptomatic may vary between individuals, and limitations of the availa-
infections is uncertain, especially in children (10, 11, 25–29). ble data suggest that our analysis may underestimate inter-
Age-specific behavioral differences do however make a large individual variation in viral load increase. The failure to
contribution to the established higher shedding of children isolate virus in cell culture beyond 10 days from symptom
compared to adults in influenza. This should be an im- onset (19, 20, 35, 45, 46) together with our estimated slope
portant consideration for SARS-CoV-2, as shown by studies of viral load decline also suggests peak viral load occurs 1-3
indicating higher transmission between children of similar days before symptom onset (supplementary text). Data from
ages (6, 24) and high transmission heterogeneity (22). De- 171 hospitalised patients from a Charité – Universi-
spite many decades of close study of influenza virus, the tätsmedizin cohort suggest a figure of 4.3 days (fig. S15 and
relationship between viral load and transmission is unclear supplementary text).
(10, 11). The situation with respiratory syncytial virus is even
less clear (30). Understanding SARS-CoV-2 transmission will Estimated infectiousness of the B.1.1.7 variant
likely be at least as challenging, given the high frequency of We found an approximately 1 log10 higher first-positive viral
transmission from PAMS subjects (1–8), suggesting an im- load in people infected with a B.1.1.7 virus than people in-
portant role for clinical parameters, given the apparently fected with a wild-type. The scale of the viral load difference
strong association between viral load and transmission, in- and the fact that it is also present in the comparison be-
dependent of symptoms (9). tween B.1.1.7 infected subjects and non-B.1.1.7 infected sub-
jects drawn from the same test centres at the same times,
Estimated infectiousness in the young argue that the difference is not due to a systematic differ-
The differences we observe in first-positive RT-PCR viral ence in time of sampling. The 1 log10 higher B.1.1.7 viral load
load between groups based on age are minor, as in other can be compared to implied 5-10x higher B.1.1.7 viral loads
studies (31–35) and the viral loads in question, in the range in two large and closely-controlled UK studies, a vaccine
of 5.9 to 6.6 (Table 1), are in a region of the viral load / cul- trial (47) and a mortality study (48), based on RT-PCR cycle
ture probability association where changes in viral load threshold differences of ~3 and 2.3 respectively. Several oth-
have relatively little impact on estimated culture probability er studies also appear to point to a higher B.1.1.7 viral load
(Fig. 2C). Comparisons between adult viral loads and those (49–52) (supplementary text). Importantly, the mean B.1.1.7
of children and the relative infectious risks they pose are viral load value in our study falls in a region of the viral
difficult due to the likely influence of non-viral factors. Na- load / culture probability curve with steep gradient (Fig.
sopharyngeal swab samples, which often carry higher viral 2C), resulting in an estimated culture probability considera-
loads, are rarely taken from young children due to pain and bly higher than for non-B.1.1.7 subjects. Although a strong
First release: 25 May 2021 www.sciencemag.org (Page numbers not final at time of first release) 5correlation has been observed between SARS-CoV-2 viral closed ranges of years (e.g., 0-5 signifies (0-5] years). We
load and transmission (9), here we are estimating infectivity group subjects up to 20 years old into age categories span-
probability from cell culture trials. Any impact of a change ning five years, subjects from 20 to 65 years into an adult
in viral load on transmission will be highly dependent on group, and elderly subjects into a 65+ category. This catego-
context, so the large difference in estimated culture proba- risation is motivated by the observed data and the Bayesian
bility in our data is only a proxy indication of potentially estimation of viral load differences between children of dif-
higher transmissibility of the B.1.1.7 strain. We estimate ferent ages and adults. The age groupings used in the viral
B.1.1.7 infected subjects having a 2.6 times higher mean cul- load time series analysis are broader in the younger catego-
ture probability than non-B.1.1.7 infected subjects. This ries to increase the cardinality of those groups, due to the
range can be compared to a UK study that found a 1.3 rela- fact that few young people have at least three RT-PCR tests
tive increase in secondary attack rates for B.1.1.7 index cases (Fig. 4A).
in ~60,000 household contacts (53), a UK study estimating a
1.7 to 1.8 increase in transmission (54), and to an estimate of Viral loads
a 43% to 90% higher reproductive number (55). Viral load is semiquantitative, estimating RNA copies per
entire swab sample, while only a fraction of the volume can
Downloaded from http://science.sciencemag.org/ on August 13, 2021
Summary reach the test tube. The quantification is based on a stand-
Our results indicate that PAMS subjects in apparently- ard preparation tested in multiple diluted replicates to gen-
healthy groups can be expected to be as infectious as hospi- erate a standard curve and derive a formula upon which RT-
talised patients at the time of detection. The relative levels PCR cycle threshold values are converted to viral loads. This
of expected infectious virus shedding of PAMS subjects (in- approach does not reflect inter-run variability or the varia-
cluding children) is of high importance because these peo- bility in the sample pre-analytic, such as type of swab or
ple are circulating in the community and it is clear that they initial sample volume (varying between 2.0 and 4.3 mL).
can trigger and fuel outbreaks (56). The results from our However, these variabilities apply to all age groups and do
time series analysis, and their generally good agreement not affect the interpretation of data for the purpose of the
with results from studies based on other metrics (often epi- present study.
demiological), show that accurate estimations can be direct- Viral load figures are given as the logarithm base 10. Vi-
ly obtained from two easily-measured virological ral load is estimated from the cycle threshold (Ct) value us-
parameters, viral load and sample cell culture infectivity. ing the empirical formulae 14.159 - (Ct * 0.297) for the
Such results can be put to many uses: to estimate transmis- Roche Light Cycler 480 system and 15.043 - (Ct * 0.296) for
sion risk from different groups (by age, gender, clinical sta- the Roche cobas 6800/8800 systems. The formulae are de-
tus, etc), quantify variance, show differences in virus rived from testing standard curves and cannot be trans-
variants, highlight and quantify over-dispersion, and to in- ferred to calculate viral load in other laboratory settings.
form quarantine, containment, and elimination strategies. Calibration of the systems and chemistries in actual use is
Our understanding of the timing and magnitude of change required.
in viral load and infectiousness, including the impact of in-
fluencing factors, will continue to improve as data from B.1.1.7 viral load analysis
large studies accumulate and are analyzed. A major ongoing No assignment regarding symptomatic status was made for
challenge is to connect what we learn about estimated infec- B.1.1.7 subjects due to uncertainties regarding exact opera-
tiousness from these clinical parameters to highly context- tional protocols at outbreak hospitals. B.1.1.7 assignment to
dependent in vivo transmission. Based on our estimates of samples was initially made according to typing-RT-PCR
infectiousness of PAMS subjects and the higher viral load tests that detect the N501Y and 69/70 deletion in the amino
found in subjects infected with the B.1.1.7 variant, we can acid sequence of the virus spike protein. Examination of the
safely assume that non-pharmaceutical interventions such complete viral genome of 49 samples confirmed that the
as social distancing and mask wearing have been key in subjects were in fact infected with the B.1.1.7 variant, with
preventing many additional outbreaks. Such measures all variant-defining substitutions and deletions (57) found in
should be employed in all social settings and across all age all cases. No consistent additional mutations or dele-
groups, wherever the virus is present. tions/insertions were found in the sequences.
Sequencing read mapping was performed with Bowtie,
Materials and methods with alignment using MAFFT, and visual inspection using
Age ranges Geneious Prime (all version numbers given below). For the
Age categories for the analysis of the first-positive test re- statistical comparison of B.1.1.7 and non-B.1.1.7 subjects, we
sults mentioned in the text indicate mathematically open- identified test centres (hospital departments or wards, or
First release: 25 May 2021 www.sciencemag.org (Page numbers not final at time of first release) 6organisations outside hospitals) that reported B.1.1.7 cases, and was estimated using four chains with 1000 warm-up
and chose as comparison groups non-B.1.1.7 cases that were samples and 2000 post-warm-up samples. Convergence of
detected in these test centres on the same day or one day MCMC chains was examined by checking that Potential
earlier or later. By modeling random effects for test centres, Scale Reduction Factors (R-hat) values were below 1.1. All
we estimate the expected viral load difference as the average calculations of age averages and group differences are based
of the within-test center differences. The consistent effect of on posterior predictions generated from estimated model
B.1.1.7 throughout a range of comparison scenarios is shown parameters. Expected probabilities of positive cultures (and
in table S2. their differences) were calculated by applying the posterior
distribution of model parameters from the culture probabil-
Sample type ity model to posterior predictions from the age association
An estimated 3% of our samples were from the lower respir- model.
atory tract. These were not removed from the dataset be-
cause of their low frequency and the fact that the first Combining culture probability data
samples for patients are almost universally swab samples. To estimate the association between viral load and culture
Samples from the lower respiratory tract are generally taken probability, we used data previously described by Wölfel
Downloaded from http://science.sciencemag.org/ on August 13, 2021
from patients only after intubation, by which point viral (19) and Perera (20). Four other data sets could not be in-
loads have typically fallen. cluded because Ct values were not converted to viral loads
(35, 46, 61, 62). The data from the study by van Kampen et
PAMS status al. (63) were not included because they differed (by viral
Metadata needed to discriminate patients into sub-cohorts load of ~1.0) from the data used for the current analysis,
based on underlying diseases, outcome, or indications for likely due to a combination of factors including many pa-
diagnostic test application, including symptomatic status, tients who were in critical or immunocompromised condi-
were not always available. In the absence of subject-level tion, a high proportion of samples obtained from the lower
data, we inferred PAMS status using the type of submitting respiratory tract including late in the infectious course, and
test center as an indicator, classifying subjects as PAMS at likely differences in cell culture trials. It is unsurprising that
the time of testing if their first-positive sample was taken these data result in a shifted viral load / culture probability
from a walk-in COVID-19 test center and the subject had no curve, and we excluded them because our focus was largely
later RT-PCR test done in a hospitalised context (e.g., in a on first positive RT-PCR results from the upper respiratory
ward or an intensive care unit). The correspondence be- tract, including from many subjects who were PAMS. The
tween viral load and PAMS status derived herein may there- Digital Supplement shows the plot of the van Kampen data
fore be less accurate than in studies with subject-level set compared to the two we used. To calculate the expected
symptom data. However, we make no formal claims regard- culture probability, by age (as in Fig. 2D) or by day from
ing symptomatic status, and instead emphasize the fact that peak viral load (as in Fig. 4C), we combined the viral loads
these PAMS subjects were healthy enough to be presenting (Figs. 2A and 4B) with the results of the regression of cul-
at walk-in COVID-19 test centres, and were therefore capa- ture probability shown in Fig. 2C. We used posterior predic-
ble to some extent, at that time, of circulating in the general tions from the age regression model, which reflect the
community. variation of log10 viral load within age groups, to estimate
culture probabilities by age. For instance, to obtain the cul-
Bayesian analysis of age - viral load associations ture probability for a specific age and group, we look up the
We estimated associations of viral load and age with a thin- estimated (expected) viral load for that group, add an error
plate spline regression using the brms package (58, 59) in R term, and, using the association shown in Fig. 2C, and de-
(60). Spline coefficients were allowed to vary between termine the expected culture probability. We used expected
groups determined by the type of the test center and clinical time courses, i.e., the model’s best guess for a time course, to
status (PAMS, Hospitalised, or Other), and random inter- estimate culture probability time courses.
cepts captured effects of test centres. To reduce the impact
of outliers we used Student-t distributed error terms. The B.1.1.7 isolation data
analysis additionally accounted for baseline differences be- The Institute of Virology at Charité – Universitätsmedizin
tween subject groups, B.1.1.7 status, gender, and for the ef- Berlin routinely receives SARS-CoV-2 positive samples for
fect of the RT-PCR system. We also estimated the confirmatory testing and sequencing. For this study we used
association between viral load and culture probability in anonymized remainder samples from a large laboratory in
order to calculate the expected culture probability at differ- northern Germany, that were all stored in phosphate-
ent age levels. This analysis used weakly-informative priors buffered saline (PBS) and therefore suitable for cell culture
First release: 25 May 2021 www.sciencemag.org (Page numbers not final at time of first release) 7isolation trials. Sample transport to the originating lab and in the converse, the isolation-positive sample sizes are too
later to Berlin was unrefrigerated, via road. As part of the low to support the assertion that the distributions do not
routine testing, these samples were classified by typing RT- differ.
PCR and complete genome sequencing (64). 113 B.1.1.7 line-
age samples and 110 B.1.177 lineage samples were selected, Estimating viral load time course
with approximately matched (pre-inoculation) SARS-CoV-2 Each RT-PCR test in our data set has a date, but no infor-
RNA concentrations. Caco-2 (human colon carcinoma) cell mation regarding the suspected date of subject infection or
cultures (65) were inoculated twice from each sample, once onset of symptoms (if any). Although determining the day of
with undiluted material and once with a 1:10 dilution. The peak viral load for a single person based on a series of dated
diluted inoculant was used to reduce the probability of cul- RT-PCR results would not in general be feasible due to indi-
turing failure due to the possible presence of host immune vidual variation, with data from a large enough set of peo-
factors (antibodies, cytokines, etc) that might negatively ple, a clear and consistent model of viral load change over
impact isolation success, and to reduce the possibility of time can be inferred with very few assumptions.
other unrelated agents (bacteria, fungi, etc) resulting in cy- We included a single leading and/or trailing negative
topathic effect in the culture system. For cell culture isola- RT-PCR result, if dated within seven days of the closest posi-
Downloaded from http://science.sciencemag.org/ on August 13, 2021
tion trials, 1.6x10⁵ cells were seeded per well in a 24-well tive RT-PCR. To produce a model of typical viral load de-
plate. Cells were inoculated with swab suspensions for one cline on a reasonable single-infection timescale we excluded
hour at 37°C, subsequently rinsed with PBS, and fed with 1 subjects whose full time series contains positive RT-PCRs
mL fresh Dulbecco’s modified Eagle’s minimum essential spread over a period exceeding 30 days. Such time series
medium (DMEM; ThermoFisher Scientific) supplemented may be due, for example, to contamination, to later swab-
with 2% fetal bovine serum (FBS; Gibco), 100 U/mL penicil- bing that picks up residual RNA fragments in tonsillar tis-
lin, and 100 μg/mL streptomycin (P/S; ThermoFisher Scien- sue (66), to re-infection (67–69), or may represent atypical
tific), and 2.5 μg/mL Amphotericin B (biomol) then infection courses (such as in immunocompromised or se-
incubated for five days before harvesting supernatant for verely ill elderly patients) (70). We excluded data from sub-
RT-PCR testing. Positive cell culture isolation was defined jects with an infection delimited by both an initial and a
by a minimum 10x higher SARS-CoV-2 RNA load in the su- trailing negative test when there was only a single positive
pernatant compared to the inoculant and signs of a typical RT-PCR result between.
SARS-CoV-2 cytopathic effect. Culture isolation was success- We estimated the slopes for a model of linear increase
ful for 22 B.1.1.7 and 61 B.1.177 samples. Due to uncertainty and then decline of log10 viral load. To compensate for the
regarding sample handling before arrival at the originating absence of information regarding time of infection, we also
diagnostic laboratory and the unrefrigerated transport, it estimated the number of days from infection to the first pos-
was not possible to determine whether isolation failures itive test for each participant, to position the observed time
were due to samples containing no infectious particles (due series relative to the day of peak viral load. The analysis was
to sample degradation) or for other reasons. Such reasons implemented in two ways. Initially, simulated annealing
could include systematic handling differences according to was used to find an optimized fit of the parameters, mini-
variant type or a difference in virion stability and durability mizing a least squares error function. Secondly, a Bayesian
regarding environmental factors such as temperature. hierarchical model estimated subject-specific time courses,
Therefore, negative isolation outcome samples were exclud- imputed the viral load assigned to each initial or trailing
ed from analysis. The strong likelihood of many cases of negative test, and modeled associations of age, gender, clini-
complete sample degradation is evident from the isolation cal status, and RT-PCR system with model parameters. We
failure of many samples with high pre-inoculation viral tested both methods on data subsets ranging from subjects
load, with the viral load in these cases merely indicating the with at least three to at least nine RT-PCR results. The two
presence of non-infectious SARS-CoV-2 RNA (fig. S4). Given methods produced results that were in generally good
this context, we were reduced to questioning whether there agreement (table S5). The finer-grained Bayesian approach
might be a difference in the range of viral loads that were appears more sensitive than the simulated annealing and its
able to result in isolation between B.1.1.7 and non-B.1.1.7 results, for subjects with at least three RT-PCR results, are
variants. Such a difference could result from a difference in those described in the main text.
the ratio of viral RNA to infectious particles produced by the Simulated annealing approach: A simulated annealing
variants, or from a non-viral load difference in the variants. optimization algorithm (71) was used to adjust the time se-
We examined the distribution of pre-inoculation viral loads ries for each subject slightly earlier or later in time, by
from isolation-positive samples from both variants for a dif- amounts drawn from a Normal distribution with mean 0.0
ference. No statistically significant difference was found, but and standard deviation 0.1 days. The error function was the
First release: 25 May 2021 www.sciencemag.org (Page numbers not final at time of first release) 8sum of squares of distances of each viral load from a viral independently, i.e., without a hierarchical structure. Fig. S7
load decline line whose slope was also adjusted as part of shows the placement in time of individual viral loads after
the annealing process. In the error calculation, negative test shifting for subjects with RT-PCR results from at least three
results were assigned a viral load of 2.0, in accordance with days. Model parameters changed gradually when subsets of
our SARS-CoV-2 assay limit of detection and sample dilution subjects with an increasing minimum number of RT-PCR
(19). The initial slope of the decline line was set to -2.0 and results, from three to nine, were examined (fig. S11 and table
was varied using N(0, 0.01). A second, optional, increase line S5). The viral load assigned to negative test results (which
initialized with a slope of 2.0, adjusted using an N(0, 0.01) may include viral loads below the level of detection) is esti-
random variable, was included in the error computation if mated with a uniform prior on the support from -Inf to 3
the day of a RT-PCR test was moved earlier than day zero (see also the caption of fig. S7). Using prior predictive dis-
(the modeled day of peak viral load). The height of the in- tributions we specified (weakly) informative priors for this
tercept (i.e., the estimated peak viral load) between the in- analysis. This analysis was implemented in Stan (72). Full
crease line (if any) and the decline line was also allowed to details and R and Stan code for the Bayesian analysis, as
vary randomly (starting value 10.0, varied using N(0, 0.1)). well as comparison of priors and posteriors, are given in the
The full time series for each subject was initialised to a supplementary materials.
Downloaded from http://science.sciencemag.org/ on August 13, 2021
begin with the first positive result positioned at day 2 + Checking convergence of the model parameters showed
N(0.0, 0.5) post peak viral load. The random move step of that while 99.3% of all parameters converged with an R-hat
the simulated annealing modified either of the two slopes or value below 1.1, some subject-level parameters of 118 sub-
the intercept, each with probability 0.01, otherwise (with jects (among 4344 subjects with at least 3 RT-PCR results)
probability 0.97) one subject’s time series was randomly showed R-hat values between 1.1 and 1.74. Inspection of
chosen to be adjusted earlier or later in time. After the sim- these parameters showed that these convergence difficulties
ulated annealing stage, each time series was adjusted to an were due to observed time courses that could arguably be
improved fit (when possible), based on the optimized in- placed equally well at the beginning or a later stage of the
crease and decline lines. Linear regression lines were then infection. Figure S16 shows a set of 81 randomly-selected
fitted through the results occurring before and after the posterior predictions, to give an impression of time series
peak viral load (x = 0) and compared to the lines with slopes placement, while fig. S17 shows the 49 participants with the
optimized by the simulated annealing alone. This final step parameters with the highest R-hat values. While the high R-
helped to fine-tune the simulated annealing, in particular hat values could be removed by using a mixture approach to
sometimes placing a time series much earlier or much later model shift for these participants, in light of their low fre-
in time after it had stochastically moved initially in a direc- quency we retained the simpler model to avoid additional
tion that later (when the increase and decline line slopes complexity. Alternatively, constraining the shift parameter
had converged) proved to be sub-optimal. The slopes of the to negative numbers would also improve R-hat values for
lines fitted via linear regression after this final step were in these subjects, at the cost of the additional assumption that
all cases very similar (generally ±0.1) to those produced by infections are generally not detected weeks after infection.
the initial simulated annealing step. The final adjustments Sensitivity analysis: In addition to examining the viral
can be regarded as a last step in the optimization, using a load time series of subjects with RT-PCR results on at least
steepest-descent movement operator instead of an unin- three days, we tested both approaches on data from subjects
formed random one. A representative optimization run for with results from a minimum of four to nine days. Given the
subjects with at least three RT-PCR results is shown in fig. degree of temporal viral load variation seen in other studies
S12. (18–20, 35, 41, 46, 63, 73, 74), and in our own data, our ex-
Bayesian approach: The Bayesian analysis of viral load pectation was that a relatively high minimum number of
time course implements the same basic model, and addi- results might be required before reliable parameter esti-
tionally estimates associations of model parameters with mates with small variance would be obtained, but this
covariates age, sex, B.1.1.7 status, and clinical status, esti- proved not to be the case. The simulated annealing ap-
mates subject-level parameters (slope of log10 load increase, proach was tested with a wide range of initial slopes and
peak viral load, slope of log10 load decrease) as random ef- intercept heights as well as seven different methods for the
fects, and accounts for effects of PCR system and test center initial placement of time series. In general, maximum viral
types with random effects. To estimate the number of days load and decline slopes were robust to data subset and ini-
from infection to the first test (henceforth ‘shift’) we con- tial time series location, though there was variation in the
strained the possible shift values from -10 to 20 days and length of the time to peak viral load, depending on how ear-
used a uniform prior on the support. In contrast to the oth- ly in time the time series were initially positioned, the initial
er subject-level parameters, we estimated subject-level shifts slope of the increase line and height of the maximum viral
First release: 25 May 2021 www.sciencemag.org (Page numbers not final at time of first release) 9load, etc. This is as expected as the settings of these parame- (89), and MAFFT (4.475) (90). Analyses in R (4.0.2) (60)
ters can be used to bias the probability that a time series is were conducted using the following main packages: brms
initially positioned early or late in time and how difficult it (2.13.9) (58, 59), rstanarm (2.21.1) (91), rstan (2.21.2) (92),
is for it to subsequently move to the other side of the peak data.table (1.13.3) (93), and ggplot2 (3.3.2) (94). Bayesian
viral load at day zero. Table S5 shows parameter values for analysis in R was based on Stan (2.25) (72). Parallel execu-
both approaches on the various data subsets. tion was performed with GNU Parallel (20201122 (‘Biden’)
Day of infection: We define the moment of infection as (95)).
the time point at which the increasing viral load crosses
zero of the log10 y-axis, i.e., when just one viral particle was Data curation and anonymization
estimated to be present. Because the time of infection de- Research clearance for the use of routine data from anony-
pends on the estimated peak viral load and the slope with mized subjects is provided under paragraph 25 of the Berlin
which viral load increases, the data should optimally in- Landeskrankenhausgesetz. All data are anonymized before
clude multiple pre-peak viral load test results for each indi- processing to ensure that it is not possible to infer patient
vidual. If, as in the current data set, only a subset of subjects identity from any processing result. All patient information
have test results from pre-peak viral load, a hierarchical is securely combined into a token that is then replaced with
Downloaded from http://science.sciencemag.org/ on August 13, 2021
modeling approach still allows calculating subject-level es- a value from a strong one-way hash function prior to the
timates. Intuitively, this approach uses data from all sub- distribution of data for analysis. Viral loads are calculated
jects to calculate an average slope parameter for increasing from RT-PCR cycle threshold values that have only one dec-
viral load. In addition, it models subject-level parameters as imal place of precision.
varying around the group level parameter. To further refine
the estimation of slope parameters the model also uses the REFERENCES AND NOTES
covariates age (see fig. S10), gender, and clinical status. Be- 1. S. Lee, T. Kim, E. Lee, C. Lee, H. Kim, H. Rhee, S. Y. Park, H.-J. Son, S. Yu, J. W.
cause negative test results could be false negatives, viral Park, E. J. Choo, S. Park, M. Loeb, T. H. Kim, Clinical Course and Molecular Viral
loads for these tests are imputed (with an upper bound of Shedding Among Asymptomatic and Symptomatic Patients With SARS-CoV-2
3). Subject-level peak viral load and declining slope are Infection in a Community Treatment Center in the Republic of Korea. JAMA
Intern. Med. 180, 1447–1452 (2020). doi:10.1001/jamainternmed.2020.3862
modeled with the same approach. More generally, using a Medline
hierarchical model and shrinkage priors for covariates ef-
2. C. M. Szablewski, K. T. Chang, M. M. Brown, V. T. Chu, A. R. Yousaf, N. Anyalechi,
fects results in more accurate predictions in terms of ex- P. A. Aryee, H. L. Kirking, M. Lumsden, E. Mayweather, C. J. McDaniel, R.
pected squared error (75) compared to analyzing each Montierth, A. Mohammed, N. G. Schwartz, J. A. Shah, J. E. Tate, E. Dirlikov, C.
subject in isolation, but the overall improvement introduces Drenzek, T. M. Lanzieri, R. J. Stewart, SARS-CoV-2 Transmission and Infection
Among Attendees of an Overnight Camp - Georgia, June 2020. MMWR Morb.
a slight bias toward the group mean, resulting in an under-
Mortal. Wkly. Rep. 69, 1023–1025 (2020). doi:10.15585/mmwr.mm6931e1
estimation of the true variability of subject-level parameters. Medline
This is especially the case if, as in the current data set, sub- 3. Q.-X. Long, X.-J. Tang, Q.-L. Shi, Q. Li, H.-J. Deng, J. Yuan, J.-L. Hu, W. Xu, Y.
ject-level data are sparse. Zhang, F.-J. Lv, K. Su, F. Zhang, J. Gong, B. Wu, X.-M. Liu, J.-J. Li, J.-F. Qiu, J.
Onset of symptoms: The 317 onset of symptoms dates for Chen, A.-L. Huang, Clinical and immunological assessment of asymptomatic
hospitalised patients were collected as part of the Pa- SARS-CoV-2 infections. Nat. Med. 26, 1200–1204 (2020). doi:10.1038/s41591-
020-0965-6 Medline
COVID-19 study, a prospective observational cohort study at
4. Q. Bi, Y. Wu, S. Mei, C. Ye, X. Zou, Z. Zhang, X. Liu, L. Wei, S. A. Truelove, T. Zhang,
Charité – Universitätsmedizin Berlin (76, 77), approved by W. Gao, C. Cheng, X. Tang, X. Wu, Y. Wu, B. Sun, S. Huang, Y. Sun, J. Zhang, T.
the local ethics committee (EA2/066/20), conducted accord- Ma, J. Lessler, T. Feng, Epidemiology and transmission of COVID-19 in 391 cases
ing to the Declaration of Helsinki and Good Clinical Practice and 1286 of their close contacts in Shenzhen, China: A retrospective cohort
principles (ICH 1996), and registered in the German and study. Lancet Infect. Dis. 20, 911–919 (2020). doi:10.1016/S1473-
3099(20)30287-5 Medline
WHO international clinical trials registry (DRKS00021688).
5. T. Waterfield, C. Watson, R. Moore, K. Ferris, C. Tonry, A. Watt, C. McGinn, S.
Foster, J. Evans, M. D. Lyttle, S. Ahmad, S. Ladhani, M. Corr, L. McFetridge, H.
Software Mitchell, K. Brown, G. Amirthalingam, J.-A. Maney, S. Christie, Seroprevalence of
The following Python (version 3.8.2) software packages were SARS-CoV-2 antibodies in children: A prospective multicentre cohort study.
used in the data analysis and in the production of figures: Arch. Dis. Child. 10.1136/archdischild-2020-320558 (2020).
doi:10.1136/archdischild-2020-320558 Medline
Scipy (version 1.4.1) (78), pandas (version 1.0.3) (79), stats-
6. D. C. Adam, P. Wu, J. Y. Wong, E. H. Y. Lau, T. K. Tsang, S. Cauchemez, G. M.
models (version 0.11.1) (80), matplotlib (version 3.2.1) (81),
Leung, B. J. Cowling, Clustering and superspreading potential of SARS-CoV-2
numpy (1.18.3) (82), seaborn_sinaplot (83), simanneal (ver- infections in Hong Kong. Nat. Med. 26, 1714–1719 (2020). Medline
sion 0.5.0) (71), and seaborn (version 0.10.1) (84). Sequence 7. M. Hippich, L. Holthaus, R. Assfalg, J. M. Zapardiel Gonzalo, H. Kapfelsperger, M.
analysis used Bowtie2 (2.4.1) (85), bcftools and samtools Heigermoser, F. Haupt, D. A. Ewald, T. C. Welzhofer, B. A. Marcus, S. Heck, A.
(1.9) (86, 87), Geneious Prime (2021.0.3) (88), ivar (1.2.2) Koelln, J. Stock, F. Voss, M. Secchi, L. Piemonti, K. de la Rosa, U. Protzer, M.
First release: 25 May 2021 www.sciencemag.org (Page numbers not final at time of first release) 10You can also read