ECONOMIC AND SOCIAL BENEFITS OF PROPOSED AIR SERVICES AT SKYE AIRPORT - March 2016
←
→
Page content transcription
If your browser does not render page correctly, please read the page content below
www.hie.co.uk

ECONOMIC AND SOCIAL
BENEFITS OF PROPOSED
AIR SERVICES AT
SKYE AIRPORT
March 2016

Contents

1     Introduction to the Study                                       1

    Overview                                                          1
    Study Purpose                                                     1
    Background and Context                                            1
    Study aims and objectives                                         1
    Study approach                                                    2
    Structure of the report                                           2
2     Overview and Profile of the Regional Economy                    4
    Introduction                                                      4
    Geography                                                         4
    Issues of Connectivity                                            5
    Socio-Economic Trends                                             7
    Access to Services                                                9
    Business and Employment Trends                                   10
    Key Point Summary                                                18
3     Views of Local Businesses                                      20
    Introduction                                                     20
    Profile of the Surveyed Business Base                            20
    Business Customers, Competitors and Sector Trends                22
    Importance of Current Location for Business                      23
    Current Role of Transport for Businesses                         23
    Use of the Proposed Air Service                                  28
    Business benefits and opportunities                              30
    Key point summary                                                33
4     Case Studies and Examples from Elsewhere                       35

    Introduction                                                     35
    Donegal Airport                                                  35
    Wick John O’Groats Airport                                       40
    Newquay Airport                                                  43
    Other West Coast Air Services                                    46
5     Economic and Social Benefits of Air Services at Skye Airport   50
    Introduction                                                     50
    Long-term economic growth – Developing Key Growth Sectors        50
    Long-term economic growth – Scotland’s Economic Strategy         55
    Social Benefits and Impacts                                      57
6     Implications for the Business Case                             62
    Approach Adopted in the 2013 Study                               62
    Key Point Summary                                                65
7     Conclusions                                                    67
    The Skye Catchment Area                                          67
    Current Travel Constraints                                       67
    Potential Use of the Air Service                                 68
Short-Term Economic Impacts 68 Longer-Term Economic Outcomes 69 Social and Community Benefits 69 Implications for the Business Case 70 Concluding Remark 70 Appendix A: List of Consultees 71 Stakeholders and Community Organisations 71 Appendix B: Case Study Supporting Information 72 Donegal 72
1              Introduction to the Study

Overview
1.1    This report presents the findings of the study into the economic and social benefits of
proposed air services at Skye Airport. This follows a 2013 study which assessed the demand
and economic benefits of re-introducing an air service.

Study Purpose
1.2     Highlands and Islands Enterprise (HIE) is looking to explore the economic, social, and
community benefits of re-establishing the air service between the Isle of Skye (Ashaig,
Broadford) and the Central Belt. For the purposes of the study, the potential Skye air service
catchment area covers the Isle of Skye, Lochalsh, and the adjoining areas of Wester Ross
including Torridon, Kishorn and Lochcarron (see Figure 2.1).

Background and Context
1.3       The research brief indicates that air services from and to small rural airports “can play a
vital role in the communities they serve, creating a sense of connectedness, providing life-line
services and supporting economic growth”.

1.4    Skye was served with a scheduled air service between 1972 and 1988, operated by
Loganair. This used the existing air strip located in Ashaig, Broadford.

                                                                                        1
1.5      In 2013, HITRANS commissioned the ‘Skye Air Services Feasibility Study’ . The study
explored the demand for an air service from Skye to the Central Belt and the operational and
financial viability of such a service. The study concluded that commencing scheduled air
services from Skye would provide significant benefits to the island and adjacent region, but also
identified additional steps that were required in order to further explore its feasibility, advancing
the evidence to a stage that would enable decisions on investments to be made. This included a
need to review and assess technical aspects and infrastructure and facility requirements.
Technical feasibility studies are being undertaken in a parallel review.

1.6     The 2013 study also concluded that the potential wider economic and social growth and
benefits that could be realised on re-establishment of an air service in Skye should be reviewed
and assessed. This study therefore explores the economic, social and community benefits
(beyond the standard transport, economic and tourism indicators looked at in the 2013 study)
that an air service from Skye to the Central belt could bring, with a view to helping inform the
wider business case for re-introducing an air service to the area.

Study aims and objectives
1.7        The specific evaluation study’s aims and objectives are as follows:

      •    Review existing research on the proposed air service for Skye and Lochalsh and
           provide a brief overview of the regional economy and geographic typology of the
           catchment area.

1
    http://www.hitrans.org.uk/Documents/Skye_Air_Service_Feasibility_Study.pdf

                                                                                              1
• To provide examples or case studies of other small regional airports in Scotland (and
from elsewhere in UK / Europe if relevant) where business activity has strong linkages
with the airport, and where the presence of an air service has clearly enabled local
economic development.
• To explore and evaluate the potential economic, social and community benefits for local
businesses, social enterprises and services that would result from the proposed air
service from Skye to the Central Belt. This is designed to focus on long-term economic
and social outcomes and be presented, as far as possible, in line with Scotland’s
Economic Strategy and HIE’s Operating Plan.
• In meeting the objectives above, the research is to consider how local businesses/social
enterprises perceive the proposed air service would be of benefit and how it might
translate into overall business productivity and growth prospects for the local economy;
the impacts for fragile areas; the contribution to regional cohesion; and the role that air
services would play in achieving these.
• Review, and if appropriate update the economic benefits quantified in the 2013 Skye Air
Services Feasibility Study in light of the economic and social outcomes identified in this
study to ensure that they are fully reflected in any future business case for a proposed
air service. As part of this, it will be necessary to explain clearly how the immediate
transport and tourism impacts quantified in the 2013 study translate into longer term
economic and social outcomes, avoiding ‘double-counting’ of benefits. Any changes to
the quantified economic benefits should be evidence-based with a supporting rationale.
Study approach
1.8 The consultant team therefore adopted a multi-method approach, with a strong
emphasis on primary research.
1.9 Specifically, this included:
• A desk review of the key sectors of employment, population characteristics and current
transport accessibility between the Skye catchment area and the Central Belt;
• Three case studies reviewing the economic impacts of other airports, and analysis of
other Highlands & Islands air services to Glasgow;
• An online survey of businesses and social enterprises across the catchment area;
• In-depth consultations with 20 businesses in the catchment area;
• Consultations with 15 stakeholders, including selected community organisations;
• A review of the 2013 study and the underpinning assumptions in light of the new
primary research collected.
1.10 A list of the consulted businesses and organisations is included at Appendix A.
Structure of the report
1.11 The report is structured in the following way:
2• Chapter 2 presents the socio-economic review;
• Chapter 3 reviews the feedback from the business community and identifies the short
and longer-term impacts an introduced air service may have;
• Chapter 4 identifies the key points from the case study analysis;
• Chapter 5 discusses wider social and economic benefits that may arise from the air
service;
• Chapter 6 reviews the 2013 study economic analysis and assumptions and provides
commentary on the extent to which these assumptions remain valid or should change in
light of the research findings;
• Chapter 7 presents the report conclusions.
32 Overview and Profile of the Regional Economy
Introduction
2.1 This chapter provides a brief overview of the regional economy and geographic
typology of the catchment area including details on demographic, business and employment
trends and information on the access to services. The purpose is to understand the way in
which Skye and the surrounding study area has changed over the last number of years,
including the dynamics of the resident and business base and movements in and out of the
area.
2.2 Where data is available by Scottish Datazones (for example data on population,
employment and deprivation), this is complete for the 19 datazones that make up the catchment
area. However, where data is only available at Scottish Intermediate Zones (for example data
on business counts), this comprises five intermediate zones, including Ross and Cromarty
South West, which includes a larger area of Wester Ross (e.g. Poolewe and Gairloch). This
distinction is made clear throughout the chapter.
Geography
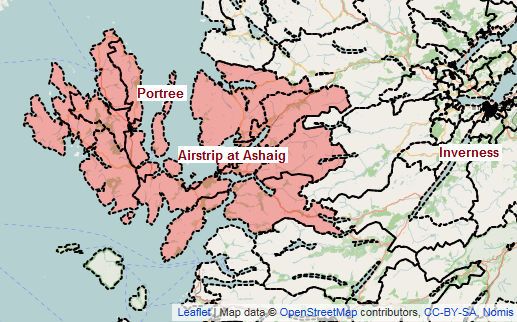
2.3 The map below shows the agreed potential Skye air service catchment area covering
the Isle of Skye, Lochalsh, and the adjoining areas of Wester Ross including Torridon, Kishorn
and Lochcarron. The catchment area described for this review is slightly smaller than the one
2
used in the 2013 study to allow greater compatibility with key data sources. The area is
situated within the Highland Council local authority area to the west/south west of the
administrative centre of Inverness, and with its largest population centre of Portree 217 miles
from Glasgow in the Central Belt.
Figure 2.1: The Skye Catchment Area
2
Skye Air Services Feasibility Study, Arup and RDC Aviation, 2013, p34.
4Issues of Connectivity
2.4 The opening of the Skye Bridge in 1995 meant that this, along with the Armadale ferry,
was the key access route to Skye from mainland Scotland. The bridge forms parts of the A87
road which connects to the A82 at Invergarry and is the key road connecting Skye to the Central
Belt of Scotland. This section details connectivity within Skye and between Skye and the
Central Belt.
By Car
2.5 Journey times and distances between four settlements in different parts of Skye –
Portree, Broadford, Dunvegan and Carbost – as calculated on Google Maps, are displayed in
Table 2.1 below. The average time between the settlements is between 30 and 35 minutes.
Table 2.1: Connectivity Within Skye
Broadford Dunvegan Carbost
Portree 31mins/ 26miles 32mins/ 21miles 25mins/ 17miles
Broadford 48mins/ 39miles 32mins/ 24miles
Dunvegan 30mins/ 20miles
Source: Google Maps
Please note: all times are based on journey time without traffic
2.6 Table 2.2 sets out the journey times and distances between the above settlements,
Edinburgh and Inverness airports. Times to Glasgow Airport are close to or above four hours
from each of the Skye settlements, and longer still to Edinburgh Airport which is closer to five
hours from Dunvegan assuming free-flowing traffic.. Inverness Airport, despite being under 100
miles from Broadford, is still a two hour drive away, and almost three hours from Dunvegan.
2.7 It should be noted that these journey times assume freely-flowing traffic, and so are
typically under-estimated. Journey times with traffic are more usually five hours (and often
longer) from Portree to Glasgow or Edinburgh, as is highlighted by respondents at paragraph
3.21. This can rise to six hours plus from more remote north/western parts of the catchment
area. Journey times to Glasgow/ Edinburgh city centres are slightly longer still. These long
journey times are extended by a number of factors such as road surface issues, (particularly on
parts of the A82 near Loch Lomond), inclement weather, and seasonal uplifts in traffic.
Table 2.2: Connectivity Outwith Skye
Glasgow Airport Edinburgh Airport Inverness Airport
Portree 4 hrs 15 mins 4 hrs 25 mins 2 hrs 30 mins
207 miles 232 miles 120 miles
Broadford 3 hrs 44 mins 3 hrs 54 mins 1 hr 59 mins
181 miles 206 miles 94 miles
Dunvegan 4 hrs 34 mins 4 hrs 45 mins 2 hrs 50 mins
220 miles 245 miles 134 miles
Carbost 4 hrs 12 mins 4 hrs 23 mins 2 hrs 31 mins
205 miles 230 miles 119 miles
Source: Google Maps
Please note: all times are based on optimal journey time without traffic, and do not account for
comfort/rest breaks
52.8 There are approximately six different car hire sites throughout Skye and Lochalsh,
three in Portree, two in Lochalsh and one with collection points throughout the catchment area.
This was stressed by business and stakeholder consultees to be an important end service to
any potential air service.
By Ferry
2.9 Aside from by the Skye Bridge, the Isle of Skye is connected to the mainland from a
ferry service between Armadale, on the south of Skye, and Mallaig. The crossing takes 30
minutes. During the summer months (April to October), there are nine return crossings per day
Monday to Saturday, and six return crossings on Sundays. Whilst this is a greater frequency
than in previous years, smaller vessels will be used at certain times of day. During the Winter
Months (October to March), the crossings fall to just two return trips per day Monday to
Saturday and one crossing on Sundays.
2.10 The Glenelg to Skye short ferry crossing also connects the south east of Skye to the
mainland. The service runs from Easter to October each year, seven days a week, with a
crossing every 20 minutes between 10am and 6pm (extended to 7pm in the summer months).
The Glenachulish ferry has a much smaller vehicle capacity, of six cars, than the CalMac
Armadale to Mallaig service.
By Train
2.11 There is no railway line directly connecting Skye to the mainland of Scotland, other
than via ferry or bus connections to mainland rail interchanges at Mallaig and Kyle of Lochalsh.
From Mallaig, there are three ScotRail trains per day running to and from Glasgow. In addition,
the Jacobite steam train service runs between Mallaig and Fort William twice daily during the
week between May and October. The journey from Mallaig to Glasgow takes around 5 hours
and 20 minutes. From Kyle of Lochalsh there are four potential daytime services to Glasgow per
day, but only three in the northbound direction, and each one requires changing trains at
Inverness, the journey taking around 6 hours in total. Connections with the overnight
Caledonian Sleeper services to/from London are possible at both Fort William (from Mallaig)
and Inverness (from Kyle of Lochalsh).
By Bus
2.12 CityLink run daily bus services between the Central Belt and Inverness and Skye
(Broadford and Portree). There are usually three services per day from Glasgow to Skye, with
an additional two services running to Fort William only. The Glasgow to Skye service takes
between six and seven hours. From Inverness, there are three services per day running to
Skye, and two services making the return trip. The Inverness to Skye service takes
approximately three hours.
2.13 Table 2.3 shows the fastest journey times by public transport (all via bus) between
Portree and Broadford and Glasgow, Edinburgh and Inverness airports, as well as the earliest
arrival time and latest departure time from each location. This shows that it is not possible to
make a day return trip between Skye and Edinburgh using public transport, as the earliest
arrival into Edinburgh (15.49) is later than the latest departure time from Edinburgh (13.05).
Similarly, making appointments (e.g. business meetings, hospital appointments etc) in Glasgow
are not realistic, as the individual would have a window of under one hour in the city. Day trips
to Inverness, however, are possible through public transport, and would allow a maximum of
five hours in the city.
6Table 2.3: Public Transport Connectivity Outwith Skye
From/ to Glasgow Bus Stn Edinburgh Bus Stn Inverness Bus Stn
Portree 6 hrs 15 mins 7 hrs 48 mins 3 hrs 5 mins
Earliest arrival time: 14.04; Earliest arrival time: 15.49; Earliest arrival time: 12.16;
Latest departure time: 15.00 Latest departure time: 13.05 Latest departure time: 17.15
Broadford 5 hrs 35 mins 7 hrs 9 mins 2 hrs 25 mins
Earliest arrival time: 14.04; Earliest arrival time: 15.49; Earliest arrival time: 12.16;
Latest departure time: 15.00 Latest departure time: 13.05 Latest departure time: 17.15
Source: http://www.citylink.co.uk/index.php
Socio-Economic Trends3
2.14 The population of the catchment area in 2014 was just over 14,500. At a growth rate of
7% since 2001, the catchment area’s population has increased at a faster rate than Scotland
4
(6%), although it is below the Highland growth (12%) over the same period (Figure 2.2).
2.15 In recent years the catchment area population increased faster than both the Highland
area as a whole and Scotland. The rate of increase was 1.2% in the Skye study area between
2011 and 2014, compared to 0.2% for Highland and less than 1% for Scotland.
Figure 2.2
Index of Population, 2001-14
Source: National Records of Scotland
114
112
110
108
106
104
102
100
98
96
94
2001 2002 2003 2004 2005 2006 2007 2008 2009 2010 2011 2012 2013 2014
Catchment area Highland Scotland
2.16 Within the catchment area, the main population centres are Portree (the principal
centre of Skye), Broadford and Kyle of Lochalsh. In 2014, the population of Portree was 2,432 -
an increase of 4% since 2011 – and a faster rate than the 1.2% increase for the catchment area
as a whole. This partly reflects movement within the catchment area as younger people in
particular move from more rural parts of the area to Portree for employment, and also housing
and services. The population of Broadford in 2014 was 930, a decrease of 1.9% from 2011,
while the population of Kyle and Lochalsh was 649, similar to 2011.
2.17 With the rise in population within the catchment area, there have been changes in its
composition. Figure 2.3 shows an ageing of the population between 2001 and 2014, with
3
All population data in this section is sourced from National Records of Scotland (NRS) mid-year
estimates
4
‘Highland’ refers to the Highland Council area
7growths in the proportions of those aged 50-79 years, with particularly strong increases in the
65-79 age group between 2011 and 2014.
2.18 Alongside this, there have been declines in the proportions of those aged 25-44 since
2001, with marked declines in the 35-44 age band in recent years (between 2011 and 2014). As
the proportion of elderly residents has increased, the proportion aged 19 and below has fallen
from 22% in 2001 to 19% in 2014, although this has levelled out more recently.
Figure 2.3
Catchment Area Population by Age, 2001-14
Source: National Records of Scotland
Aged 80 and over
Aged 75 - 79 years
Aged 70 - 74 years
Aged 65 - 69 years
Aged 60 - 64 years
Aged 55 - 59 years
Aged 50 - 54 years
Aged 45 - 49 years
Aged 40 - 44 years
Aged 35 - 39 years
Aged 30 - 34 years
Aged 25 - 29 years
Aged 20 - 24 years
Aged 10 - 19 years
Aged 0 - 9 years
0% 5% 10% 15%
2014 2001
2.19 Figure 2.4 illustrates the age profile difference between Portree and the catchment
area as a whole in 2014, showing the younger age profile of Portree. The main town has a
larger proportion in all younger age bands from 0-9 years to 40-44 years, while it has a smaller
proportion of all older age bands from 45-49 years to 75-79 years. This reflects the function of
Portree as the principal employment centre and the one where there is the greatest
concentration of services.
8Figure 2.4
Population by Age, 2011-14
Source: National Records of Scotland
Aged 80 and over
Aged 75 - 79 years
Aged 70 - 74 years
Aged 65 - 69 years
Aged 60 - 64 years
Aged 55 - 59 years
Aged 50 - 54 years
Aged 45 - 49 years
Aged 40 - 44 years
Aged 35 - 39 years
Aged 30 - 34 years
Aged 25 - 29 years
Aged 20 - 24 years
Aged 10 - 19 years
Aged 0 - 9 years
0% 5% 10% 15%
Catchment area Portree
2.20 In Highland between 2014 and 2024, the population is projected to rise by 6,597, or
2.8%. If this rise is apportioned to the catchment area then it would mean the population is set
to rise to 14,944 by 2024, although this is a conservative estimate given that the rate of growth
in the study area was six times the Highland rate of growth between 2011 and 2014. For
Scotland as a whole, the projected rise over the period to 2024 is 4.1%.
Access to Services
2.21 The Scottish Index of Multiple Deprivation (SIMD) Geographic Access to Services
domain measures the financial cost, time and inconvenience of having to travel to access basic
services, such as Post Offices, schools, GPs and retail centres. This domain is made up of the
time it takes to reach services by driving, and also via public transport.
2.22 Parts of the catchment area are considered extremely geographically deprived.
Looking at the 6,505 datazones in Scotland in 2012, 12 of the 19 datazones which make up the
catchment area are in the most deprived 200 (3%) Geographic Access to Services datazones.
Further, two datazones are in the most deprived ten in Scotland (one including Raasay and
south of Portree and one including Applecross and Torridon).
2.23 In terms of population, the 12 datazones included in the most deprived 200 (3%)
Geographic Access to Services datazones represent over 8,900 residents, or 62% of the
catchment area population. Further, the datazones in the catchment area within the 10% most
deprived in Scotland represent 10,440 residents – nearly three quarters of the area’s population
(73%), showing those resident in the catchment area to be particularly deprived of access to
important services.
2.24 As part of its remit to sustain and develop communities, HIE supports projects in fragile
areas. Fragile areas are characterised by declining population, under-representation of young
people within the population, lack of economic opportunities, below average income levels,
problems with transport and other issues reflecting their geographic location. In all, nine of the
919 datazones in the Skye catchment area are designated as fragile areas. This accounts for
around 43% of the catchment area’s population, compared to just over 12% of the Highlands
5
and Islands as a whole that live in fragile areas.
Business and Employment Trends
Business
6
2.25 Data within the business section is derived from the UK Business Count data for the
7
five Scottish Intermediate Zones comprising the catchment area . Since data at the datazone
level is not available from this source, this is the best method to assess the catchment area,
although the north of Ross and Cromarty South West would lie outside the catchment
boundaries.
2.26 In 2015, there were circa 1,150 businesses in the Skye catchment area, an increase of
6% from the previous year. As shown in Figure 2.5, since 2010, the business base has grown at
a faster rate than that across Highland (14% versus 11%), although between 2014 and 2015
this dropped below the longer term growth rate of 16% across Scotland as a whole from 2010.
Figure 2.5
Index of Business Base, 2010-15
Source: UK Business Counts
120
115
110
105
100
95
90
2010 2011 2012 2013 2014 2015
Catchment area Highland Scotland
2.27 The business base is spread relatively evenly throughout the intermediate zones in the
catchment area, with the main concentration of businesses being located on Skye (Table 2.4).
Skye has had the fastest growth in its business base over the last five years, growing by 18%
overall since 2010, strongest in the North East of the island (24%), likely to be driven by
Portree, and much higher than the Highland (11%) and Scotland (16%) business base growth
over this period. Growth has been slower in Ross and Cromarty South West (8%) and Lochalsh
(6%).
5
HIE (2014) Review of Fragile Areas and Action Areas in the Highlands and Islands, November 2014
6
UK Business Count data refers to the number of businesses, rather than number of business sites, and
includes VAT traders and PAYE employers (but excludes those below the VAT threshold).
7
These are: Skye South, Skye North East, Skye North West, Lochalsh and Ross and Cromarty South
West.
10Table 2.4: Business Base within the Catchment Area, change over time
Intermediate Zone Businesses in 2015 (n) Change from 2010 (%)
Skye North East 260 +24%
Skye North West 260 +13%
Skye South 250 +19%
Ross and Cromarty South West 215 +8%
Lochalsh 165 +6%
Total 1,150 +14%
Source: UK Business Counts
2.28 In 2015, the key sectors comprising the Skye catchment area business base were:
• Agriculture, forestry and fishing (340 businesses, 30% of the business base);
• Accommodation and food services (150 businesses, 13% of the business base);
• Construction (135 businesses, 12% of the business base).
2.29 As per Table 2.5, the catchment area business base differs from the rest of Scotland
with a higher proportion in agriculture, forestry and fishing (30% of the business base compared
to 20% in Highland and 10% in Scotland). This reflects the rural nature of the area and the
importance of food production and fishing to the local economy. Accommodation and food
services are also more concentrated, reflecting the importance of the tourism sector, while the
construction sector is broadly in line with the average. In contrast, the professional, scientific
and technical sector is under-represented, though this is starting to change (see Table 2.6
later), yet at 8% of the business base this is still well below the proportion across Scotland
(19%).
11Table 2.5: Business Base by Sector, current figures
Catchment Area Highland Scotland
Industry
2015 (n) 2015 (%) 2015 (%) 2015 (%)
Agriculture, forestry & fishing 340 30% 20% 10%
Accommodation & food services 150 13% 10% 8%
Construction 135 12% 13% 11%
Retail 95 8% 7% 8%
Professional, scientific & technical 90 8% 13% 19%
Arts, entertainment, recreation 55 5% 6% 7%
Business admin & support 50 4% 6% 7%
Manufacturing 45 4% 5% 5%
Transport & storage (inc postal) 40 3% 3% 3%
Health 35 3% 3% 4%
Information & communication 25 2% 2% 5%
Motor trades 20 2% 3% 3%
Wholesale 20 2% 2% 3%
Property 20 2% 3% 3%
Education 10 1% 1% 1%
Mining, quarrying & utilities 5Table 2.6: Business Base by Sector, changes over time
Catchment Area Highland Scotland
Industry 2010-2015 2010-2015 2010-2015
2015 (n)
change (%) change (%) change (%)
Professional, scientific, technical 90 64% (+35) 50% 48%
Health 35 40% (+10) 16% 20%
Transport & storage 40 33% (+10) 5% 6%
Property 20 33% (+5) 17% 18%
Accommodation & food services 150 25% (+30) 10% 11%
Business admin & support 50 25% (+10) 31% 33%
Retail 95 12% (+10) -6% -1%
Arts, entertainment, recreation 55 10% (+5) 9% 17%
Agriculture, forestry & fishing 340 8% (+25) 4% 2%
Construction 135 0% 4% 2%
Manufacturing 45 0% 14% 10%
Information & communication 25 0% 2% 38%
Motor trades 20 0% 12% 8%
Education 10 0% 12% 10%
Public administration & defence 0 0% 0% 0%
Wholesale 20 -20% (-5) -9% -1%
Mining, quarrying & utilities 5 n/a (+5) 70% 66%
Financial & insurance 5 n/a (+5) 8% 29%
Total 1,150 +14% +11% +16%
Source: UK Business Counts.
2.32 The catchment area economy continues to be dominated by micro-sized businesses
(between 0 and 9 employees), more so than the business base in Highland and Scotland – 92%
compared to 89% and 88% respectively. Conversely, the area is under-represented by small,
medium and large businesses when compared to the local authority area and nationally. There
were no large businesses in the catchment area and only five medium-sized employers, which
includes Highland Council and Sabhal Mòr Ostaig (SMO), the Gaelic college in Sleat, which is
part of the University of the Highlands and Islands (UHI) college network.
2.33 In 2015 there were 1,055 micro businesses, a 13% increase from 2010. However, the
biggest increase in terms of business size within the catchment area has related to the number
of small businesses employing 10 to 49 employees, which has grown by 29% since 2010,
compared to a 19% increase in Highland and 13% in Scotland. This is a positive trend,
suggesting an increase in size from micro to small businesses, although also potentially some
downsizing of medium-sized businesses too (Table 2.7).
13Table 2.7: Business Sizeband, changes over time
Catchment Area Highland Scotland
Sizeband 2010-2015 2010-2015 2010-2015
2015 (n)
change (%) change (%) change (%)
Micro (0-9 employees) 1,055 13% (+125) 11% 14%
Small (10-49 employees) 90 29% (+20) 19% 13%
Medium (50-249 employees) 5downturn than elsewhere, and the recovery has been patchier, despite a strong increase in the
number of businesses. Further, although employment overall has not risen since 2009, there
has been strong population growth, driven by those of retirement age.
Figure 2.7
Index of Employment, 2009-14
Source: Business Register and Employment Survey
110
105
100
95
90
85
2009 2010 2011 2012 2013 2014
Catchment area Highland Scotland
2.37 The tourism sector is the largest employer, with the accommodation and food services
sector employing 21% of the total (1,200 people), as set out in Table 2.8. This is almost double
the proportion for Highland (11%) and three times the proportion for the rest of Scotland (7%).
Public sector employment remains prominent in the area, with the health sector the second
largest employer, at 16% (or 1,000), in line with the Scotland proportion (16%) but lower than
that for the Highland area overall (19%). This is followed by education (10%) which is more
concentrated than elsewhere in the region and Scotland (both 7%). There is also a relative
employment concentration in the arts/entertainment/recreation sector (6%) and transport and
storage sector (also 6%), when compared to Highland (5%) and Scotland (4%).
15Table 2.8: Employment by Sector, current figures
Skye Catchment Area Highland Scotland
Industry
2014 (n) 2014 (%) 2014 (%) 2014 (%)
Accommodation & food services 1,200 21% 11% 7%
Health 1,000 16% 19% 16%
Education 600 10% 7% 7%
Retail 500 8% 11% 10%
Transport & storage 400 6% 5% 4%
Arts, entertainment, recreation 400 6% 5% 4%
Construction 400 6% 6% 6%
Professional, scientific, technical 300 6% 6% 7%
Agriculture, forestry & fishing 200 4% 2% 3%
Public administration & defence 200 3% 6% 6%
Manufacturing 200 3% 6% 7%
Wholesale 200 3% 3% 3%
Property 100 2% 1% 1%
Motor trades 100 1% 2% 2%
Information & communication 100 1% 2% 2%
Business admin & support 100 1% 5% 8%
Financial & insurance 0* 1% 1% 3%
Mining, quarrying & utilities 0*Table 2.9: Employment by Sector, changes over time
Skye Highland Scotland
Catchment
Industry
2009-2014 2009-2014 2009-2014
change (%) change (%) change (%)
Arts, entertainment, recreation 30% 16% -2%
Wholesale 22% 7% -3%
Transport & storage 14% 7% -2%
Health 11% 15% 5%
Retail 10% 1% 1%
Agriculture, forestry & fishing 10% 27% -2%
Construction 5% -1% -2%
Accommodation & food services 4% 2% 0%
Professional, scientific, technical 4% 17% 3%
Financial & insurance 0% -18% -8%
Property -10% 4% -3%
Manufacturing -15% 7% -1%
Education -21% -15% -3%
Information & communication -37% 0% -5%
Public administration & defence -42% 1% -4%
Mining, quarrying & utilities -52% 24% 15%
Motor trades -52% -3% 6%
Business admin & support -70% 2% 8%
Total -4% +5% +1%
Source: Business Register and Employment Survey.
* Indicates where data has been suppressed in line with data disclosure.
2.40 Between 2012 and 2014, the biggest increase in jobs at the four-digit Standard
Industrial Classification (SIC) code level in the Skye catchment area were in other human health
activities (200 jobs). Health is an employment sector which is expanding not just in Highland but
throughout Scotland, and is forecast to continue to do so over the next decade, particularly to
cope with the ageing population.
2.41 Increases were also notable for restaurants, the construction of buildings and the
operation of visitor attractions (all 100 jobs). This shows an increase in employment within
tourism sub-sectors, particularly in hospitality and visitor attractions – all positive indicators that
tourism is growing in the area.
Tourism Businesses
2.42 As previously shown at Table 2.5, the catchment area has a concentration of
accommodation and food services businesses when compared to Highland and Scotland, and
Table 2.6 shows this base to have grown by about a quarter since 2010. Overall, there is an
8
increasing number of overseas visitors to the Highlands and Islands and Skye is benefiting
from this interest, with many consulted stating that 2016 was the best season for visitors for
many years. The Mallaig-Armadale ferry is seen as an indicator of the total visitor numbers to
Skye given they comprise the majority of passengers. It has seen passenger numbers increase
year on year since 2008, and, at 239,500 in 2014, they were 28% higher than the 2008 level of
8
The number increased from 440,000 to 490,000 between 2012 and 2014 (VisitScotland)
17187,500. This suggests underlying growth in visitor numbers to Skye over the period, including
a 72% increase in coach parties..
2.43 As part of the online survey, businesses in the tourism sector were asked
approximately how many visitors they received in 2015. Some 61 tourism businesses were able
to give an estimate, totalling 886,000 visitors, or 14,500 on average. However, this is influenced
by a small number of large attractions, notably Eilean Donan Castle (415,000 visitors) and
Dunvegan Castle (124,000).
2.44 In 2014, Eilean Donan Castle and visitor centre overtook Rochiemurchus Estate in
9
Aviemore as the most visited attraction in the Highlands and Islands, with over 377,000 visitors
(and as the 415,000 identified in the survey response in 2.43 indicates, this has risen further).
This number grew by 6% from 354,000 in 2013, and by 11% the previous year from 320,000.
2.45 Film tourism has experienced strong growth in recent years in the Highlands and
Islands, thanks to high-profile shoots for films like Macbeth (Skye), The World is Not Enough
(Eilean Donan), Skyfall, Rob Roy and Highlander (all Glencoe), Braveheart (Glen Nevis), Harry
Potter (Glenfinnan Viaduct) and TV programmes such as Outlander (Culloden). The National
Trust for Scotland recently reported a large increase in day visits to film locations between
10
September 2014 and September 2015 . It is hoped that film tourism could be further boosted
through the Gaelic drama series ‘Bannan’ having been shot on Skye. In addition, the shooting of
such series and films generate economic benefits, particularly from the use of accommodation
and food services by visiting crew and talent.
Key Point Summary
2.46 The population of the catchment area has experienced strong growth since the turn of
the century, more so than Scotland as a whole, and in recent years the growth rate has also
outpaced Highland. However, the population is an ageing one, with a decrease in the proportion
of under 20 year olds, and a rise in those in their 50s and 60s, largely due to an influx of people
of retirement age. There are also movements of population within the catchment area, notably
from rural areas in the north and west to Portree, where the trend has been an increase of
working age people and those with families, linked to employment opportunities, housing and a
greater range of services available.
2.47 However, the small population dispersed over a large area makes transport
communication difficult (including business networking). There is also generally a lack of a main
centre which could support a critical mass of services, including business services, despite the
recent growth of Portree’s business base.
2.48 Although there has been a strong rise in the catchment area business base in recent
years, particularly in and around Portree, there remains a small business base and a very small
number of larger companies, although air intensive sectors have reasonable representation.
Tourism businesses have grown by a quarter in the last five years, a sector already strongly
represented. There has also been strong growth in higher value added sectors including
professional, scientific and technical businesses, stronger than national growth, albeit from a
low base. The Creative industry business base is also growing, partly linked to the film industry.
9
Tourism in Scotland’s Regions 2014, VisitScotland, September 2015.
10
http://mediacentre.visitscotland.org/pressreleases/scotland-feels-outlander-effect-1244066
182.49 Despite an increase in the business base, overall employment remains below pre-
recession levels, partly a result of the loss of public sector jobs. More than one in five in
employment is directly employed in Tourism (accommodation and food services). There has
been strong growth of 30% in Creative industries employment, twice the regional rate and at a
time of low growth across Scotland. However, there is low representation of certain high-value
sectors, including information and communication and financial and insurance sectors.
2.50 Despite the rising population, Skye and the surrounding catchment area continues to
suffer from access to services deprivation, with some of the more remote parts ranking among
the most deprived in Scotland. Inter-Skye connectivity remains poor with long journey times
between main settlements.
2.51 There are also very long distances/ times to the Central Belt of Scotland and to
Scotland’s international airports, whether by car or by public transport. Day trips to the Central
Belt are not feasible by public transport due to travel times. The growth in the population and
economy of the Skye catchment area has been despite these poor transport links, with
businesses and residents findings ways to overcome these challenges. The small size of local
population/ business base means that there is a strong reliance on external markets and other
business links (collaboration, networking, staff training, suppliers).
193 Views of Local Businesses
Introduction
3.1 This chapter identifies the importance travel between the Skye catchment area and the
Scottish Central Belt to the business community, and the impact an introduced air service may
have on the economy as a result. It draws on the responses of the online survey and the 20 in-
depth business interviews. There were a total of 179 online responses to the survey, including
16 from social enterprises/not-for-profit/community organisations, the feedback from whom are
covered in chapter 5.
3.2 Total responses represent around 14% of the registered catchment area business
base. However, it is worth noting that the online survey responses are heavily influenced by the
proportion of responses from businesses in the tourism sector, which should be borne in mind
when interpreting the findings of this chapter.
Profile of the Surveyed Business Base
3.3 The profile of online survey respondents is presented in Table 3.1. The online
business survey was designed to maximise the opportunity for businesses, social enterprises
and community organisations in the Skye catchment area to participate in the research, and
provide their views on the potential benefits to their organisation should the air service be
11
introduced. In all more than nine in 10 organisations responding online were from the study
catchment area - 80% from Skye, with the remaining 12% from Lochalsh and Wester Ross. This
geographic spread is broadly representative of the catchment area base, though Wester Ross is
slightly under-represented. Eight per cent of respondents are from outside of the catchment
area.
Table 3.1: Location of Surveyed Organisations
Total Businesses
Location
Number % Number %
Skye 112 80% 102 80%
Lochalsh 16 11% 14 11%
Wester Ross 2 1% 2 2%
Rest of H&I 3 2% 3 2%
Central Belt 2 1% 2 2%
Rest of Scotland 1 1% 1 1%
Other 4 3% 3 2%
12
Total 140 100% 127 100%
3.4 The sector breakdown of respondents to the online survey is presented in Table 3.2.
Just over half of businesses/social enterprises are accommodation and food service businesses
(reflecting the large number of tourism businesses that responded). There is also a good level
of representation from Creative industries businesses, a growing sector in Skye and the
surrounding area, and also from manufacturing – important for value-added employment.
11
Being an online survey promoted through local media channels a small number of businesses outwith
Skye but with an interest in providing views on an air service completed the survey
12
Total is 140 here as some businesses did not provide a response
203.5 There is an under-representation of agriculture businesses, which is normal for an
online survey of this type, given the level of self-employment in the sector; neither is agriculture
an air intensive sector. Otherwise there is a broad coverage of sectors across the sample,
providing broad representation of the overall business base.
Table 3.2: Sector of Online Surveyed Businesses
Sector Survey Sample Catchment Area
13
(n=130) (n=1,150)
Accommodation and food services 56% 13%
Arts, entertainment, recreation & other services 22% 5%
Manufacturing 11% 4%
Agriculture, forestry & fishing 8% 30%
Education 8% 1%
Wholesale, retail and motor repairs 7% 10%
Professional, scientific & technical 7% 8%
Property 6% 2%
Information & communication 5% 2%
Business administration & support services 5% 4%
Construction 4% 12%
Transport & storage (including postal) 3% 3%
Mining, quarrying and utilities 2%Table 3.3: Sector of in-depth consulted businesses
Sector Number
Accommodation & food services 7
Manufacturing 2
Retail 2
Transport & storage (including postal) 2
Arts, entertainment, recreation & other services 2
Agriculture, forestry & fishing 1
Wholesale 1
Construction 1
Business administration & support services 1
Professional, scientific and technical activities 1
Total 20
Employee profile
3.8 The profile of business size is presented in Table 3.4. Though the majority of
businesses/social enterprises were micro or small in size – 75% had less than 10 employees –
there is good representation of larger companies in the catchment area. Further, those
companies who were consulted with in-depth were typically larger. Therefore a considerable
proportion of the more significant businesses in Skye participated in the research, representing
up to 30% of the catchment area’s workforce.
Table 3.4: Employment in Surveyed/Consulted Businesses
No of Employees (total) Number %
1 23 15%
2 to 9 94 60%
10 to 24 22 14%
25 to 49 7 4%
50+ 10 6%
Total 156 100%
Business Customers, Competitors and Sector Trends
3.9 A considerable proportion of businesses rely on the rest of the UK and overseas
customers for trade. In all, more than half (54%) of surveyed and consulted businesses state
that 60% or more of their customers are from outside Scotland. Twenty-eight non-tourism
businesses (more than half those surveyed, and 80% of non-tourism businesses) have
customers outwith Scotland. Only 21% of businesses operate in a largely or exclusively local
market (where 70% or more of customers are locally based). Whilst this is at least in part
influenced by the views of businesses in the tourism sector, it still demonstrates some
significant business links beyond the local area, including food and drink export markets, as well
as the strong draw of the Skye catchment area for visitors beyond Scotland.
3.10 Suppliers to businesses are predominantly from within Scotland, including the local
area, with just a few having suppliers from outwith Scotland. Based on feedback from business
consultations, competitors are largely locally based, particularly for tourism/ hospitality
businesses, however beyond the tourism sector competitors are typically less locally based.
For some key businesses and sectors, including some manufacturing and the Creative
22industries, there are very few competitors locally or even nationally. For example, one textile
production business only has one competitor in the UK.
Importance of Current Location for Business
Benefits of Current Location
3.11 In terms of the current business location, overwhelmingly the most important factor for
businesses in Skye is the location itself i.e. their business is location-dependent. More
specifically, the impact of the landscape and buildings, many of them listed, are held in high
regard, particularly for Tourism businesses, but also for the Creative industries, where the Skye
location itself is the draw (e.g. shooting locations for the film/TV industry).
3.12 Further, a number of Food and drink companies are dependent on the Skye location
for their raw materials, but also increasingly for the area in terms of local provenance and as a
‘foodie’ destination. Similarly, the role of Skye as a tourist destination is considered important
for a range of related businesses, whilst the image of and prestige associated with Skye (the
‘Brand’) is deemed an important factor. A number of businesses also point to the good-work life
balance opportunities and high quality of life that Skye and the surrounding area affords.
“[The] physical location, the perception of Skye, the scenery is a big plus.”
“Superb landscape, wildlife and recreation opportunities make this very attractive to
visitors.”
Constraints of Current Location
3.13 Whilst the geography and landscape is the biggest locational benefit for businesses in
Skye, it also acts as their biggest constraint. For some, it is the general remoteness and
inaccessibility of their location, making it difficult to get deliveries in from suppliers; for others, it
is the impact that this has on their ability to attract customers, and/or to reach their target
market. The seasonality and weather are also highlighted as particular constraints of the
geographic location for businesses.
“Remoteness from suppliers, rest of UK, customers are local…but wider markets
are remote.”
“Long travel times. This means that there is a lot of 'dead' unchargeable time.”
Current Role of Transport for Businesses
Movement of goods
3.14 To help clarify the nature of business operations, the importance of movement of
goods, and the frequency and types of such movements between Skye and the Central Belt
was explored in the in-depth consultations, as was the incidence and impact of travel delays on
businesses. Responses highlighted that transportation, and the transport links with mainland
Scotland and the Central Belt, are clearly important issues for Skye businesses, with the
movement of goods of particular importance. Around two thirds of those consulted in-depth
transport goods to other parts of Scotland and to the rest of the UK, or rely on deliveries to
maintain their business operation. This is especially true of accommodation and food service,
retail, and food and drink businesses.
23“We send our products to Alloa to be bottled, and the weather can cause delays.
We have to contract carriers.”
“Movement of goods inward is hugely critical. When we don't receive them, the
impact is huge, in terms of [our] supply levels of food and drink.”
“[It’s] fairly critical; most material for the business has at a minimum a one-week
delivery, so the impact is huge.”
“Transport for goods inward is extremely important, but then delays aren't too bad
generally, really only during the winter months. But we are used to having to deal
with such things due to the remoteness, so we compensate [through increased
stock levels].
3.15 Whilst many businesses rely on frequent transport movements off-island for their
business, others have less of a dependence on off-island transport movements. The movement
of goods and business travel needs for some businesses is predominantly within Skye and the
surrounding area, with only occasional travel and transport movements further afield.
“I make short on-island trips for fresh produce, every day; [go] to Inverness every
two months, and maybe to Glasgow 2/3 times a year.”
Movement of staff
3.16 Movement of people is also important to businesses, and in some cases critical to
business operations. For example, one of the key Creative industries sector businesses travels
via the Central Belt to London at least once a week, making the journey by car, train and plane.
One of the key Food and drink companies’ sales and management staff make an estimated 12
business trips per month minimum to the rest of Scotland. Others, including another Food and
drink company and a textile manufacturer, often travel to other parts of the UK to visit suppliers.
Supplier travel
3.17 Some businesses receive professional services/suppliers on a regular basis. One
business, for their current job, has their architect travelling up from Edinburgh fortnightly, and
their client is up from London at least once per quarter.
Tourist travel
3.18 Given the importance of the tourism industry to the Skye economy, it is essential for
Skye businesses that tourists are able to access the area. Across all businesses consulted and
surveyed, the average number of visitors is estimated to be in the region of 14,500 per tourism
business per annum. Excluding a number of key visitor attractions with very high visitor
numbers, businesses estimate they still attract around 5,900 visitors per annum. A number of
businesses consulted in-depth indicated visitor numbers in the hundreds of thousands including
Eilean Donan Castle which attracted 415,000 visitors in 2015, with a significant growth of visitor
numbers reported over the previous five years. Another textile trading business attracted
17,000 visitors in 2014. Many of the tourism businesses consulted and surveyed also reported
considerable seasonality in visitor numbers, which although a longer season than in some other
parts of Scotland in view of its overall popularity, still has its peak in the summer months. One
of the larger hotels indicated that during the summer months they are able to serve up to 200
covers per day, although this falls to around 20 during the winter months.
243.19 Tourist businesses cater for different visitor markets. Some report visitors largely from
the rest of the UK, whilst for others, including the larger attractions and higher end
accommodation providers, visitors are from mainland Europe, North America (and particularly
Canada), Australia/ New Zealand, and Asia. Businesses report that tourists come to Skye by
various means, with many international visitors flying into Glasgow, Edinburgh or to a lesser
extent Inverness, and completing the journey by hire car, taxi or by coach. Scottish and UK
based visitors typically travel by car. A smaller proportion are lower budget and eco/
environmental tourists, making the journey by public transport either to Kyle of Lochalsh by
train, or to ferry terminals, and then being collected in some instances by hotels.
Journeys to the Central Belt
3.20 The vast majority of survey and consultation respondents (85%) travel to the Central
Belt for business purposes. A relatively high proportion of businesses and their staff make
16,17
weekly outbound and inbound trips to/from the Central Belt, with around 11% travelling at
least once a week (6% more than once a week, 5% on a weekly basis).
3.21 The majority also travel relatively frequently, with 33% travelling outbound and 28%
inbound on a monthly basis or more than once a month, and almost one third travelling
quarterly (32% inbound and 31% outbound). This means that almost 75% of businesses are
travelling at least quarterly and more than 40% monthly or more frequently. In particular, many
of those businesses consulted in-depth travel to/from the Central Belt relatively frequently,
either quarterly or monthly, with one business making weekly trips on average, either to the
Central Belt, or a through journey onwards to London.
Figure 3.1
Frequency of journey to the Central Belt
Source: ekosgen, Online Survey/Telephone Consultation of
Businesses, 2015, n=128
Quarterly
Monthly
More than once a month
Once a week
More than once a week
Daily (Mon-Sun)
Daily (Mon-Fri)
More than once daily
Other frequency
Never
0% 5% 10% 15% 20% 25% 30% 35%
Inbound return trips from Catchment Area
Outbound return trips from Catchment Area
Note, percentages represent proportion of all businesses stating on the stated frequencies; ‘other
frequency’ is unspecified frequency, assumed to be infrequent
3.22 Around a quarter of all journeys to the Central Belt involve air connections at either
Glasgow or Edinburgh, which is a relatively high proportion. This pattern of travel is supported
16
‘Outbound’ referring to return trips from Skye to Central Belt, ‘Inbound’ referring to return trips from
Central Belt to Skye
17
Note that the scope did not include specific research with inbound businesses, although some
businesses outwith the catchment area did complete an online questionnaire
25by data from the telephone consultations with businesses and community organisations, with a
number of businesses indicating that this is to visit clients or suppliers, notably in England, with
key destinations including London and Birmingham/the Midlands.
3.23 The majority of the businesses that travel to the Central Belt make the journey by car
(84%) most of the time, with a further 4% making the journey by car some of the time. Some
businesses make the journey by train on an infrequent basis - 34% do so either occasionally or
some of the time. A further 29% travel by bus either occasionally or some of the time (with the
majority of this occasional use). Journey mode doesn’t tend to vary by purpose.
Rating modes of transport
3.24 Road links (by car) to the Central Belt are generally considered to have good reliability;
53% of surveyed businesses/social enterprises say so, with a further 30% rating them average.
Most consider road transport to have average affordability. However, one third think that road
links are poor in terms of convenience, and six out of ten (59%) think that road journey times
are poor.
3.25 Other modes of transport besides car are considered inconvenient, with poor journey
times. Further, trains are considered to have poor affordability in addition to poor convenience
– the latter reflecting the limited train service in Lochaber and Lochalsh, which relies on a limited
service from Inverness to Kyle of Lochalsh, or the infrequent service to Mallaig (which also
requires a ferry service).
3.26 Transport modes are generally rated more negatively by those businesses consulted
in-depth, particularly road travel.
Identified challenges
3.27 The journey time to the Central Belt and other parts of Scotland is highlighted by many
companies as a particular challenge for business transportation with average drive times to Fort
William or Inverness identified by consultees as around 1 hour 45 minutes, and around 5 hours
to the Central Belt (see ‘Issues with connectivity’ section in Chapter 2). Some businesses are
resigned to this as a fact of living in Skye/the Highlands and Islands, and are generally
accepting of it, given the lack of alternatives to date.
“Road travel causes stress! There is no real alternative; buses take too long, and
the train is incredibly expensive – I was once quoted £600 for a return to London.”
“The length of time [is the biggest challenge for any journey], but this is just a fact.”
3.28 Driving/road conditions are also a significant challenge. The nature of the roads is
the single most contributory factor in this. For companies who are heavy users of the road
network, the A82 is regarded as particularly hazardous, with the volume of traffic (often tourist)
and weather conditions – particularly during winter – contributing to making it a stressful
journey.
“The A82 is a very poor road – there is often flood water, debris from fallen
stones/rocks, which with the journey time causes significant stress.”
“It is too slow – road improvements bring more cars so there is more
congestion/competition, despite intentions to make things faster.”
26“To Edinburgh [on the A9], the journey is fine, but to Glasgow on the A82, it is an
absolute nightmare – not a good journey. A hazardous, stressful road.”
3.29 Another company pointed to the lack of good modal linkages, making multi-modal
journeys problematic, e.g. the alignment of ferry sailings with bus or rail timetables. This can be
compounded by the lack of capacity on public transport during the summer with respect to
tourist visitors.
“I have frustration at modal linkages…there doesn’t seem to be any joined up
timetabling.”
“On public transport, and buses in particular, there are severe capacity issues,
especially during summer.”
Impact of transport links
Reporting of negative impacts
3.30 The weak transport links constrain business performance in a variety of ways, as
illustrated in Figure 3.2. Some 81% of businesses report that the current transport links
negatively impact on their ability to get the customer to visit the business, whilst 80% think that
the transport links adversely affect their business costs.
3.31 Further, almost three in four (74%) state that transport links negatively impact on their
levels of sales, which will be affected by the challenges of getting customers to visit, and the
ability to attract and retain customers (where 70% report this a negative consequence of current
transport links). Negative impacts are also reported in relation to the ability to network (71%)
and to invest in the business (62%). There are also considerable negative effects on staff
recruitment/retention (for 55% of businesses) and on productivity (54%).
Figure 3.2
Business constraints due to transport links between
Catchment Area and the Central Belt
Source: ekosgen, Online Survey /telephone consultation of
Businesses, 2015, n=122
Networking (n=98)
Ability to get customer to visit the business (n=108)
Investment in the business (n=79)
Business costs (n=109)
Staff recruitment/retention (n=88)
Customer/client attraction/retention (n=110)
Productivity (n=91)
Level of sales (n=104)
0% 20% 40% 60% 80% 100%
Severe negative impact Moderately negative impact
Slight negative impact No constraint
27You can also read