Kern County's 2013 Update to the Coordinated Public Transit-Human Services Transportation Plan - Final November 21, 2013
←
→
Page content transcription
If your browser does not render page correctly, please read the page content below
Final November 21, 2013

Kern County’s
2013 Update to the Coordinated
Public Transit—Human Services
Transportation Plan

                Kern Council of Governments
                1401 19th Street, Suite 300
                Bakersfield, CA 93301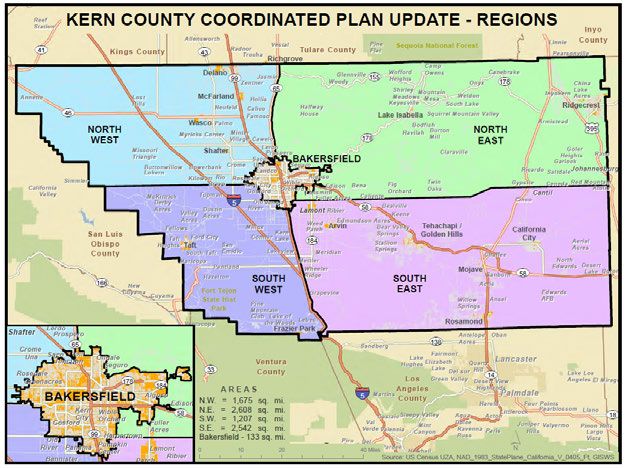
This page intentionally left blank
2013 Update to the Coordinated Public Transit‐Human Services Transportation Plan
Kern County’s 2013 Update to the Coordinated
Pubic Transit‐Human Services Transportation Plan
Table of Contents
Executive Summary
I. Introduction ‐ This Update’s Purposes 1
About Federal Statute and Requirement 1
Kern County’s 2007 Initial Coordinated Plan and This 2013 Update 2
II. Context – What’s Happened Since the 2007 Coordinated Plan? 3
Recommendations of the 2007 Plan 3
Key Planning Initiatives Since 2007—Issues and Recommendations 4
Kern County’s Target Population Characteristics 10
III. Mobility Needs and Gaps – What is Reported? 17
Plan Update Sub‐regions 17
Agency E‐Survey Findings 18
Key Stakeholder Interview Themes 24
IV. Resources – What Transportation is Available? 27
Available Public Transportation 27
Distribution of transit resources across Kern County 34
V. Priorities For Implementing Responses –What Opportunity Exists? 35
Coordination Interests and Priorities for Response 35
Themes and Mobility Gaps 35
Areas of Coordination Interests 39
Coordinated Plan Update Priorities 40
VI. Appendices 45
Appendix A – Kern County Transit Development Plans (2008‐2012): Summaries 46
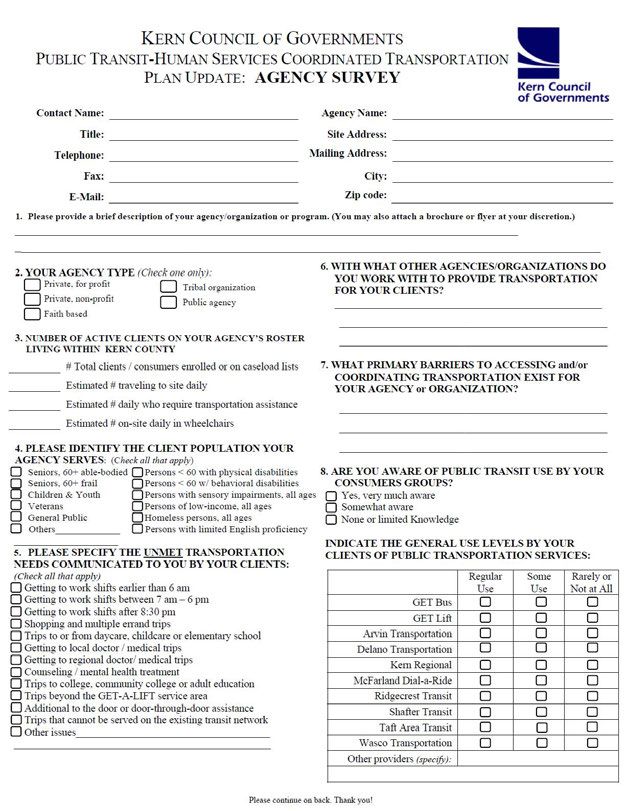
Appendix B – Stakeholder Agency E‐Survey 55
Appendix C – Outreach Meeting Notes 59
Appendix D – Inventory of Responding E‐Survey Organizations 68
iii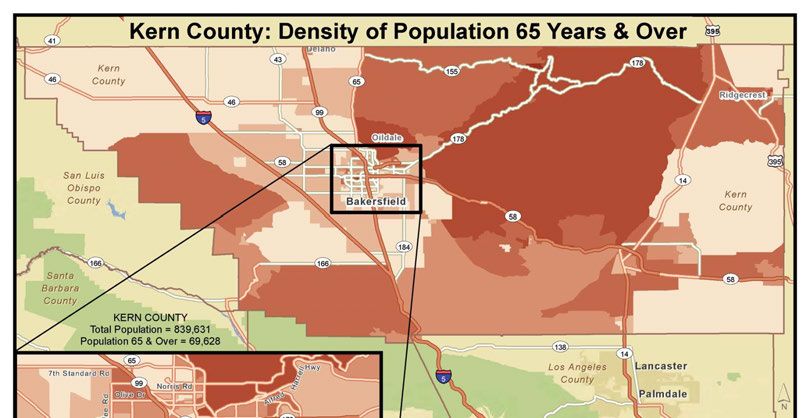
2013 Update to the Coordinated Public Transit‐Human Services Transportation Plan

       This page intentionally left blank

                                                                         iv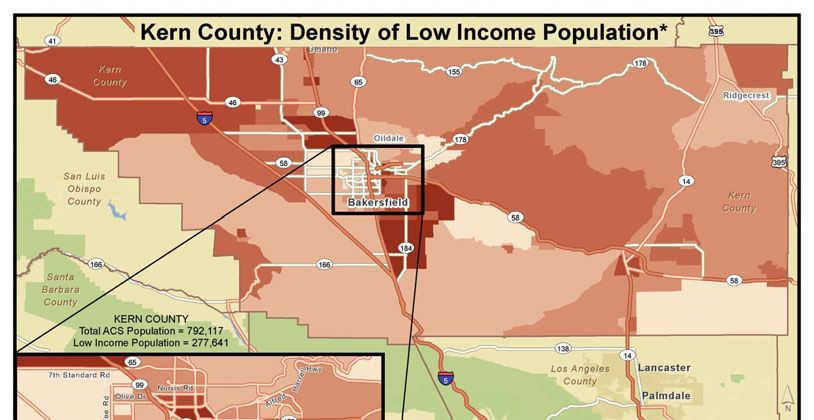
2013 Update to the Coordinated Public Transit‐Human Services Transportation Plan
Kern County’s 2013 Update to the Coordinated
Pubic Transit‐Human Services Transportation Plan
Executive Summary
Purpose
Kern Council of Governments is responding to Federal guidance that requires coordinated transportation
planning for three populations:
older adults
persons with disabilities
individuals of low income
This Coordinated Plan Update builds upon the original 2007 Coordinated Plan to provide updated strategic
direction to Kern Council of Governments (Kern COG), the public transit operators and human service agency
stakeholders in defining opportunities, strategies and projects to help address mobility needs of Kern County
older adults, persons with disabilities and low‐income residents. Goals establish priorities while strategies
and projects suggest direction to be pursued as new funding becomes identified and coordinated responses
constructed.
Approach
Activities by consultant AMMA Transit Planning included:
Initial Steering Group meeting of key stakeholders with subsequent outreach to Kern COG’s SSTAC.
Reviewed core plans to document available transit resources and shed light on mobility needs.
Documented demographic changes among Kern’s 856,000 residents (2012), including overall
population growth by 33% since 2000 and an increase in lowest income individuals from 16.8% to
21% , with 50% of the County’s residents now of Hispanic origin.
Conducted countywide E‐survey to stakeholder agencies, securing 136 organizational responses.
Undertook stakeholder interviews and a workshop involving almost 40 individuals and 18
organizations to identify mobility needs and explore coordination and partnership opportunities.
What Key Needs Were Identified?
High levels of public transit usage exist within metropolitan Bakersfield, with 7.2 million passenger trips
provided last year and six in ten agency personnel aware of Golden Empire Transit District (GET) Bus services
and reporting consumer usage levels. Specialized transportation within Bakersfield’s sphere of influence is
significant with Golden Empire Transit District’s GET‐A‐ Lift Paratransit service, North of the River
Consolidated Transportation Services Agency (CTSA), Bakersfield ARC and New Advances for People with
Disabilities (NAPD) transportation programs, among others.
v
2013 Update to the Coordinated Public Transit‐Human Services Transportation Plan
Comparable levels of awareness of the inter‐community Kern Regional Transit (KRT) network exist, with 62%
of agency respondents reporting consumers’ regular use or some use. Much less agency knowledge or use of
local transit services is reported for transit services operating in Kern County’s outlying, rural communities.
Agencies report that one in eight consumers (over 1 million persons combined caseload) are traveling daily
and that one in four of those persons (24%) need some type of transportation assistance.
Regional Trip‐Making Needs
KRT recognized as providing important inter‐city connections, for seniors among others, although
buses reported as frequently at capacity and more vehicle trips desired daily from multiple towns.
Most frequently reported need in interviews and high ranked by e‐survey is for trips into Bakersfield
from the outlying communities for health care, education and some employment.
Medical trip purpose needs ranked highest in e‐survey, followed by trips beyond the local providers’
service area in agency survey.
Anticipated expansion in medical trip demand reported with full implementation of Health Care
reform; new patients being enrolled now, anticipating they will need to travel to doctors and
medical appointments.
Closing of the courthouse in Taft is an example of new trip needs (now into Bakersfield); eastern
communities of Ridgecrest, Taft and Tehachapi as well as southwestern Frazier needing additional,
expanded transit connections.
Metropolitan Bakersfield Identified Needs
Challenges of learning GET’s new bus routing and stop locations: has benefited some agencies like
the Independent Living Center; some concern about no stops now at key human service or health
care destinations including Greater Bakersfield Legal Assistance, BARC.
Security concerns about transferring at the central hub due to crime element.
Security concerns in walking distances to new bus stops in crime‐ridden neighborhoods.
Lowest income individuals cannot afford bus tickets or passes; rely upon agency assistance.
Other
Agency purchase of bus passes on behalf of clients is sometimes difficult with bulk pass purchase
arrangements, limiting the flow of human service funding to subsidize bus passes.
Bus stop amenities for shelters, lighting and benches are desired for metropolitan and rural stops.
Approximately $600,000 in Prop. 1B PTMISEA funding has been identified for GET and KRT bus
shelters throughout metro Bakersfield and KRT/GET joint bus stops. These shelters cannot be
implemented until CA Prop. 1B bonds have been sold and allocated to the projects.
Reports adequate funding for capital, vehicle acquisition; difficulty in securing operating dollars to
expand or develop new services in both rural communities and Metropolitan Bakersfield, with
exception of Delano, which was newly designated as a small urban community.
Information Needs
Some knowledge of GET Bus Trip planner but still limited awareness of trip discovery tools; no
knowledge of Google Transit trip planning assistance. Small rural providers and KRT not on Google
Transit. Most of the rural transit operators do not have the in‐house staff capability to install and
maintain upgrades to this type of computer service.
vi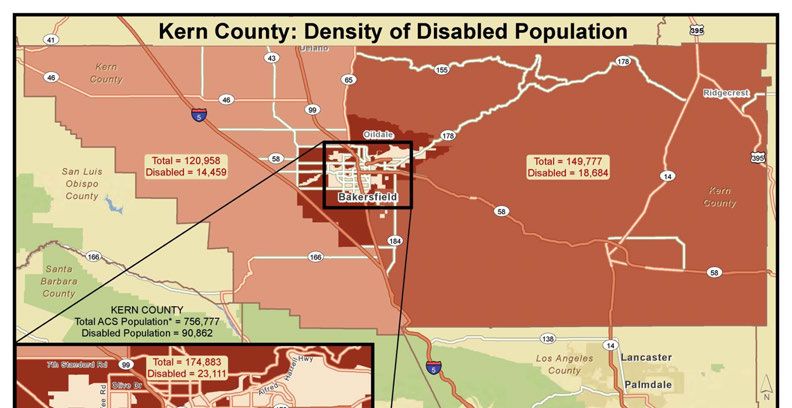
2013 Update to the Coordinated Public Transit‐Human Services Transportation Plan
Limited understanding of public transit planning processes by human service agency personnel with
almost no knowledge of its opportunities for input.
What Partnership and Coordination Opportunities Exist?
Various collaborative and coalition groups exist within Kern County representing resources that can extend
traditional public transit initiatives. These include: the Public Health Department internal working groups,
Family Resource Centers, Kern Network for Children including forty‐four Headstart Centers; Salvation Army
facilities around the county, United Way, Community Action Partnership of Kern (CAP), the Homeless
Collaborative of Greater Bakersfield Legal Assistance and a tribal collaborative, the Owens Valley Career
Development Center.
Coordination of services currently exists between GET‐A‐Lift, North of the River CTSA and New Advances for
Persons with Disabilities around individual specialized transportation trips. Opportunity for some modest
expansion of this may exist, particularly in relation to increasing health care trip demand where new health
care partners can be developed with existing coordinated programs.
New coordination opportunities may exist with the health care industry as it confronts health care reform.
Working with County public health nurses and entities such as Clinica Sierra Vista and NAPD, new
coordinated transportation solutions can be developed.
New information strategies can be developed through coordinated responses that could involve the 2‐1‐1
and 5‐1‐1 organizations, the United Way, Kern COG and GET Bus, as well as each of the County’s public
transportation providers. Exploring One‐Call/One‐Click capabilities to consolidate information about
available transportation and aide riders in “trip discovery” will greatly benefit older adults, persons with
disabilities and persons of low‐income, bringing new users to Kern County’s public transportation programs.
Goals and Objectives for Strategic Direction
Three goals are proposed to direct actions that will improve the target groups’ mobility:
Goal 1 – Continued Development of Kern County’s Metropolitan and Rural Transit Programs
Goal 2 – Grow Partnerships to Expand Coordinated Transportation Capacity
Goal 3 – Expanded Transit Information Resources
Goal 1 – Continued Development of Kern County’s Metropolitan and Rural
Transit Programs
1.1 Improve access to jobs, education and services by implementing recommendations of the
Metropolitan Bakersfield Transit System’s Long‐Range Plan, as funding allows. Strategies include:
increase GET frequencies and service in key corridors; move to more direct routes that improve
travel speed, with connectivity between routes that is as seamless as possible; promoting non‐
traditional service in the outlying areas.
1.2 Improve access to jobs, education and services between Metropolitan Bakersfield and the outlying
communities, as funding allows. Strategies include: increase frequencies and the number of runs
vii
2013 Update to the Coordinated Public Transit‐Human Services Transportation Plan

    on existing KRT routes; promote non‐traditional service in the outlying areas as well as between
    these and key metropolitan Bakersfield destinations.
1.3 Improve access to jobs, education and services within each of Kern County’s rural communities by
    implementing communities’ Short Range Transit Plan recommendations, as funding allows.
    Strategies include: continued attention to improving local services and enhancing connections
    between KRT services and the rural communities.
1.4 Enhance the use of public transit for the target groups. Strategies include: review procedures for
    human service agency purchase of bus passes to facilitate these transactions; address key travel
    patterns of the target groups by working to ensure access, reduce riders’ travel times and increase
    transit routing efficiencies, as funding allows; review bus stop access for key destinations of the
    target group members, assess transfer locations to develop destination‐oriented information that
    identifies transfer locations and timing for regional trip‐making.
1.5 Expand transportation options available to the target groups, as funding allows, in order to
    efficiently meet diverse travel needs. Strategies include: continued attention to the family of
    services that include GET‐A‐ Lift, North of the River CTSA, New Advances for People with Disabilities
    (NAPD) and other focused but existing specialized transportation programs; pursue support of
    vanpool, mileage reimbursement and other modalities; pursue funding for capital and operation of
    these services.
1.6 Enhance the customer experience through improved on‐street infrastructure, as funding allows.
    Strategies include: promote bus benches, shelters, lighting and path‐of‐access improvements at and
    in the vicinity of key destinations used by the target groups.
1.7 Build community support for public transportation among the target groups and their agency
    stakeholder representatives. Strategies include: continued and expanded outreach to agency
    collaboratives and coalitions to report on and garner support for new transit initiatives, such as GET’s
    “Stuff the Bus” project with CAP and a local Headstart specifically, and public transit generally; use
    technology to build “Friends of Transit” stakeholder lists, using social media strategies that both
    inform and invite exchange.

Goal 2 – Grow Partnerships to Expand Coordinated Transportation Capacity
2.1 Grow mobility management capabilities within transit agencies and establish within human service
    systems to promote use of available transit services. Strategies include: Develop mobility
    management capabilities within KRT and drawing upon GET experience for early training; develop
    human service agency mobility managers, such as within the United Way and Community Action
    Agencies, to help educate riders and prospective riders and facilitate two‐way dialogue with public
    transportation planners; expand the SSTAC to include agency‐level mobility managers and
    representatives of human service agency collaboratives.
2.2 Develop tools to pilot “coordinated trip brokering” among existing coordination partners for hard‐
    to‐serve trips while recognizing mission‐specific constraints of agencies. Strategies include:
    constructing Memoranda of Understanding (MOUs) that are agency mission‐specific and focused on
    individual trips, working within sponsor agency constraints; identify reimbursement options.
2.3 Build transit capacity to address increased demand for key trips, particularly health care trips.
    Strategies include: actively explore new partnership opportunities, particularly with health care

                                                                                                      viii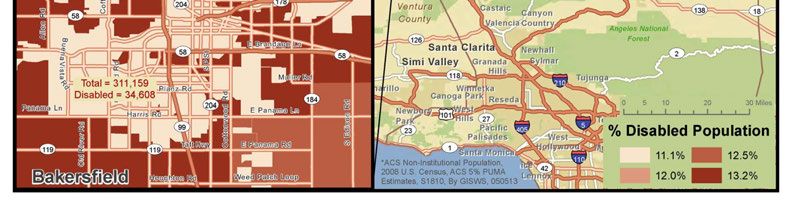
2013 Update to the Coordinated Public Transit‐Human Services Transportation Plan

        programs, to develop coordinated service solutions to increased demand for health care‐related
        trips.
    2.4 Encourage new partnerships for expanded vanpool solutions for work‐type trips or education trips
        beyond the City limits and seek start‐up funding. Strategies include: promote and expand the
        CalVans program, among other van pool initiatives; explore grant options for expansion by front‐
        loading the planning, capital and participant subsidy for vanpools.
    2.5 Develop volunteer driver mileage reimbursement with county community services and the CTSA:
        strategies include: seek funding for volunteer driver mileage reimbursement program, including the
        model where participants find their own driver and the program reimburses at modest levels of
        $0.35 to $0.40 per mile, as a solution for hard‐to‐serve trips and isolated regions.

    Goal 3 – Expanded Information Resources
    3.1 Promote consolidated transportation information so that individuals can more readily discover
        transit trip opportunities. Strategies include: get all of Kern County’s public transit operators onto
        Google Transit‐type platforms (general transit feed specifications), with funds to maintain this
        information; explore information portal capabilities with the 2‐1‐1, 5‐1‐1 and United Way
        organizations to build One‐Call/One‐Click transit information.
    3.2 Support mobility manager capabilities at transit agency and human service agency levels to aide in
        “trip discovery”. Strategies include: continued attention to moving forward the Transit
        Development Plan recommendations for each of the rural communities’ transit programs, simple
        ride guides or takeaways that show transit routing and stops in relation to key destinations; web‐
        based tools and printable, PDF flyers and other information pieces that promote GET’s Trip Planner,
        Google Transit and developing One‐Call/One‐Click information capabilities.
    3.3 Promote targeted awareness of specialized transportation. Strategies include: promote transit for
        individualized, one‐time trips that can be served; promote expanded travel training capabilities – to
        more consumers; web‐based and other travel‐training tools for agency personnel.
    3.4 Use mobility manager tools to promote targeted awareness of alternative transportation modes.
        Strategies include: outreach to agency gatekeepers regarding coordinated trip opportunities,
        mileage reimbursement programs, promoting an expanded vanpool or shared rides for selected
        areas and work or recurring trips, among other non‐traditional options.
With these goals as the prioritized direction for Kern County’s improvement of mobility of older adults,
persons with disabilities and individuals of low‐income, the identified objectives and strategies
represent a menu of choices. Among these, it will depend upon interested, willing and able
organizations to take the lead and develop the specific opportunities to which these objectives and
strategies point.

 Promoting interested, willing and able leaders around these opportunities will be the responsibility of
all stakeholders. While Kern COG has responsibility for creating this Coordinated Plan Update, realizing
its potential will be the work of numerous entities, both public transit and human service organization
personnel, who can collectively and individually work towards improved mobility of Kern County
residents.

                                                                                                          ix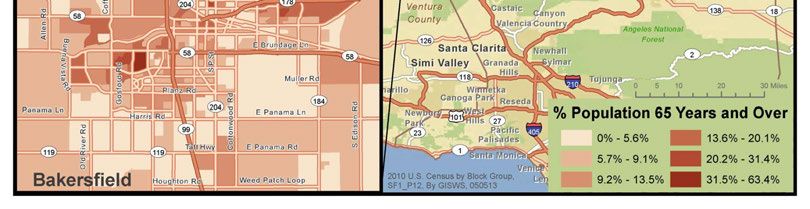
2013 Update to the Coordinated Public Transit‐Human Services Transportation Plan

       This page intentionally left blank

                                                                         x
2013 Update to the Coordinated Public Transit‐Human Services Transportation Plan
Kern County’s 2013 Update to the Coordinated
Public Transit‐Human Services Transportation Plan
I. Introduction – This Update’s Purposes
About Federal Statute and Requirement
The passage of SAFETEA‐LU in August 2005, established a new planning requirement at the local level.
Federal authorizing legislation of the Safe, Accountable, Flexible, Efficient Transportation Equity Act: A
Legacy for Users‐Public Law 109‐059 linked two existing programs, §5316 – Job Access and Reverse
Commute and §5310‐ Elderly and Persons with Disabilities capital program, with a third initiative called
§5317 New Freedom program, through a coordination plan. The intent was to identify the
transportation needs of three populations:
individuals with disabilities
older adults and
persons of low income
By identifying such needs, as well as the resources in place to address these, it was anticipated that two
service sectors of public transportation and human services could coordinate to better address mobility
concerns. Specifically, federal guidance requires that the plan identifies strategies for meeting local
needs and the prioritization of transportation needs and projects for funding through Sections 5310,
5316 or 5317 and that strategies of coordination be a part of the fabric for addressing needs.
Changes came about with the authorization of new Federal legislation, MAP‐21 (Moving Ahead for
Progress in the Twenty‐first Century‐Public Law 112‐141 in July 2012, which consolidated numerous
programs of the Federal Transit Administration. This included combining §5310 and New Freedom
programs and removing the JARC program altogether, although its funding was generally combined into
other FTA programs. However, the Coordinated Plan requirement remains along with the requirement
that it be updated every four years. At present, the relevant Federal guidance can be found in Circular
FTA C 9070.1F for Section 5310 program, Circular FTA C 9050.1 for Section 5316 JARC program and
Circular C 9045.1 for Section 5317 New Freedom program.
12013 Update to the Coordinated Public Transit‐Human Services Transportation Plan
Kern County’s Initial Coordinated Plan and This 2013 Update
In 2006‐2007, Kern Council of Governments prepared its Coordinated Human Services Transportation
Plan in response to SAFTEA‐LU requirements. Its core findings and recommendations are summarized
subsequently. This 2013 Coordinated Plan Update augments the 2007 Coordinated Human Services
Transportation Plan, serving several new purposes:
1. To reflect the continually changing scene within the Kern County with regard to transportation
demand and transit resources available to the target populations of older adults, persons of low
income and persons with disabilities.
2. To document new mobility concerns of these target groups while validating those identified
previously.
3. To identify coordination projects and strategies to address mobility needs of the target groups.
This Update does not replace the work done in 2007 – much of that still stands and it remains a valuable
resource document for coordination of public paratransit services in Kern County. The Update does
serve, however, to establish current documentation of mobility needs for the three target populations,
older persons, and persons with disabilities and persons of low‐income. The Update proposes priorities
that can support seeking additional funding or offer guidance for the use of scarce resources for the next
several years.
To develop this 2013 Coordinated Plan Update, Kern COG staff and the consultant team undertook:
Presentation and dialogue with a Steering Group and with Kern COG’s SSTAC (Social Services
Transportation Advisory Council);
Review of core plans to document available transit resources, to shed light on mobility needs
and to identify transit‐related recommendations relevant to these populations;
Documented demographic changes among Kern’s 856,000 residents (2012), including overall
population growth by 33% since 2000 and an increase in lowest income individuals from 16.8%
to 21% , with 50% of the County’s residents now of Hispanic origin;
Countywide e‐survey distributed to Kern COG’s 2,000+ contact database; securing 136 useable
organizational responses.
Stakeholder interviews and one workshop, involving about 40 individuals and 18 organizations.
The resulting recommended priorities, presented in Chapter 5, were developed from analysis of these
multiple information sources.
22013 Update to the Coordinated Public Transit‐Human Services Transportation Plan
II. Context – What’s Happened Since the 2007
Coordinated Plan?
This chapter describes Kern County’s public transit providers planning efforts for the near and longer‐
term future. Some of these changes respond to the significant population changes the County is
experiencing, in terms of substantial growth and other changes, also documented in this chapter.
Recommendations of the 2007 Coordinated Plan
The Kern County 2007 Human Services Coordinated Transportation Plan identified a wealth of public
transportation services. The County’s key transportation programs include:
City of Bakersfield’s GET Bus comprehensive public transportation system, including GET‐A‐LIFT
and the North of the River CTSA.
Smaller communities around the county operating local transportation services
Kern Regional Transit providing inter‐city regional connections
Amtrak trains and Greyhound inter‐city bus providing intra and inter‐state connections
Other human service transportation providers operating around Kern County, generally for their
own constituencies.
The County’s low density rural communities and its sprawling metropolitan Bakersfield area make it
difficult to serve efficiently with public transportation. New development identified at the time of the
2007 Coordinated Plan, exacerbates this problem as developers often locate new housing in areas not
well served by public transit.
Other key findings from the 2007 Coordinated Plan included:
Public transit’s operating hours and days are not well coordinated, specifically for educational
trip purposes, among others.
Dial‐a‐ride eligibility policies vary considerably among communities and there was interest in
some standardization of these.
Kern Regional Transit coordinated transfers but consumers report difficulty understanding and
navigating the County’s public transportation network.
There was no centralized information source for transportation, either by telephone or on
websites, with each individual transit provider maintaining its own, separate information.
There appear to be opportunities for coordination and to reduce overlap in transportation
services.
32013 Update to the Coordinated Public Transit‐Human Services Transportation Plan
Priorities for the 2007 Coordinated Plan were identified as:
Increase and establish more frequent communication and collaboration around transportation
topics.
Establish a centralized transit information capability, including in multiple formats and
languages.
Increase the cost efficiencies of transportation, including specialized transportation.
Identify and eliminate duplication.
Identify and pursue new funding sources.
Integrate transportation and land use, including planning for pedestrians and providing for
better access for public transit.
Key Planning Initiatives Since 2007‐‐ Issues and
Recommendations
Between 2008 and 2012, Transit Development Plans were prepared for city transit systems and selected
transit corridors. Public transit programs generally identify improvements through a process of short
and long‐range transit development plans. These provide both strategic direction and concrete,
pragmatic actions to their public transit audiences. Kern COG has successfully competed for state and
federal funding to undertake these, conducting numerous planning efforts on behalf of the County’s
municipalities. During this same period, Golden Empire Transit District undertook a comparable Long‐
Range Planning effort, whose near‐term recommendations were implemented in fall 2012.
The following pages summarize the major issues, findings and recommendations identified in these
various studies, including:
two plans focusing on Bakersfield – the long‐range plan for Golden Empire Transit and a follow‐
up focusing on the plan’s implications for Kern Regional Transit regional lines traveling to and
from Bakersfield, and
five studies of the smaller municipal city transit systems (Arvin, California City, Delano, Taft, and
Tehachapi), one transit corridor study (Arvin‐Lamont‐Bakersfield)
Direction from Transit Planning Processes – Metropolitan Bakersfield and Kern
Regional Transit
GET’s 2012 Long‐Range Plan focused on recommendations to enhance transit in Metropolitan
Bakersfield in order to provide faster service for riders and to attract new riders to transit. The plan
identified several general transit‐planning principles to guide the recommended changes, including:
42013 Update to the Coordinated Public Transit‐Human Services Transportation Plan
establish direct routes, maximize spacing between stops in order to minimize travel times, avoid large
one‐way loops in routes, and avoid out‐of‐direction travel.
In order to accomplish this, the plan recommended making transit service faster by developing new
express routes, straightening existing routes, providing more direct cross‐town routes, reducing reliance
on timed transfers at transit centers, and providing amenities for passengers at bus stops.
The plan identified three phases: Short‐Term (2013‐2020), Mid‐Term (2021‐2025), and Long‐Term
(2026‐2035). GET is currently implementing short‐term modifications to its system. GET has begun
implementing the Short‐Term Plan.
The Short‐Term plan establishes a new transit center at CSU Bakersfield, provides increased service to
CSU Bakersfield and Bakersfield College, and develops new categories of transit service. This plan
establishes five categories of transit service: rapid bus, with stops every two‐thirds of a mile and service
every 15 minutes; crosstown routes, with stops every one‐sixth to one‐quarter of a mile and running
every 30 minutes; circulators, with stops every one‐quarter mile and running hourly; express routes;
and circulator/express routes, a combination of local and express service running hourly.
The Mid‐Term and Long‐Term plans would expand on the changes made in the short‐term plan. These
would establish a grid system with transfers made throughout the system, phase out the downtown and
southwest transit centers, introduce commuter rail service, and upgrade the rapid bus to bus rapid
transit with dedicated rights‐of‐way. The mid‐term plan has two options, depending on funding; the
fully‐funded option assumes passage of a county‐wide half‐cent sales tax for transportation.
The plan also reviewed alternative models for outlying areas of Bakersfield, including general public dial‐
a‐ride, but in the end felt that fixed‐route service remains appropriate in these areas.
The Kern Regional Transit Bakersfield Service Analysis, completed shortly after the GET long range plan,
identified proposed changes in GET which would affect KRT routes serving Metropolitan Bakersfield and
recommended strategies for both GET and KRT to coordinate these changes, through schedules, routing,
and fare coordination.
Direction from Transit Planning Processes ‐ Municipal Providers and Corridor
Planning
Transit Modes
Transit studies recommended different types of mode‐changes for some routes. These included
substituting demand‐response for fixed‐route, implementing fixed‐route instead of or supplementing
demand response, and establishing vanpools as an alternative to existing transit modes.
52013 Update to the Coordinated Public Transit‐Human Services Transportation Plan
The Arvin plan recommended replacing a fixed‐route between Arvin and Taft College with a vanpool
program, as a potentially more cost‐effective option. The same plan recommended implementation of a
vanpool between Arvin and Tejon Ranch to meet the transportation needs of persons working in the
Tejon Ranch area.
In Taft, where transportation within the community was provided by a general public demand response
system, the plan recommended introducing a fixed‐route system and changing the demand‐response
system to a service limited to seniors and persons with disabilities on weekdays; Saturday demand
response service would be available to the general public on Saturdays, with preference given to
persons with disabilities.
Although in Taft the recommendation was to establish a fixed‐route instead of demand‐response for the
general public, the Kern Regional Transit Bakersfield Service Analysis recommended that one of the
current inter‐community fixed‐route systems, the Edison‐Bakersfield route, might be more cost‐
effective as a demand‐response system, because of the shortness of the route and the low ridership.
Marketing, Information, Outreach
Every study and plan reviewed for this study considered outreach and marketing an important
recommendation. Recommendations included marketing to reach both current and potential riders,
provision of information in Spanish as well as English, outreach to key stakeholder agencies to spread
the word about transit, and introduce technology tools in marketing public transit.
While some marketing and outreach recommendations focused on one community, most involved some
multi‐community outreach recommendations, given the regional nature of many needed trips. Various
opportunities were identified for marketing coordination among Kern County’s transit systems, with
neighboring Counties’ transit programs and between transit and other community agencies.
Some studies, including Arvin and Delano, recommended marketing campaigns given limited
awareness of the transit systems in the community. In Arvin, while the vast majority of survey
respondents were aware of the transit system, only one‐fourth of the seniors were aware of it. In other
communities, people wanting information about the transit system asked friends, relatives, or bus
drivers, instead of contacting the city or transit system.
In specific cases, marketing campaigns were recommended to familiarize the community with
recommended changes in service, either implementation of a new fixed‐route system or changes to a
fixed‐route or dial‐a‐ride system.
Some outreach recommendations specifically mentioned targeted outreach. For example, in Taft the
recommended marketing plan included a focus on social service outreach to reach low‐income families.
The Tehachapi plan recommended continued outreach to agencies to disseminate information and
62013 Update to the Coordinated Public Transit‐Human Services Transportation Plan
identify schedule needs for employees, and outreach to such current or potential riders as students,
employees, and low‐income families.
Several plans identified the need to provide transit information in Spanish as well as English, in a
county with a large Spanish‐speaking population. Related to this was a recommendation in Delano to
train drivers on a few transit‐related Spanish phrases to facilitate basic communication with this group
of riders.
Other recommendations related to provision of information included a need to distribute information
and schedules to key stakeholders, including medical facilities, government centers, senior centers,
schools, and community centers; provision of information at community events; provision on
information on how to use transit, including recommendations for some type of transit training or
transit orientation possibly provided by a transit docent.
A final information recommendation focused on Kern Regional Transit, recommending compilation of its
route information into the GTFS (general transit feed specification) format, for use on Google Transit’s
trip planner. Inclusion of KRT route information on Google Transit is an important way to enable
regional trip‐planning for current or potential transit riders.
Transit System Coordination
Two types of transit system coordination were recommended in the plans reviewed: 1) fares and 2)
scheduling transfers and transfer locations.
There were recommendations in two plans – Arvin‐Lamont‐Bakersfield Corridor and Bakersfield Service
Analysis – that Kern Regional Transit (KRT) work with Golden Empire Transit (GET) and with Arvin Transit
to develop some type of fare coordination between systems. At the time of both studies, riders
transferring between KRT and Arvin or GET paid full fares on each system. While the systems have
different fare structures, there were recommendations for agreements through transfer arrangements.
Other transit system coordination recommendations focused on arranging schedules to facilitate travel
involving two transit systems. With both local and regional fixed‐route systems, many trips involve
transfers; recommendations from the transit plans included recommendations on making these
transfers easier for riders.
One way of facilitating transfers involves scheduling at transfer points. In the Taft plan, the
recommendation for a new fixed‐route between Taft and Maricopa included a recommendation that
these be scheduled to facilitate transfers in Taft for riders continuing to Bakersfield. The Arvin‐Lamont‐
Bakersfield study recommended that KRT and Arvin coordinate their schedules enabling for buses to
meet at a designated bus stop. Similarly, the Bakersfield Transit Analysis recommended reviewing the
new GET schedules to arrange KRT schedules for timed connections between the two systems.
In addition, the Bakersfield Transit Analysis recommended KRT route modifications in Bakersfield to
coordinate with new GET route changes, in order to facilitate transfers between the two systems and
72013 Update to the Coordinated Public Transit‐Human Services Transportation Plan
enable KRT riders from other areas to continue the trips with as little disruption as possible. Specifically,
this study recommended that KRT routes terminate at the Downtown Transit Center and also stop at
points closest to the KRT route’s point of entry into Bakersfield, based on a list of identified centers:
Amtrak Station, Greyhound Station, Airport Bus of Bakersfield/DMV, San Joaquin Community Hospital,
KRT offices, Bakersfield City Hall, and Mercy Hospital. Specific recommendations for the KRT routes
included arranging stops where transfers would be available between KRT and GET rapid bus routes
(after these are implemented). The study also projected longer term recommendations for transfers to
be made between KRT routes and possible light rail and commuter rail lines.
Fares and Farebox Recovery Ratio
Most studies included a focus on farebox recovery ratios, given that California state law requires its
public transportation programs meet certain minimums in order to sustain their funding. Most systems
are either slightly above the required farebox ratio or slightly or significantly below the state standard.
This led to recommendations to increase fares and/or to reduce transit operations expenditures. For
example, plans for California City, Delano, Tehachapi, and the Arvin‐Lamont‐Bakersfield corridor all
included recommendations for fare increases to increase the farebox contribution to overall operating
costs.
In addition to the fare increase recommendations, the plans for Delano and Tehachapi recommended
operations changes to reduce costs and thus improve the farebox recovery ratios. The Delano plan
recommended either increasing the headways of each route from 30 minutes to 60 minutes or
modifying the route alignments, combining routes to reduce the number of routes from four to two.
The plan for Tehachapi recommended reducing the service hours for the dial‐a‐ride system by two hours
each weekday as a means to reduce operating costs.
Some fare‐related recommendations focused on alternatives to a cash fare at all times. For example,
the Arvin‐Lamont‐Bakersfield corridor was invited to consider implementation of a system wide pass,
possibly a pass with a pre‐set value.
Two other types of recommendations related to fares. The Arvin‐Lamont‐Bakersfield plan
recommended implementation of a fare disincentive for general public use of the dial‐a‐ride service by
the general public, in order to ensure maximum availability of the dial‐a‐ride system for those who
cannot used fixed‐route transit. In Delano, in response to a pattern of fare evasions and driver lack of
fare enforcement, the recommendation was made for driver training on the impact of fare evasion.
Staffing
At the time of three of the studies, transit programs had experienced operations lapses and reductions
in service due to driver absences. In Arvin, the transit program had limited service reliability because
the system was operating without two of its regular full‐time drivers. In Taft, the dial‐a‐ride program
82013 Update to the Coordinated Public Transit‐Human Services Transportation Plan
suspended service to part of its service area due to reduced staffing. In Delano, the study found that
driver shortages had affected schedule‐adherence.
One response to these problems involved recommendations for driver recruitment and review of
employment packages. There may also be opportunities for coordination around back‐up
transportation or sharing driver resources, between transit systems and possibly with other agencies
providing transportation.
Bus Stops and Bus Stop Amenities
Four plans focused some attention on bus stops and bus stop amenities. These focused primarily on the
need for bus stop amenities at higher‐use locations. The plans recommended installation and
maintenance of bus shelters and/or benches, signs, and transit information. The Delano plan also
recommended attention to bus stop safety; in this case the safety concerns focused on stray dogs at bus
stops.
Intra‐Community Transit Needs
Identification of intra‐community transit needs in the transit plans focused on both the implementation
of new fixed‐ route service in communities served by general public demand‐response service and new
or revised routes in communities already served by fixed‐ route transit. In Taft, the study
recommended implementation of fixed‐route service, using two routes, to provide transportation to the
general public in an area which until then was only served by general public demand‐response. The
fixed‐route service could more effectively provide transportation to identified trip‐generators, while
leaving the demand‐response service available for seniors and persons with disabilities.
The Arvin plan and the Arvin‐Lamont‐Bakersfield corridor plan included recommendations for
modifications to existing fixed‐route services. For Arvin Transit the plan recommended a new fixed‐
route service along the city’s periphery. The Arvin‐Lamont‐Bakersfield plan recommended changes to
the Lamont Community fixed‐route system for shorter one‐way travel time and reduce redundancy.
Inter‐Community Transit Needs
Plans recommended expanded or new fixed‐route service between communities, to meet residents’
needs for travel to nearby communities for school, work, shopping, and other purposes.
In the Taft plan, this recommendation was part of a broader recommendation to implement fixed‐route
service in Taft and other communities which were then served by a general public demand‐response
system. This recommendation included an added recommendation to provide new transit service
between Taft and the City of Maricopa 7 miles south of Taft. In addition to providing access for
Maricopa residents to Taft resources, the new transit service would also provide access to Bakersfield
through transfer opportunities to the KRT Westside Express service.
92013 Update to the Coordinated Public Transit‐Human Services Transportation Plan
Similarly, the California City plan recommended new fixed‐route services, one providing service between
California City and Edwards Air Force Base, and one linking parts of California City and providing an
additional connection with Kern Regional Transit’s regional fixed‐route service.
In the Delano plan, the implementation of a new route between the Delano Transit Center and
Bakersfield was recommended; the route had previously been approved for JARC funding.
Other inter‐community transit needs focused on the expansion of inter‐community service. For
example, the Arvin‐Lamont‐Bakersfield corridor study focused on stakeholders’ needs for more service
between Arvin and Lamont, beyond one morning and one evening trip.
Service Days and Hours
Plans discussed possible needs for additional fixed‐route and demand response service, either adding
weekend service or expanding weekday service hours. For example, the Arvin plan recommended that
demand‐response service hours be extended until 6:00 pm instead of ending at 3:30 pm, on a trial basis.
The Arvin plan also recommended adding Saturday service, and the Delano plan recommended re‐
establishing weekend service as a demonstration project.
In addition to these recommendations, plans in Taft and California City identified perceived needs by
riders for expanded days and hours of service. The service improvement most frequently mentioned by
Taft Area Transit riders was the addition of Sunday service; also mentioned by riders was a need for
longer service hours. In California City, riders were most interested in the addition of Saturday service
and later service hours.
Demand‐Response Operations
Several issues related to demand‐response operations were identified in different plans, generally
involving demand response fare topics and service changes. Some have already been discussed in term
of increasing the farebox recovery ratios of both demand response and fixed‐route services.
Two recommendations to change demand‐response programs were related new fixed‐route service
direction, with changes to demand‐response in response. In Arvin, in conjunction with establishment of
new fixed‐route service, the plan recommended limiting demand response eligibility to seniors and
persons with disabilities. In California City, the recommendation to implement a fixed‐route system also
involved extending demand‐response hours to match the fixed‐route hours of service.
A separate demand‐response issue involved rider cancellations and no‐shows on the Taft service. The
Taft Area Transit experienced a large number of rider cancellations, especially late cancellations, and
rider no‐shows. The plan recommended that the city implement a monitoring process to track these
cancellations and no‐shows, and limit access to the service for riders repeatedly cancelling at the last
minute and/or not showing up for their rides.
102013 Update to the Coordinated Public Transit‐Human Services Transportation Plan
Fixed‐route Operations
A few fixed‐route operations issues were discussed in the transit plans, in addition to issues focusing on
fares, staffing issues, and marketing and information.
The Bakersfield Service Analysis focused attention on the trade‐offs required when regional fixed‐route
service brings riders into a relatively large community. The choices facing Kern Regional Transit in
considering changes in Bakersfield involve providing direct service to several destinations in Bakersfield,
thus extending the length of each route and limiting the route frequency, or providing direct service to a
few transfer points and having riders transfer to the Golden Empire Transit system to continue the
Bakersfield part of their trip. The latter option, and the one recommended for KRT, has the advantage
of enabling KRT to provide more trips to and from Bakersfield on each route; the disadvantage to
customers involves paying additional fares or transfers and changing to another bus.
A different type of fixed‐route operations issue focused on a recommendation in the Delano plan to
increase on‐time performance through such steps as random ride checks, elimination of flag stops, and
reduction in the number of published time points. In other systems, service reliability discussions
focused on driver staffing issues.
Transportation Options and Needs
Most of the studies surveyed riders on trip purposes and on their transportation choices if the transit
service were not available.
Riders identified a wide range of options facing them if transit had not been available for the trip they
were taking. On two of the KRT routes – the Westside Express and the East Kern Express – between 49%
and 61% of the passengers would not take the trip, indicating the importance to these communities of
the regional transit services.
On the local systems, approximately one‐third of the riders indicated that if the transit service were not
available they would not have made the trip. Also on these systems, between 15% and 33% of the
passengers would have walked to their destinations, something more likely in these smaller geographic
areas. While the option to walk is useful to many transit riders in these areas, it would generally not be
an option for older adults or for persons with disabilities.
There was variety in the trip needs riders identified for the transit trips they were taking. Medical trips
represented a large part of some of the routes, such as the KRT Westside Express, Taft Area Transit, and
Arvin Transit. Social service trips were the most frequently mentioned on the Tehachapi dial‐a‐ride
service. Shopping was the most frequently mentioned reason on the California City dial‐a‐ride survey.
Other major trip needs mentioned were work, courts, school, and social.
112013 Update to the Coordinated Public Transit‐Human Services Transportation Plan
Kern County Target Population Characteristics
Target Groups and Population Change
Current and historical population information for Kern County, reflecting change between the years
2000 to 2011 year U.S. Census data, is summarized here in Figure 1. It is clear that Kern County 851,710
total population represented an increase of 28.7% from the 2000 US Census reported total of 661,000
persons. Notably, the proportion of persons at or below federal poverty levels grew by 58.7%, almost
double the growth rate of the county as a whole, increasing from 66,476 to 105,388 persons.
Older adults increased by 24.4%, a slightly slower rate than the countywide growth rate of almost 29%,
but still a significant rate of increase, now totaling 77,367 persons over the age of 65. Disability
population changes cannot readily be compared, given new Census definitions of disability.
Figure 1
Table 1 following presents the detail for each population group that is the focus of this Coordinated Plan
update.
122013 Update to the Coordinated Public Transit‐Human Services Transportation Plan
Table 1, Kern County Demographics Update
TARGET POPULATIONS for Older Audults, Persons with Disabilities, and
Persons of Low-Income
[2000 Census]
% of Total [2011 ACS] Kern % of Total % Change
2000 Census Attribute, Summary File 3 Kern County
County County People County from 2000
2011 American Community Survey 1-year Estimates People by Population Population
by Category to 2011
Category
TOTAL POPULATION [1] 661,645 100.0% 851,710 100.0% 28.7%
ADULTS 18-64 [2] 388,700 58.7% 519,451 61.0% 33.6%
Low-income Adults, Ages 18-64 - 100% Federal Poverty Levels [3] 66,426 10.0% 105,388 12.4% 58.7%
with % of Adults 18-64 17.1% 20.3%
Disability [4] (non-institutionalized) Ages 16-64 "go-outside-home" disability
34,424 5.2%
(2000)
with % of Adults 18-64 8.9%
Disability [4] (non-institutionalized) Ages 18-64 (2010) 57,546 6.8%
with a hearing difficulty 10,373 1.2%
with a vision difficulty 10,741 1.3%
with a cognitive difficulty 23,890 2.8%
with an ambulatory difficulty 31,517 3.7%
with a self-care difficulty 11,961 1.4%
with an independent living difficulty 20,686 2.4%
SENIORS [2] 62,175 9.4% 77,367 9.1% 24.4%
Seniors, ages 65-74 34,504 44,087
with % of all seniors 55.5% 57.0%
Seniors, ages 75-84 21,064 25,138
with % of all seniors 33.9% 32.5%
Seniors, ages 85+ 6,607 8,142
with % of all seniors 10.6% 10.5%
Low Income Seniors, Ages 65+ - 100% Federal Poverty Levels [3] 6,310 1.0% 7,041 0.8% 11.6%
with % of all seniors 10.1% 9.1%
Disability [4] (non-institutionalized) Ages 65+ "go-outside-home" disability (2000) 13,518 2.0%
with % of all seniors 21.7%
Disability [4] (non-institutionalized) Ages 65+ (2010) 30,428 3.6%
with a hearing difficulty 12,203 1.4%
with a vision difficulty 5,583 0.7%
with a cognitive difficulty 8,635 1.0%
with an ambulatory difficulty 20,634 2.4%
with a self-care difficulty 6,640 0.8%
with an independent living difficulty 12,980 1.5%
[1] Census 2000 Summary File 3, Total Population P001. / B01003 Total Population 2011 American Community Survey 1-year Estimates
[2] Extrapolated from Census 2000 Summary File 3, Sex by Age P008 / B01001 Sex by Age, 2011 American Community Survey 1-year Estimates
[3] Extrapolated from Census 2000 Summary File 3, Poverty Status in 1999 by age P087 / B17001 Poverty Status in the Past 12 Months by Sex by Age 2011 American Community Survey 1-year Estimates
[4] Extrapolated from Census 2000 Summary File 3, Age by types of disability for the civilian non-institutionalized population 5 years & over with disabilities p041 / S1810 Disability Characteristics - 2011
American Community Survey 1-year Estimates
132013 Update to the Coordinated Public Transit‐Human Services Transportation Plan
Distribution of Target Population within Kern County
There are interesting differences as to where the densities of these population groups lie within Kern
County. Figures 2, 3 and 4 following depict respectively the distribution of older adults, persons with
disabilities and persons of low‐income who are residents of Kern County. In Figure 3, Kern County’s
older adult population ages 65 and older of almost 70,000 persons is presented. In east and north
eastern Kern County, between one‐third and two‐thirds of all persons in those census block groups are
older adults, recognizing that some areas are very rural and sparsely populated.
Comparably high older adult population density exists within pockets of the City of Bakersfield, largely to
the north east, except the Green acres area south of Highway 58 and west of Highway 99. Only
somewhat less dense is southeast Kern County where between one in five to a third of area residents as
older adults, and southwest Kern County, between Maricopa and Fraizer Park, as well as west of I‐5 in
the area between Beldridge and Ford City, north of Taft. Again, in the rural regions, the population is
generally scarce but of those, they are high to moderately high proportions of older adults.
Tracking disability populations has been made somewhat more complicated by the new way in which
the Census now records this information. As noted in the preceding Table 1, in 2011 there were 57,546
adults and 30,428 older adults reporting at least one disability from a list that includes: hearing
difficulty, vision difficulty, cognitive difficulty, ambulatory difficulty, self‐care difficulty and an
independent living difficulty.
Figure 4 shows that those reporting at least one such difficulty are mostly clustered around the greater
Bakersfield area, with census block groups there reporting 13% of residents in the areas surrounding
central Bakersfield. Eastern Kern County has somewhat fewer individuals reporting disabilities, at 12.5%
of the population followed by Western Kern County at 12% of the population.
Low‐income populations are distributed around the County in patterns different from those of older
adults or persons with disabilities, with 277,641 residents at or below 150% of Federal poverty
guidelines. As shown in Figure 5, there are areas south of Bakersfield, towards Lamont, Arvin and along
Highway 184, with between 60% and 77% of residents at or below 150% of the Federal Poverty Level
(2011 guidelines). Similarly north between Shafter and Rosedale, there are comparable very high levels
of poverty. Within the City of Bakersfield, there are identifiable areas and neighborhoods with higher
poverty levels, in the east central and south east areas of town, a few pockets to the north around
Highway 178 and north of Highway 204.
Similarly, the area of northwestern Kern County, including north and west of Wasco reflect census block
populations of 49% to 40% who are below 150% of the poverty level. On the county’s western border
142013 Update to the Coordinated Public Transit‐Human Services Transportation Plan
with San Luis Obispo County between Maricopa and Ford City/ Taft, between 36% and 48% of area
residents are living at or below these poverty levels.
152013 Update to the Coordinated Public Transit‐Human Services Transportation Plan
Figure 2
162013 Update to the Coordinated Public Transit‐Human Services Transportation Plan
Figure 3
172013 Update to the Coordinated Public Transit‐Human Services Transportation Plan
Figure 4
182013 Update to the Coordinated Public Transit‐Human Services Transportation Plan
III. Mobility Needs and Gaps – What is
Reported?
Significant public involvement has contributed to the development of this Coordinated Plan Update. This
chapter reports on a broad‐based stakeholder agency survey and on interviews with representative
agencies.
Plan Update Sub‐regions
This coordinated plan is considering both county‐wide and sub‐regional trip needs. The needs, gaps and
resources in this Plan are grouped in five regions: Metropolitan Bakersfield, North West Kern, South
West Kern, North East Kern, and South East Kern. We proposed these regions based on the location of
cities and communities within the county, with consideration of their proximity to existing
transportation services or connections. Figure 5 identifies these regions.
Figure 5
192013 Update to the Coordinated Public Transit‐Human Services Transportation Plan
The Metropolitan Bakersfield area is based on the boundaries of the U.S. Census Urbanized Area (UZA)
maps, with the exception of the city of Lamont, which for this plan is grouped in South East Kern due to
its proximity and transit connections with the City of Arvin. South East Kern also includes the cities of
Tehachapi, California City, Mojave and Rosamond. North east Kern extends North to the Tulare and Inyo
County borders and east to the border of San Bernardino County, encompassing the cities of Lake
Isabella and surrounding communities, as well as Ridgecrest and Johannesburg. North West Kern begins
at Highway 65 and extends west to San Luis Obispo County, including the cities of Shafter, Wasco,
McFarland and Delano. South West Kern stretches west from Interstate 5 and Highway 99 and includes
Frazier Park, Taft and surrounding communities.
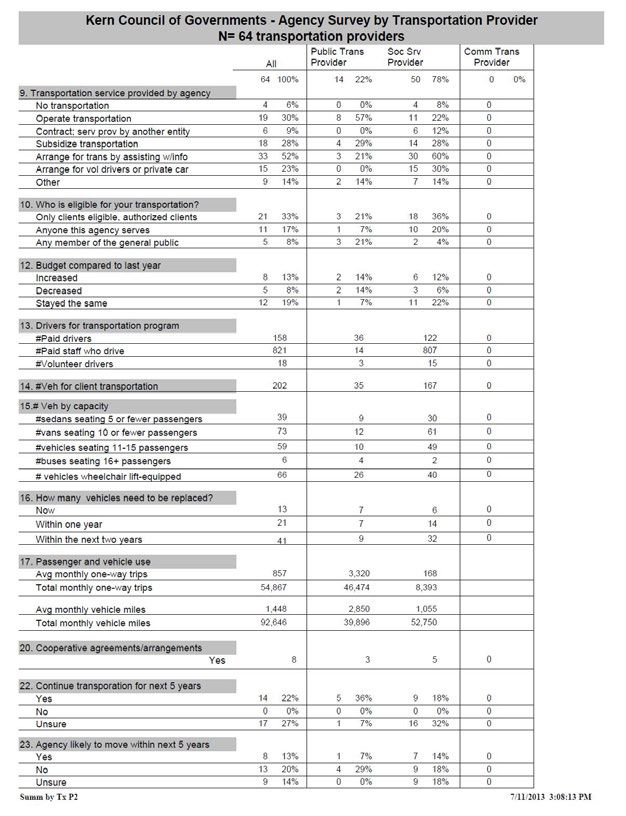
Agency E‐Survey Findings
An E‐survey to Kern COG’s large stakeholder base provided for some quantitative input to the public
involvement processes to framing this Coordinated Plan Update. The E‐survey sought information
about both needs and transportation resources from Kern County’s public transportation providers and
human service agencies and organizations. The E‐survey link, with an introductory message and cover
letter to a .PDF file, went out to Kern COG’s master email list, more than 2,000 stakeholder agencies and
elected officials across the county.
An initial communique was sent in early April and two subsequent reminder emails over the next several
weeks. The survey link remained open through much of May, extending it so that agencies interviewed
in the mid‐May consultant effort could participate in this quantitative outreach. During this phase, the
E‐survey opportunity was specifically extended to the Kern County Community Action Partnership of
Kern/ Headstart program directors across the county and to the Greater Bakersfield Homeless Service
Providers. Appendix B presents the full E‐survey responses and Appendix C presents the inventory of
responding organizations. A summary of key findings follows.
About the Respondents
Appendix B presents summary of agency responses as well as a detailed listing of respondents. Figure 6
following shows the relative distribution of respondents by organizational legal type.
The 136 responding organizations were about evenly split between private, non‐profit organizations (66)
and public agencies (61). A handful of Tribal organizations (4) and for‐profit entities (4) responded and
just a single faith‐based organization.
These entities combined report that they touch over a million consumers or clients, and while clearly
this represents some duplication, it does indicate that responding organizations reach large proportions
of Kern residents. In reporting caseload information, these organizations identified that of the
1,091,926 enrolled clients or consumers, about 13% (146,034 persons) were traveling daily. And of
20You can also read