Business Mix Analysis: Gaps & Opportunities - Prepared for the City of Wetaskiwin - City of ...
←
→
Page content transcription
If your browser does not render page correctly, please read the page content below
Business Mix Analysis:
Gaps & Opportunities
Prepared for the City of Wetaskiwin
January 2021

                                  PEOPLE DRIVEN DESIGN

                                           In partnership with
The City of Wetaskiwin respectfully acknowledges we are situated on Treaty 6
territory; the traditional lands of many First Nations and Métis people.

The City of Wetaskiwin respects the histories, languages, and cultures of First
Nations, Métis, Inuit, and all First Peoples of Canada whose presence continues
to enrich our vibrant and diverse community.
Table of Contents
Preface																	                                             i
Executive Summary													                                       ii
1.0 Introduction														                                       1
   1.1 Scope of Study													                                   1
   1.2 Report Structure												                                  1
   1.3 COVID-19														                                        1
   1.4 Stakeholder Engagement & Feedback						                       1
2.0 Location & Context												                                   3
   2.1 Introduction														                                    3
   2.2 Local & Regional Context										                            3
   2.3 Local Plans & Reports											                              4
   2.4 Transportation Context										                              7
   2.5 Building Permits												                                  8
3.0 Trends																                                           9
   3.1 Introduction														                                    9
   3.2 COVID-19														                                        9
   3.3 Pre & Post Covid General Trends							                        10
   3.4 Trends in Developing Successful Retail In Secondary Markets   11
4.0 Trade Area															                                        13
   4.1 Introduction														                                    13
   4.2 Population Demographics & Projections					                    16
   4.3 Summary of Employment and Labour						                        21
   4.4 Retail Spending Profile											                            23
5.0 Commercial Supply												                                    27
   5.1 Introduction														                                    27
   5.2 Market Overview												                                   27
   5.3 Citywide Summary												                                  27
   5.4 Downtown Node Summary									                                33
   5.5 Auto Mile Node Summary									                               34
   5.6 Regional Node Summary										                               34
   5.7 Commercial Land Summary									                              40
6.0 Market Demand Analysis										                                 43
   6.1 Introduction														                                    43
   6.2 Floorspace Demand by Per Capita Population Growth		           43
   6.3 Floorspace Demand by Trade Area Based on Current Market Share 43
   6.4 Floorspace Demand by Trade Area Based on Target Market Share 47
7.0 Key Findings & Action Plan										                             48
    7.1 Introduction														                                   48
    7.2 Key Market Findings											                               48
    7.3 Supporting Action Items										                            52

Appendix A - Demographic Overviews								                           56
Appendix B - Trade Area Spending Forecasts						                     59
Appendix C - Detailed Commercial Inventory						                     60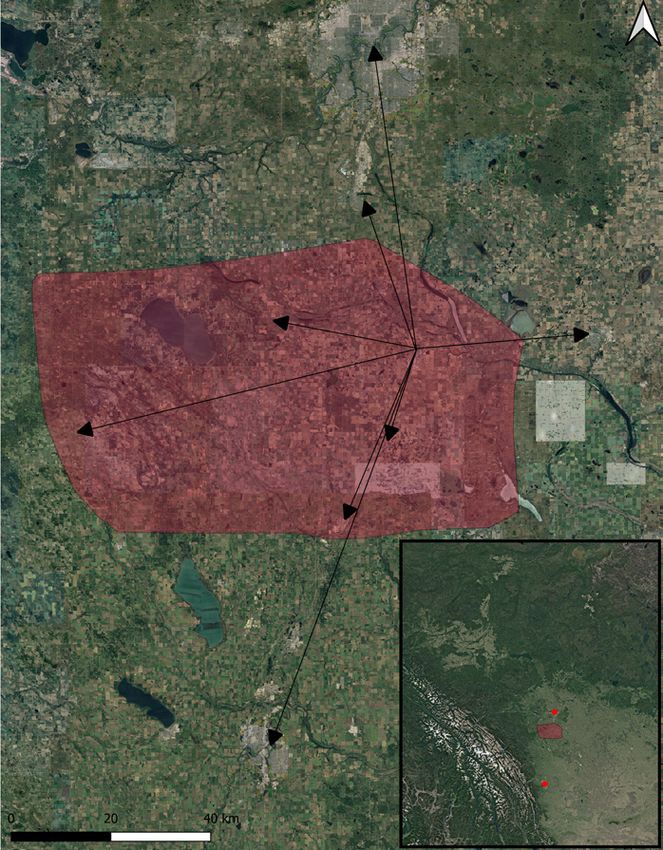
Preface
Fowler Bauld & Mitchell Ltd. (“FBM”) in partnership           FBM does not warrant that any estimates contained
with Key Planning Strategies (“Key Planning”) were            within the study will be achieved over the identified
commissioned by the City of Wetaskiwin to provide a           time horizons, but that they have been prepared
Business Mix Analysis for the City.                           conscientiously and objectively on the basis of
                                                              information obtained during the course of this study.
The study was carried out over the period of September
to January 2021.                                              Also, any tenant references made in the report are for
                                                              illustrative purposes only and should not be taken as
The objectives of this study is to thoroughly document        guarantees that they will locate in Wetaskiwin but rather
Wetaskiwin’s current retail and commercial inventory.         that they could represent compatible “target” category
The next step estimates the realistic Primary Retail and      types to pursue either for local businesses or external
Commercial Trade Area for which Wetaskiwin serves             regional businesses over the next decade.
and the retail expenditure profile across various retail
categories/store types as an indication of retail inflow/     This study is fully cognizant of the impact that COVID-19
outflow and opportunities therein that Wetaskiwin could       pandemic has had on the Albertan retail industry
potentially pursue. The end result is to fill gaps and        over the past 9 months. Where possible in this study,
bolster the local retail market by retaining or attracting    recommendations have taken the pandemic into
greater market share of resident and visitor spending in      account. However, retail spending figures are utilizing a
the community.                                                baseline for data of year-end 2019 and forecasts to 2024
                                                              and 2029. Because forecasts are relatively conservative
Retail spending (i.e. demand), Wetaskiwin’s retail            to start with, they haven not applied a retail sensitivity
inventory, and its corresponding productivity (i.e. supply)   since expectations are that as vaccinations take place in
was estimated to identify gaps in Wetaskiwin’s current        2021 that the retail industry and consumer spending will
provision of shops and services over the next decade.         return to normal levels of household spending.

This document is intended to assist Wetaskiwin in             This analysis was conducted by FBM and Key Planning
promoting the community, working with developers and          as an objective and independent party, and is not an
investors, as well as attracting new retail or business       agent of the City. As is customary in an assignment of
opportunities. It further aims to retain existing retailers   this type, neither our name nor the material submitted
as part of a wider Economic Development Strategy for          may be included in a prospectus, or part of any printed
business retention and attraction.                            material, or used in offerings or representations in
                                                              connection with the sale of securities or participation
Reference material for this report was obtained               interest to the public, without the expressed permission
from, but not limited to: Statistics Canada, Alberta          of the City of Wetaskiwin or FBM.
Transportation, Manifold Data Mining Inc, Commercial
Real Estate/Property Management Firms, International          FBM & Key Planning Strategies
Council of Shopping Centers, and FBM.                         2021

Page i                                                                 Business Mix Analysis for the City of Wetaskiwin
                                                                                                                Preface
Executive Summary
The market analysis research and analysis revealed           • Total Retail Trade Area spending is estimated
the following key findings pertaining to Wetaskiwin’s           at $613.1 million as of year end 2019 and
commercial and retail business mix along with                   in conjunction with population growth and
opportunities and challenges therein.                           conservative household income growth, spending
                                                                is forecast to grow to $655.2 million by 2024 and
KEY FINDINGS                                                    $699.6 million by 2029.

Trade Area                                                   Wetaskiwin’s Trade Area profile overall is indicative of an
• Trade Area population as of 2019 year end was an           older demographic around which the health care sector,
   estimated 45,235 which includes 11,761 residents          personal services and conveniences are high priorities.
   of Aboriginal origin.
                                                             The household incomes and spending profile further
• Trade Area population is forecast to approach 50,000       suggest a market compatible with value-priced
   (49,212) by 2024 and grow to almost 54,000                merchandise offering, around which brands or tenants
   (53,622) by 2029 representing a 10-year growth of         like Bulk Barn, Real Canadian Superstore, Value Village
   8,387 residents.                                          would be prime targets.
• Average Household Income of Wetaskiwin’s Trade
                                                             A focus for the City should also be towards attracting
   Area estimated to grow from it’s present day
                                                             younger families seeking compatibility with a small town
   estimate of $100,830 per household to $115,959 by
                                                             remote working opportunity with a strong provision of
   2024 and $137,475 by 2029.
                                                             local and independent shops and a downtown culture.
• Compared to the Provincial average, Wetaskiwin’s
   Trade Area household income has a much                    Business Mix Inventory
   lower share of residents earning over $100,000.           • The City of Wetaskiwin has a total commercial
   The dominant household income segment in                     floorspace of approximately 1.31 million sf. This
   Wetaskiwin’s Trade Area is in the $25,000 to                 figure includes not just retail, but professional and
   $50,000 range.                                               medical services that occupy streetfront uses in the
                                                                City’s various nodes identified as Downtown, Auto
• Trade Area average age is estimated at 39.3 years,
                                                                Mile, Regional and Southeast Industrial.
   which is slightly younger than the City’s average age
   is estimated at 41.7 years.                               • When factoring only retail shops and services and
                                                               food and beverage businesses, the total floorspace
• Compared to the Provincial average, Wetaskiwin’s
                                                               is estimated to be just under 799,401 sf.
   Trade Area and City has a higher proportion of
   residents aged 65 and over and lower proportion           • Wetaskiwin’s Top 5 retail-specific categories
   in the influential and family formative stages 25-49        (excluding professional or office-related services) in
   years.                                                      terms of overall occupied floor space are:

• Trade Area total aggregate household spending,                 1. General Merchandise		                   239,650 sf
   including spending on Health Care/Medical Services            2. Auto/RV/Motorsports Dealers             160,400 sf
   and Automotive) is estimated at $582.4 million (as            3. Home Improvement & Gardening             89,900 sf
   of year end 2019).                                            4. Grocery & Specialty Foods                87,585 sf
• Wetaskiwin also benefits from some miscellaneous               5. Full Service F&B			                      67,750 sf
  inflow, which is estimated to be in the range of
  5.3% of the total Trade Area spending resulting in         • The current citywide vacancy sits at 10.1%, or almost
  an additional $30.7 million in retail specific spending.      135,000 sf. As with inventory, this vacancy varies
                                                                between the various nodes.

Business Mix Analysis for the City of Wetaskiwin                                                                  Page ii
Executive Summary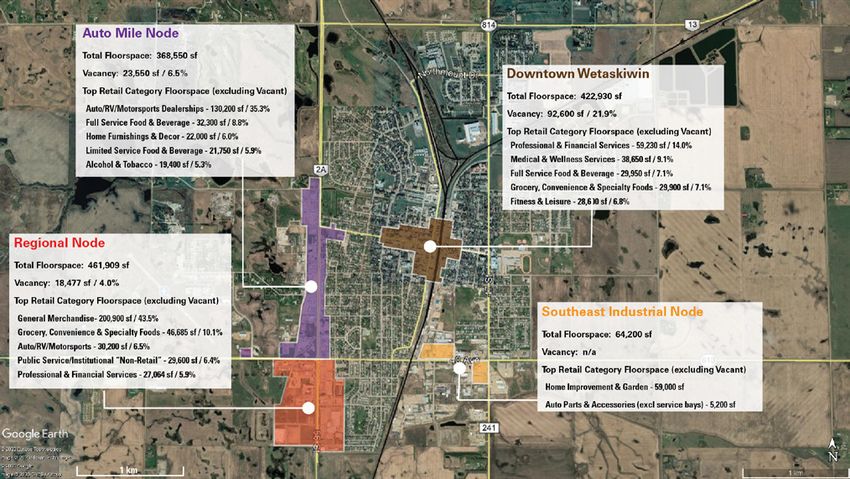
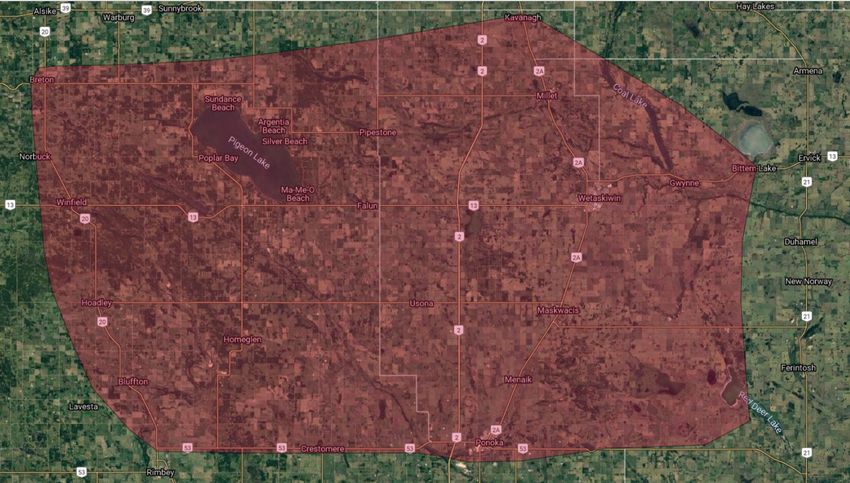
City of Wetaskiwin’s Primary Retail Trade Area
(Source: FBM)

Page iii                                         Business Mix Analysis for the City of Wetaskiwin
                                                                             Executive Summary
Citywide Commercial Nodes in Wetaskiwin
 (Source: FBM)

Business Mix Analysis for the City of Wetaskiwin   Page iv
Executive Summary
• The most notable vacancies in the City including:         Market Demand
   Former COOP Grocery (Downtown) -		         21,500 sf     • Assuming an estimated 10-year population growth
   Former Auto Shop (Downtown) -				          5,000 sf         of 8,387 residents in Trade Area and applying a
   Former Thrash n Threads (Downtown) -		     5,000 sf         reasonable sf per capita ratio of 20, would suggest
   Beside Country Pharmacy (Downtown) -       5,000 sf         supportable demand for approximately 167,740 sf in
   Former AIF Distributors (Auto Mile) -		    4,250 sf         the Trade Area, of which Wetaskiwin could continue
                                                               to realistically garner at least 65% resulting in a net
NODAL INVENTORY SUMMARIES                                      new demand for approximately 110,000 sf.
Downtown Wetaskiwin Node                                    • Based on the City’s current inventory of
   Total Floorspace: 422,930 sf                                approximately 975,441 sf of occupied retail space,
   Vacancy: 92,600 sf / 21.9%                                  the City’s retailers are only garnering a retained
   Top Retail Category Floorspace (excl Vacant)                market share of 35%. This market share or retention
   Professional & Financial Services - 			 59,230 sf           rate suggest that 65% of Trade Area resident
   Medical & Wellness Services - 				 38,650 sf                spending is considered outflow and spent in
   Full Service Food & Beverage - 				 29,950 sf               Edmonton, Leduc County, Camrose or Red Deer.
   Grocery, Convenience & Specialty Foods - 29,900 sf       • If current market share rates are projected out over
   Fitness & Leisure - 								28,600 sf                       the next 10 years at the same levels, in conjunction
                                                               with population increase and anticipated spending
Auto Mile Node
                                                               increase, the resulting floorspace demand could
   Total Floorspace: 368,550 sf                                increase cumulatively of 184,000 sf by 2024 and
   Vacancy: 23,550 sf / 6.5%                                   263,000 sf by 2029.
   Top Retail Category Floorspace (excl Vacant)
                                                            • A summary of the cumulative demand for 2024 and
   Auto/RV/Motorsports Dealerships - 		      130,200 sf
                                                               2029 by broad merchandise cluster and shows that
   Full Service Food & Beverage - 				 32,300 sf
                                                               Conveniences could support an increase of 30,407
   Home Furnishings & Decor - 					 22,000 sf
                                                               sf, which could in essence support one smaller
   Limited Service Food & Beverage - 			 21,750 sf
                                                               grocery store perhaps closer to the hospital or new
   Alcohol & Tobacco - 							19,400 sf
                                                               residential areas in the future.
Regional Node                                               • A focus on broader marketing to increase overall
   Total Floorspace: 461,909 sf                                market share from 35% to 38% could result in
   Vacancy: 18,477 sf / 4.0%                                   cumulative demand by 2024 of 283,000 sf and
   Top Retail Category Floorspace (excl Vacant)                367,000 by 2029.
   General Merchandise- 						                 200,900 sf
                                                            Increasing market shares may yield more demand,
   Grocery, Convenience & Specialty Foods - 46,685 sf
                                                            but this does not necessarily mean that all that new
   Auto/RV/Motorsports - 							30,200 sf
                                                            demand must be introduced in some way. In fact, a
   Public Service/Institutional “Non-Retail” - 29,600 sf
                                                            higher market share retention combined with stronger
   Professional & Financial Services - 			 27,064 sf
                                                            marketing also could mean that existing businesses
                                                            could have stronger sales.

                                                            Wetaskiwin’s future demand for new space must be
                                                            balanced off against its current vacancies to yield a more
                                                            realistic picture of how much new space should be
                                                            planned for or accommodated in Wetaskiwin.

Page v                                                               Business Mix Analysis for the City of Wetaskiwin
                                                                                                 Executive Summary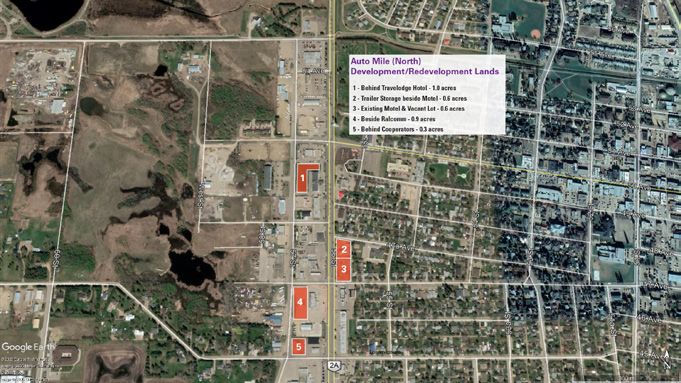
Accordingly, if the optimal scenario of increased market      •   Bulk Barn
shares is prioritized resulting in 367,000 sf by 2029, this   •   Real Canadian Superstore
figure should be reduced to reflect the combination of        •   Value Village
vacancies estimated at 135,000 or 10% today as well as        •   Cobs Bread
improved retail sales productivity.                           •   M&M Meat Shops
                                                              •   Sally Beauty
Therefore, assuming a healthy retail market should have       •   Mary Brown’s Chicken
an estimated vacancy of 5%, it is safe to say that the        •   Cora’s
demand could be reduced by almost 70,000 sf, which            •   Carl’s Jr
would bring forecasted demand to 297,000.
                                                              SUPPORTING ACTION ITEMS
Next, it would be reasonable also to reduce this
                                                              The following section provides a some specific
floorspace demand by 50% so as to allow existing
                                                              actionable tasks that could be proactively undertaken
businesses the opportunity to increase their market
                                                              by the City to respond to the key market findings.
shares and resulting productivity.
                                                              These actions are intended to facilitate communication
                                                              and interaction with local businesses and external
The end result would suggest that a reasonable and
                                                              resources for retention and attraction of businesses in
feasible forecast for new demand would be in the range
                                                              the community in areas that are most compatible and
of 150,000 sf of new retail space in the City. This would
                                                              impactful to the community.
allow for a balance of new demand while helping to
minimize or mitigate the impacts of new retailers, which
                                                              ACT NOW
would occur regardless to some degree.
                                                              The Act Now actions pertains to those initiatives that
                                                              should commence immediately and over the next year,
In parallel with the demand forecast by per capita,
                                                              some of which could be viewed as quicker and cheaper,
the results further suggest that the most comfortable
                                                              while others may take more time, but should have a
demand for new retail space would be in the
                                                              process that starts immediately. These could include:
100,000 to 150,000 sf range over the next decade
for Wetaskiwin, as supported by population growth,
demographic composition, household income and                 • Introduce a moratorium on Pawn Shops and Cheque
general economic recovery/growth.                                Cashing merchants throughout the City and ensure
                                                                 that any new commercial development does not
In a truly growing and burgeoning market, analysis               allow for a Pawn Shop.
findings can support and justify the expansion of
retail for significant brands and formats. However, in a      • Work with Landlords in the Downtown to actively
market like Wetaskiwin, the local market ecosystem,             promote and utilize vacant spaces. This must not
as evidenced by Downtown vacancies is essential to              require a prospective tenant to use the full available
maintain in terms of overall competitive balance and            space, but allow for apportioned space use and
harmony in the city and the region. The City should             create a rent structure that is based on month-to-
prioritize key target categories and tenants that can           month and/or percentage rent based on sales.
benefit from the sales inflow as well as curbing some
                                                              • The reputation of big companies and big retail has
outflow.
                                                                 diminished over the past years resulting in less
                                                                 trust of larger brands. Small is no longer an insult.
Most salient among the near term tenant prospects for
Wetaskiwin are:

Business Mix Analysis for the City of Wetaskiwin                                                                   Page vi
Executive Summary
Small can be effective and powerful. In a constantly   • Establish an informal Downtown Business
     changing world where customers are rediscovering          Association, based on a nominal membership
     small, it is logical to look at how small businesses      fee to be used for marketing purposes, with a
     have succeeded at being small. Specifically, some         view to creating a more permanent provincially
     opportunities include:                                    structured Business Improvement Association for
       » Micro businesses (table tops or small booths)         the Downtown that uses property tax as a potential
                                                               avenue for funding with the creation of a Board of
       » A Wetaskiwin Makers Market and host                   Directors.
         “crafternoons”
       » Co-working spaces. This could also include         • The City should ensure that retail growth does not
         working with existing seasonally busy office          come at the expense of the Downtown’s extensive
         segments like H&R Block or Accountants to             revitalization, streetscaping, wayfinding and historic
         have some of their desks made available for           preservations efforts to-date. Continued growth and
         local office type users.                              expansion of retail in the Regional Node could lure
                                                               some business that may result in tenants leaving
       » Indigenous working craft house and shop               the downtown to relocate. The City should prioritize
• Work with the schools and other arts programs/               future retail developments that respond to tenant-
  societies to create a window mural program for all           driven, consumer-driven and market-driven demand.
  vacant ground level storefronts.
                                                             • Vacancies need to be prioritized which requires
• Adjust conventional thinking priorities of economic          constant “outreach & planning” through workshops
   development to more Wetaskiwin specific. For                with prospective tenants, landlords and brokerage
   example, rather than recruiting one business that           community.
   adds 50 jobs, work towards helping 50 existing
                                                             • Work at developing, not recruiting local businesses
   businesses add one new job each.
                                                               where ideas are formulated and entrepreneurs
• Actively promote a year round shop local culture by          are sought to execute the ideas. In other words
   creating a window sticker and community dollars             connect the concept to those who can capitalize.
                                                               This includes creating entrepreneurial bootcamps
   program for Downtown Businesses or other specific
                                                               for Home Based Businesses as well as others with
   local businesses outside of the Downtown. As part
                                                               prospective business concepts.
   of this, create a Wetaskiwin-specific messaging
   campaign of the benefits of shopping local.              • Create a database of Home-Based Businesses so
                                                               that a Home Business showcase/fair could be set
• Create a strategy for converting a closed restaurant
                                                               up collectively in a vacant spaces in the Downtown.
   into a short-term food pop up community kitchen
   that could be rentable by the day or week or for a       • Reintroduce a facade improvement grant program
   potential mobile food business.                             for local independent retailers or storefronts in the
                                                               Downtown and the Automile.
PLAN FOR SHORT TERM
                                                            • Consider removing the current parking cash-in-
Planning for the short term entails undertaking actions
                                                               lieu program and removing all minimum parking
over the next 2 to 5 years with the realization that some
                                                               requirements to stimulate development by making it
interventions take education and time to implement.
                                                               more economically feasible for local developers. Let
                                                               Developers determine how much parking they need
                                                               as they will always seek to provide sufficient parking
                                                               to make their project marketable, if needed.

Page vii                                                             Business Mix Analysis for the City of Wetaskiwin
                                                                                                 Executive Summary
• Use vacant lots to create seasonal container villages • Work with Planning to start identifying future
for pop up retail opportunities. growth areas and possible lands appropriate
for neighbourhood or community commercial
• Create a “show-and-tell” for the brokerage and mixed-use nodes. Ideally, these could
community and begin reaching out to specifically accommodate from 10,000 to 100,000 sf of shops
identified or target businesses either directly or and services.
through tenant representatives.
• Hold a tour of empty buildings to show off available
spaces in Wetaskiwin, particularly Downtown. This
will also help to identify which spaces need to be
improved for marketability.
• Create an award program for Micro businesses and
pop up retail to show their value to the community
and spur others and create a perpetual loop of
cultivating businesses.
• Create a discussion forum among restaurant
operators to see if there is interest in co-operating
restaurants where two restaurants could split the
day in the same space or building; one for breakfast
and lunch and one for dinner.
PREPARE FOR LONG TERM
Preparing for the long term requires more strategic
thinking about the City’s future positioning in the
regional market.
• Work with Avenue Living to facilitate a repositioning
of the Wetaskiwin Mall that includes higher land
utilization or intensification beyond the proposed
CRUs that could accommodate additional junior box
tenants like Bulk Barn.
• Look at the possibility of creating a “bureaucracy
free” zone in the Downtown temporarily to see
if it can stimulate and attract small and micro
businesses. This “bureaucracy-free” zone may
mean temporarily eliminating a business license
or application fees as these can often hold people
back, particularly those who may not otherwise
look at setting up a quasi-permanent or permanent
business location or space.
Business Mix Analysis for the City of Wetaskiwin Page viii
Executive SummaryThis page left intentionally blank
Business Mix Analysis for the City of Wetaskiwin   Page x
Executive Summary
1.0 Introduction
1.1 SCOPE OF STUDY                                          documenting in detail Wetaskiwin’s retail inventory
                                                            by retailer, merchandise category and NAICS industry
Fowler Bauld & Mitchell Ltd. (“FBM”) were
                                                            classification.
commissioned by the City of Wetaskiwin
(“Wetaskiwin”) to provide a business mix analysis for       6.0 Market Demand Assessment
the City. The objective of this study is to thoroughly      Based on an extensive assessment of the current
document Wetaskiwin’s current retail and commercial         “supply” and Trade Area spending, the current demand
inventory, and to define the realistic Primary Trade Area   is then estimated and measured against the market
for which it serves. The end result is to fill gaps and     potential.
bolster the retail and commercial markets it serves by
retaining or attracting greater market share of resident
                                                            7.0 Key Findings and Action Plan
and visitor spending in the community and identifying
                                                            Synthesizes gaps and opportunities for the retail and
gaps.
                                                            commercial market, and identifies strategic action steps
                                                            ranging from now to short term and medium term that
1.2 REPORT STRUCTURE
                                                            could be undertaken to strengthen existing businesses,
This report contains the following sections (with           while cultivating new businesses and investment
supporting Appendices):                                     activity.

1.0 Introduction
                                                            1.3 COVID-19
Introduces the study process and structure.
                                                            This study was undertaken during the COVID-19
2.0 Location and Background Information                     pandemic State of Emergency. Due to the economic
Lays out the important regional and local context of the    impact that the COVID-19 crisis has had on businesses,
City of Wetaskiwin, in terms of geographic location,        it is expected that forecasts in this study will need to be
regional access and traffic counts, including relevant      tempered over the next year, while businesses recover
existing and forthcoming plans, studies and initiatives.    and slowly attract customers. Further details on the
                                                            impact of COVID-19 on Albertans and small businesses
3.0 Trends
                                                            can be found in Section 3.
Provides an overview or retail and commercial trends
that are shaping consumer, tenant and investor
sentiment and actions.
                                                            1.4 STAKEHOLDER ENGAGEMENT
                                                            AND FEEDBACK
4.0 Trade Area
Identifies and defines the City as well as its Primary      As part of this study, the FBM Team held interviews
Trade Area, and documents the population and                with selected stakeholders in the community
expenditure profiles, including retail spending.            representing real estate and businesses. These
                                                            interviews provided important context and background
5.0 Commercial Supply                                       understanding for some of the challenges and
Provides a detailed documentation, tabulation and           opportunities that Wetaskiwin faces for commercial
summary of the city’s predominantly ground oriented         business attraction and retention.
retail and commercial business mix. This section
also assesses the location and characteristics of
Wetaskiwin’s current nodes of retail activity (“supply”),
including developing or future planned retail sites.
Fieldwork assessments included identifying and

Page 1                                                               Business Mix Analysis for the City of Wetaskiwin
                                                                                                         Introduction
Business Mix Analysis for the City of Wetaskiwin Page 2 Introduction
2.0 Location and Context
2.1 INTRODUCTION                                             Distribution Center which is a major employer in the
                                                             area. Simpson Park is zoned for light and heavy industrial
Location factors are an essential foundation to retail
                                                             uses as seen in Figure 2.1.
success, and an understanding of these factors can
help create the necessary conditions for attracting          Recreation, Culture and Amenities
and retaining businesses in a community. This section        The City of Wetaskiwin has a number of parks, fields
identifies the City of Wetaskiwin’s regional and local       and facilities, including the Manluk Centre and the Multi-
characteristics as they relate to the attraction and         Plex, which serves Wetaskiwin and the surrounding
retention of retail and commercial businesses.               communities.

                                                             Cultural and community destinations include Canada’s
2.2 LOCAL & REGIONAL CONTEXT                                 Aviation Hall of Frame, Reynolds-Alberta Museum,
The City of Wetaskiwin is located at the intersection        Alberta Central Railway Museum, Memorial Arts Centre,
of Highway 13 and Highway 2A within the County of            Wetaskiwin Theatre Society, Wetaskiwin Archives, and
Wetaskiwin and between the City of Edmonton and              Wetaskiwin Public Library.
the City of Red Deer. As a predominantly rural area
located in central Alberta, the County of Wetaskiwin’s
                                                             Health and Wellness
                                                             Wetaskiwin’s health and wellness sector is well
major economic generators include agriculture, oil and
                                                             established with a high concentration of addictions and
gas, forestry, manufacturing, construction, and tourism.
                                                             mental health centres, community care and continuing
The City of Wetaskiwin is the largest retail center in the
                                                             care centres, community education programs, and
County. The Canadian Pacific (CP) Railway bisects the
                                                             service providers. The Wetaskiwin Hospital and Care
community and is lined with industry to the south (40
                                                             Centre and the Wetaskiwin Community Health Centre
Avenue), and retail shops and services in the center of
                                                             are key anchors for this industry.
the City (50 Avenue). Shopping centres and big box retail
is concentrated along 56 Street (Highway 2A).
                                                             Housing
Retail and Industrial Areas                                  Residential development is concentrated in the
From a retail commercial perspective, the City of            northeast area of the City. Single detached houses are
Wetaskiwin has a number of distinct retail nodes,            the most common dwelling type, and apartments with
including the downtown, the Auto Mile corridor, and          fewer than five stories are the second most common.
to a lesser extent the Southeast Industrial node (see        Nearly a third of Wetaskiwin’s housing stock was built
Section 5.0: Commercial Supply for further details).         between 1961 and 1980, and approximately 93% of
The Denham Landing Commercial area, which currently          homes only need regular maintenance or minor repairs.
houses the Walmart complex and the Wetaskiwin
Shopping Centre, anchors the southernmost extent of
                                                             First Nations
                                                             Ermineskin First Nation, Louis Bull First Nation,
the regional shops and services node.
                                                             Montana First Nation and Samson First Nation (137
                                                             and 137A) are each located within a 30 minute drive
Existing industrial uses are clustered south of 47
                                                             of Wetaskiwin. Located south of Wetaskiwin along
Avenue between the railway and 47 Street in the
                                                             Highway 2A between Samson and Ermineskin First
South East Industrial Park. A scattering of retail uses
                                                             Nations, Maskwacis (formally Hobbema) is the primary
are also located in this area. The North East Industrial
                                                             economic and educational hub for the area. This rural
Park (between Highway 13 and the CP Railway, near
                                                             community includes two arenas, two recreation centres,
36 Street) is zoned for light industrial and commercial,
                                                             friendship and cultural centers, a number of shops and
and is located near the Home Hardware Western
                                                             services, a child wellness center, grocery stores, and

Page 3                                                                Business Mix Analysis for the City of Wetaskiwin
                                                                               Location and Background Information
the Panee Memorial Agriplex. The Corporate Division The result of this research was a report on consumer
of Ermineskin Cree Nation, Neyaskweyahk Group purchasing patterns and desirable shops and services.
Of Companies Incorporated (NGCI), is a prominent At this time, the Primary Trade Area and a Secondary
business owner in the community with nine companies Trade Area were estimated to be 50,364 and 93,636,
operating in the area. Their holdings include Maskwacis respectively. The Trade Area assumption was that
Mall and Neyaskweyahk Wildland Firefighters among people from outlying communities like Leduc and
others. Camrose would shop primarily in Wetaskiwin. This led
to an artificially inflated Primary and Secondary Trade
Educational facilities are also concentrated in this Area population which did not and does not accurately
community with the Maskwacis Education Schools reflect the number of potential consumers in and around
Commission managing five primary, elementary, Wetaskiwin.
secondary and high schools in the area. The Maskwacis
Cultural College and Maskwacis Employment Centre are In comparison, the analysis contained herein utilizes
also located in this community. a geographically smaller Primary Trade Area which
reflects Wetaskiwin’s unique position in the local retail
2.3 LOCAL PLANS AND REPORTS and commercial market. Further details on the creation
of the Trade Area are provided in Section 4.0: Retail
Road map to Prosperity Report (2009) and Market Demand Assessment.
Economic Development Action Plan (2015-
2018) Municipal Development Plan (2011)
The Road map to Prosperity report produced by EcDev
Solutions Ltd and Global Vision Consulting Ltd in 2009 The City of Wetaskiwin Municipal Development Plan
consisted of an economic base analysis, stakeholder (MDP) (Bylaw No. 1782-11) has been the guiding
engagement findings, and policy recommendations. planning document for the City since 2011 when it was
This report laid the foundation for the Economic enacted by Council.
Development Action Plan which outlined specific
initiatives to support balanced growth in all industry Economic development features prominently in the
sectors. Encouraging retail development and the MDP with two of the eight guiding principles supporting
continued growth of the Southeast Industrial Park and encouraging local economic development through
were key focus areas for the Plan. Specific action areas partnerships between businesses, community and
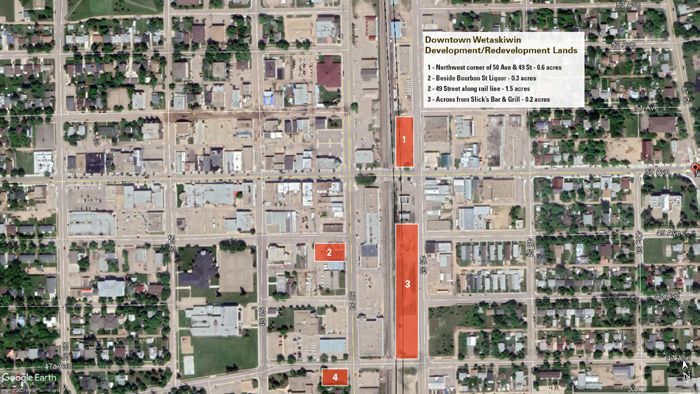
included revitalizing the downtown area, redeveloping government agencies. The MDP also outlined business
the Auto Mile, developing vacant and commercial land, growth and development as a growth sector for
and increasing economic development marketing among the City. Specifically, the plan encouraged infill and
others. expansion of Highway Commercial development in the
Highway Commercial District, with a particular focus
Wetaskiwin Retail Market Analysis (2012) south and north along 56 Street and east and west
In 2012, the City of Wetaskiwin commissioned Mustel along 40 Avenue.
Group to perform retail market research to determine
the extent and type of retail leakage in the Trade Area.
The Group performed a random telephone survey in
the Trade Area which asked residents where and how
often they shopped, merchandise sought, and what
businesses or goods and services they would like to see
in Wetaskiwin.
Business Mix Analysis for the City of Wetaskiwin Page 4
Location and Background InformationFigure 2.1: Zoning in the City of Wetaskiwin
(Source: City of Wetaskiwin)
Municipal Boundary
House Number
DCEM
RMH
DDO
RMX
PUD
R1N
R1R
TSC
R1A
MH
DC
UR
M1
M2
M3
RE
US
NZ
C1
C2
C3
C4
C5
R1
R2
R3
R4
R5
Legend
A
Last Updated: April 25, 2018
N:/Development Services/Wetask/muni_production/Workspaces/Zoning Map with Address
Page 5 Business Mix Analysis for the City of Wetaskiwin
Location and Background InformationFigure 2.2: City of Wetaskiwin Highway Traffic Counts
(Source: Alberta Transportation and FBM)
⇑
City of Wetaskiwin Highway Traffic Counts
Annual
Intersection Average
Direction
of: Daily
Traffic
North on 2A 8600
Hwy 2A & East on 13 6860
⇩ ⇩ 1 13N of South on 2A
Wetaskiwin West on
9670
1170
TWP Rd 464
⇩
⇩
2
⇩
⇩
⇩
1
⇩
North on 90
RGE RD 240
Hwy 13 & East on 13 3790
2
36 ST South on 36 1330
St
West on 13 3830
North on 180
RGE RD 245
Hwy 13 &
East on 13 3260
3 RGE RD
South on 100
245
RGE RD 245
⇩ ⇩ West on 13
North on
3180
1520
⇩
⇩
4
⇩
RGE RD 240
⇩
⇩
3
⇩
Hwy 613
East on 613 1660
4 & RGE RD
South on 130
240
RGE RD 240
West on 613 2430
Highway Traffic Count data (2019) provided by the Province of
Alberta (https://www.alberta.ca/highway-traffic-counts.aspx).
Basemap from https://www.altalis.com/map;id=201
Map created by FBM, Oct 29 2020
Figure 2.3: City of Wetaskiwin Traffic Counts ⇑
(Source: City of Wetaskiwin and FBM) City of Wetaskiwin ⇃
Traffic Counts
⇃
⇃
47 St
⇃
⇃⇃
Northbound
56 St
⇃⇃ ⇃
Southbound
56 St
50 St
⇃
⇃
50 Ave
⇃
⇃
⇃
⇃
⇃
⇃
⇃
⇃
⇃
Street Nearest 7 Day Average
Intersection* Count (2018)
50 Street 50 Ave 2215
56 Street S. 56 Ave 2973
56 Street N. 56 Ave 3625
50 Ave 50 Street 4305
⇃ 47 Street Northmount Dr. 4425
⇃ 40 Ave 40 Ave 53 Street 5758
56 St
50 Ave 56 Street 6164
⇃
⇃
⇃
⇃
⇃
⇃
56 Street 40 Ave 9779
*To data collection point.
Traffic count data (2018) provided by the City of Wetaskiwin,
Spring 2020. Basemap from https://www.altalis.com/map;id=201
Map created by FBM, Oct 29, 2020
Business Mix Analysis for the City of Wetaskiwin Page 6
Location and Background InformationThe intention of the City was to diversity the north-south routes in Alberta, and Highway 13 which
local economy through commercial and industrial connects Eastern Alberta to Saskatchewan. For many
development by types of businesses, the ability to be accessible and
• having a sufficient supply of developed and visible to high volumes of traffic are among the most
undeveloped commercial and industrial properties to influential considerations.
meet the market demand.
• facilitating the development of well-planned The most recent traffic counts available are from
business/industrial parks. Alberta Transportation and the City of Wetaskiwin.
• promoting the continued development of all Traffic volume tables and graphs are provided in
business districts and intensification of underutilized Figures 2.2 and 2.3. The highway traffic counts
land and buildings. show Annual Average Daily Traffic (AADT) for 2019
In line with these policies, the City continues to position for the intersection of Highway 2A and Highway 13 to
itself as a centrally-located hub for commercial and be approximately 8,000 to 10,000 vehicles for those
industrial development at competitive rates. headed north, south or east. Passenger vehicle traffic
accounts for approximately 90 to 98% of that traffic,
Strategic Plan (2018-2022) with single unit trucks and tractor trailer units accounting
The economic policies outlined in the MDP are further for 2-2.7% and 3.1-5.5% respectively. This is the busiest
supported by the City of Wetaskiwin Strategic Plan highway intersection in and around the City, with
2018-2022 which is founded on 4 pillars: building the other intersections ranging from approximately 100 to
community, economy, infrastructure, and a strong 4,000 AADT vehicle trips per direction. Data collected
government. It is the City’s intention to have a robust by the City of Wetaskiwin (2018) shows north and
industrial hub at the South East Industrial Park, a vibrant southbound traffic along 56 Street (at 40 Avenue) is
and active commercial downtown, and a welcoming and comparable to the Highway 2A and 13 intersection, with
attractive Auto Mile, while also encouraging the growth an approximate average of 9,800 vehicles over a seven
of Wetaskiwin’s Regional Airport, tourism and residential day period. Traffic is similarly high east and westbound
development. along 40 Avenue (at 53 Street) with approximately 5,750
vehicles. However the downtown area (50 Avenue
This Business Mix Analysis supports the goals of and 50 Street) each have comparatively lower traffic
the Strategic Plan by identifying new investment counts with approximately 4,300 and 2,200 vehicles,
opportunities, investigating the potential for market respectively. Higher traffic counts around the periphery
expansion, informing the forthcoming Economic of the City are likely due to the concentration of retail,
Development plan, and providing a foundation for commercial and industrial developments in these areas.
the tourism, airport business, and marketing plans,
respectively. The City of Wetaskiwin currently does not have a public
transportation system, but the Wetaskiwin Community
Transportation Society does run a Transit Handi-Van
2.4 TRANSPORTATION CONTEXT service for seniors and those with mobility impairments.
One of the most significant aspects to successful
commercial development relates to patterns of There are also a number of walking pathways and trails
transportation - whether this be driving (and parking), in the City which connect residents and visitors with
walking and cycling, or via railways. recreation facilities and amenities. The downtown area
is fairly walkable with sidewalks, crosswalks, appealing
The City of Wetaskiwin is located on Highway 2A which storefronts and clustering of businesses. Local interest
runs roughly parallel to Highway 2, one of the main in building an active lifestyle led to the establishment
Page 7 Business Mix Analysis for the City of Wetaskiwin
Location and Background Informationof the WalkABle Wetaskiwin Committee (WWC) in Figure 2.4: City of Wetaskiwin Development 2014 which focuses on promotions, events and trail Permits Issued (Source: City of Wetaskiwin and FBM) improvements. The City is home to the only local General Aviation airport in the area, the Wetaskiwin Regional Airport, which provides service between Calgary and Edmonton along the low altitude air highway (Victor301W). The airport specializes in maintenance, repair and overhaul, as well as flight training. The City is looking to develop a master plan for the airport and adjacent lands to support the airport as an aviation cluster of activity and local economic generator. Similar to how the airport supports the distribution of goods and people via the airways, the CP Railway provides overland transportation of goods Figure 2.5: City of Wetaskiwin Development to and from Wetaskiwin. Notably, many of the industrial Permit Revenue (Percentage) (Source: City of areas in the City are located near the railway for ease of Wetaskiwin and FBM) access to those markets. The proximity of Highway 2A, 2 and 13, and the variety of transportation modes available make Wetaskiwin a hub of industry in central Alberta. 2.5 BUILDING PERMITS Building Permit activity can provide empirical evidence of growth dynamics necessary to support commercial and retail opportunities. Figures 2.4 and 2.5 illustrate the volume of building permits in Wetaskiwin over the past five years (2015- 2019). The number of development permits issued has remained relatively stable over this time period, with the number of commercial permits exceeding residential permits. However residential development represents a larger portion of the permit revenue in terms of percentage of total revenue. Boulevard 1916 and Denham Landing are currently the only retail developments under construction in the City. Business Mix Analysis for the City of Wetaskiwin Page 8 Location and Background Information
3.0 Trends
3.1 INTRODUCTION                                            Demand for e-commerce and delivery services is
                                                            expected to continue to grow even as consumer
The following section provides a high level overview        preferences shift (PWC, 2020). The role of brick and
of the impact that the COVID-19 Pandemic has had on         mortar stores is also shifting. Retailers will likely need
retail, as well as some of the trends that have become      fewer physical stores which could free up capital for
more prevalent and likely to continue shaping the retail    other investments, however consumers (particularly
landscape.                                                  Generation Z) are still looking for reasons to make
                                                            trips to the store (PWC, 2020). This trend encourages
3.2 COVID-19                                                businesses to invest in retail experiences while also
                                                            addressing health and safety concerns (PWC, 2020).
The novel Coronavirus (COVID-19) has changed the way
many Canadians work, shop, travel and trade. More           The pandemic has also quickened the structural decline
people are working from home, shopping online, and          of apparel sales and malls which were struggling even
vacationing and traveling locally, while companies invest   before the pandemic (McKinnon, 2020).
in technology and encourage consumers to buy local
goods (Eight Ways COVID Will Transform the Economy          Small Businesses
and Disrupt Every Business, Stackhouse, 2020).
Canadians are spending less time in brick and mortar        Alberta’s small businesses have also faced a number of
establishments and many are opting to travel on foot, on    challenges over the preceding months, including lower
wheels, or via a personal vehicle instead of using public   than usual staffing capacity and revenues (Canadian
transit.                                                    Federation of Independent Businesses, 2020). Top
                                                            reasons for less than usual revenues across Canadian
Over the month of November, the province of Alberta         small businesses in the retail trade, health care and
saw approximately a 19% reduction in the number             social assistance, construction, accommodation and
of retail and recreation trips (baseline median value       food services, and manufacturing sectors include:
calculated based on data collected between Jan 3 –             • Fewer customers (64% of those in retail selected
Feb 6, 2020 through Google’s Community Mobility                  this as a reason)
Reports). Trips to workplaces were down 29%, while
                                                               • Each customer is spending less on average
trips to home were up 12% over that same time period.
                                                                 (manufacturing 57%)
Similarly, trips to parks were down 18% after seeing a
high number of trips to parks over the warmer months.          • Operational challenges (social services 42%, retail
As a City with many park and recreation amenities,               33%, construction 32%)
Wetaskiwin is likely a prime destination for those             • Government restrictions limit our business
spending time closer to home.                                    activities (hospitality 43%, social services 34%)
                                                               • We cannot get all the staffing we need (hospitality
E-Commerce Trends                                                26%, construction 25%, social services 20%)
COVID-19 has accelerated many existing retail trends           • We had to increase our prices (social services
that retailers have been seeing for years (Accelerating          15%, retail 11%)
shifts driving a radical rethink of the customer journey,
                                                            While this study by the Canadian Federation of
PWC, 2020). E-commerce sales in Canada are
                                                            Independent Businesses is not specific to Wetaskiwin,
continuing to grow with an expected increase from
                                                            the findings do illustrate some of the common
6.8% of retail sales in 2019 to 8.7% in 2020, however
                                                            challenges facing the City’s top industries.
sales in brick and mortar establishments still represent
the majority of purchases (The Top Retail Trends in
Canada in 2020 to Watch, McKinnon, 2020).

Page 9                                                                Business Mix Analysis for the City of Wetaskiwin
                                                                                                                Trends
COVID-19 has also changed many Canadian main Table 3.1 Statistics Canada Retail Sales Year-over-Year
streets. Small businesses that tend to cluster around 2020 to 2019
main streets have been particularly hard hit with many (Source: Statistics Canada & FBM)
being forced to close due to loss of revenue, limited
financial backing and or limited in-house e-commerce
BROAD
expertise according to J.C Williams Group (Operational RETAIL MERCHANDISE or
MARKET TENANT NA
BUSINESS CATEGORY
Trends and Potential Actions for Main Street Retail CATEGORY
Recovery, 2020).
Statistics Canada Retail Sales
In response to these losses and the ongoing challenges Annualized Estimates ((Y-O-Y Jan to
Sept and forecast Oct to Dec)
businesses are experiencing, the Canadian Urban
Institute (CUI) launched the Bring Back Main Streets Motor vehicle and parts dealers [441] -9.5%
campaign which is a collective action and research Furniture and home furnishings stores [442] -8.3%
Electronics and appliance stores [443] -0.7%
project focused on main street survival and resilience. Building material and garden equipment and supplies dealers [4 10.0%
The CUI has produced a number of toolkits and Food and beverage stores [445] 10.4%
Grocery stores [4451] 9.1%
solutions briefs which can be used by governments,
Specialty food stores [4452] 9.8%
local business organizations, business owners, and Beer, wine and liquor stores [4453] 19.0%
others to inform decision making and inspire action. Health and personal care stores [446] -2.0%
Gasoline stations [447] -7.5%
Clothing and clothing accessories stores [448] -36.4%
The importance of main streets and local businesses Sporting goods, hobby, book and music stores [451] -23.5%
to the social and economic wellbeing of Canadian General merchandise stores [452] 3.4%
communities has never been as clearly recognized Miscellaneous store retailers [453] 9.2%
Cannabis stores [453993]6 56.6%
as in the present moment. The national focus on Total, food services and drinking places -28.9%
reinvigorating Main Street areas presents an opportunity Special food services [7223] -68.5%
Drinking places (alcoholic beverages) [7224] -76.1%
for communities like Wetaskiwin to strengthen their Full-service restaurants [722511] 3 -53.6%
downtown areas by supporting businesses and Limited-service eating places [722512] 4 -11.6%
planning for retail changes. For more information, see
bringbackmainstreet.ca/solution-briefs. Leisure and entertainment (ESTIMATE) -20.0%
Personal services (ESTIMATE) -25.0%
Statistics Canada Retail Sales Conversely, the conveniences and day-to-day
necessities falling under food and beverage stores,
According to data from Statistics Canada as summarized such as grocery, specialty foods and beer, wine and
in Table 3.1, retail sales has been very volatile across a liquor have fared much better and are forecast to exhibit
range of spending categories. positive year-over-year growth, as have miscellaneous
store retailers that typically include dollar stores.
As evidenced in Table 3.1 in which retail sales have
been annualized and forecast to year end 2020, it is 3.3 PRE & POST COVID GENERAL
clear the magnitude of impact on specific categories TRENDS
has been severe. In the case of food services the
impact has ranged from -11.6% for limited service eating In early 2020, before covid-19 had upended retailers
worldwide, Master Card released a report called, “The
places to 53.6% and -76.1%for full service restaurants
Best Vision is Insight.” It outlined predictions for the top
and drinking places respectively. Similarly, clothing and
retail trends of 2020. The pandemic has, if anything,
fashion has struggled with a decline in year-over-year
made them more insightful.
sales forecast to be in the order of 36.4%.
Business Mix Analysis for the City of Wetaskiwin Page 10
TrendsMost notable among these trends, which have Loyalty Reinvented
relevance to a market like Wetaskiwin included:
Communities like Wetaskiwin were historically driven by
• Personalization a strong local culture which often came with a loyalty.
• Frictionless Retail As retail evolved over the last 20 years, local loyalty
• Loyalty Reinvented shifted to brand and bigger store loyalty. In essence,
loyalty has largely been transactional. However, the
Personalization tide is turning back towards a local culture of loyalty
as bigger brands became more anonymous and less
“Social distancing” may have became a popularized
“personal”.
phrase in 2020, but in reality because of the evolution
of our technology-centric day-to-day lives, many have
It can be expected that over the next 2 years more
been practicing some form of social distancing for
recognized brands and stores will close and fewer
many years. Consequently, the desire for a return to
retailers will be as aggressive in their expansion plans.
genuine human interactions had already begun as
Combined with this, trends pre and post COVID-19
well. Personalization by its mere definition implies that
indicated that retailers were acquiring smaller
something is inherently personable. On a broader scale,
footprints or store sizes in order to maximize their sales
even the most personal offers and experiences can feel
productivities, while harnessing their omni-channel
remote without a human touch. Consumer desires for
focus.
in-person contact is now stronger than ever. Ultimately,
it’s a question of balance. E-commerce is growing
because of COVID-19, but that doesn’t mean the 3.4 TRENDS IN DEVELOPING
physical store presence in the form of traditional bricks SUCCESSFUL RETAIL IN
and mortar won’t be appreciated more in the future.
SECONDARY MARKETS
Frictionless Retail
According to the International Council of Shopping
Efforts to improve and simplify the online and offline Centers’ (ICSC) “Developing Successful Retail
in Secondary and Rural Markets”, targeted retail
checkout experience didn’t originate with COVID-19, but
recruitment, particularly for branded retailers or
the result of COVID-19 has been to increase the urgency
franchises, should reach out to those retailers or
for ease of use and improvements.
developers who may not have discovered a compatible
community yet. The process to attract businesses
Traditionally, and even as utilized in this particular
must be tempered by reality and thus cognizant of the
study, a community or retailer’s Trade Area is critical following:
to determine the area from which the most frequent
customer patronage will originate. COVID-19 has • Pay attention to geographic operations for retailers.
somewhat inverted that putting people in control and at Do not expect deviations from their base of
the centre of the retail market, regardless of where they operations to serve a small community;
may be located. This is simply because of a reluctance • Accept that most retailers have established
or inability to travel, which has also spurred a “drive” to minimum Trade Area populations or income
increase reliance on shops and services that are located thresholds for success based on years of operating
closer to one’s residence. For Wetaskiwin, the Trade experience;
Area may not be physically growing, but the opportunity, • Understand that limited consumer spending in small
as will be discussed, to garner deeper and more communities cannot support some retailers offering
frequent penetration of its Trade Area residents will be specialized merchandise assortments;
critical for businesses to succeed.
Page 11 Business Mix Analysis for the City of Wetaskiwin
Trends• Be realistic about how the business opportunity By way of a checklist, these include:
in a respective community ranks against other
; Population characteristics of the consumer base;
opportunities in front of the retailer; and
; The reality that retail follows consumers;
• Understand the co-tenancy requirements that
retailers have established as predictors of success. ; Consistent and high shopper traffic is a
Overall, commercial real estate continues to shift to prerequisite for most retailers;
meet the rapidly changing tastes and needs of target ; The consumer base must demonstrate sufficient
markets. Consumers now value uniqueness, and buying power to be of interest to retailers;
they are quick to switch their brand allegiance. These
emerging trends require new developments that are ; Chain retailers have a limited number of
adaptable and flexible, can stay relevant and retain their prototypical store formats that they are willing to
consumer base. operate. Deviating from these established formats
is done only as a last resort in circumstances
One of the most critical aspects to being proactive and
understanding whom to target starts with creating a where demand for a location by a retailer or
business case based on some statistical foundation. developer is high;
A statistical business case is typically required to ; Most retailers require sites with convenient
explain the merits of a community. It is important to
access, high visibility, and ample parking;
first establish an understanding of the communities
before promoting any specific site option. Wetaskiwin ; Most retailers expand in well-defined geographic
was profiled to illustrate and document the following areas that coincide with distribution network and a
statistical facts: familiarity with consumer preferences;
• Geographic delineation of the Retail Trade Area ; Most retailers have established criteria for site
that reflects a realistic drive time or market selection;
penetration;
; Clustering of compatible retailers is the norm;
• Demographic and economic profiles of the Trade
; Retailers cannot generally survive rent-to-sales
Area population;
ratios in excess of 15%. Retailers have a threshold
• Growth projections for the Trade Area population; level of sales they know they must achieve to be
profitable; and
• Annual retail spending;
; Retailers attempt to maximize profitability by
• Sales performance of key retail categories;
operating the fewest number of stores possible in
• Current and forecasted estimated retained market any market to avoid sales transference.
share of Trade Area spending; and
• Current and forecasted supportable retail space.
Retail Development Fundamentals
Retail development, whether in secondary communities
such as those found in Wetaskiwin, or like those in
more urban markets like Edmonton, are driven by critical
business fundamentals that must be acknowledged and
considered when identifying retail opportunities.
Business Mix Analysis for the City of Wetaskiwin Page 12
Trends4.0 Trade Area
4.1 INTRODUCTION Trade Area Determinants
1. Transportation networks, including streets and
In order to create a framework for evaluating retail
highways, which affect access, drive times,
demand and subsequent gaps in the provision of shops
commuting and employment distribution patterns;
and services, it is necessary to define and identify the
2. Major infrastructure projects both planned or under
Primary Trade Area (PTA) from which Wetaskiwin’s retail
development which could affect future travel
sales are most frequently and likely to be sourced and
patterns;
generated. Our focus is on Wetaskiwin’s PTA, however
3. Overall community development vision, including an
inflow from outside of this area will be accounted for in
understanding of key nodes’ characteristics;
the results.
4. Local and regional competitive environment, present
and future;
The Trade Area recognizes drive times, demographics,
5. Proposed generative uses (retail, cultural, civic, etc.)
spending attributes and competition, which collectively
and their relationship within the wider market;
portray the market to prospective tenants, developers
6. Significant natural and man-made barriers (e.g. water
and investors.
features, highways, industrial areas);
7. De facto barriers resulting from notable
Identifying the Primary Trade Area is important for
socioeconomic differentiation; and
understanding the total market potential available to
8. Patterns of existing and future residential and
current and future retailers. The local and regional
commercial development.
residential base has particular demographic and
spending habits that provide insight as to the type of
For this particular study, the Primary Retail Trade
compatible retail tenants, the amount of retail floor
Area shown in Figure 4.1 and Figure 4.2 utilizes a
space supportable in the market, and the current inflow
combination of drive times and competitive forces.
or outflow of retail sales, and for which categories such
Wetaskiwin represents a key economic market for
inflow or outflow exists.
communities within a 30 to 60 minute drive time south
and west of the City, respectively. These drive times
As a first step, a Retail Trade Area is delineated to
are crucial to supporting a growing retail and industrial
identify the geographic region from which regular
market.
patronage could be expected, based on a series of
boundary determinants.
Specifically, the Trade Area includes the Town of
Ponoka, Town of Millet, and the hamlets of Falun,
Major considerations in defining a Retail Trade Area
Gwynne, Mulhurst Bay, Village of Pigeon Lake,
were applied to the City of Wetaskiwin, as a retail
Westerose and Winfield. Samson First Nation,
centrality, to determine its most realistic Trade Area, as
Ermineskin Cree Nation, Louis Bull First Nation and
well as to help sensitize potential market share inputs of
Montana First Nation are also included in the Trade Area.
corresponding Trade Area retail spending.
Page 13 Business Mix Analysis for the City of Wetaskiwin
Trade AreaYou can also read