Brexit and the UK's Public Finances - IFS Report 116 Carl Emmerson Paul Johnson Ian Mitchell David Phillips - Institute for Fiscal Studies
←
→
Page content transcription
If your browser does not render page correctly, please read the page content below
Brexit and the UK's
Public Finances

IFS Report 116

Carl Emmerson
Paul Johnson
Ian Mitchell
David Phillips

Brexit and the UK’s Public Finances

              Carl Emmerson

        Institute for Fiscal Studies

               Paul Johnson

        Institute for Fiscal Studies

               Ian Mitchell

        Institute for Fiscal Studies

               David Phillips

        Institute for Fiscal Studies

       Copy-edited by Judith Payne

        Institute for Fiscal Studies
           7 Ridgmount Street
           London WC1E 7AE
Published by

       The Institute for Fiscal Studies
            7 Ridgmount Street
            London WC1E 7AE
        Tel: +44 (0) 20-7291 4800
        Fax: +44 (0) 20-7323 4780
         Email: mailbox@ifs.org.uk
       Website: http://www.ifs.org.uk

© The Institute for Fiscal Studies, May 2016

         ISBN 978-1-911102-13-7
Preface The authors gratefully acknowledge support from the Economic and Social Research Council’s ‘The UK in a Changing Europe’ Initiative (http://ukandeu.ac.uk/). Co-funding was provided by the ESRC Centre for the Microeconomic Analysis of Public Policy (CPP), grant number ES/M010147/1, which is based at the Institute for Fiscal Studies (IFS).
Contents

       Executive Summary                                                          1
1.     Introduction                                                               7
2.     The Direct Impact of Brexit on the Public Finances                         8
     2.1 How much does the UK contribute to the EU and how does it affect the
     public finances?                                                             8
     2.2 What can other countries tell us about what the UK might contribute to the
     EU following Brexit?                                                         12
3.     Brexit and the UK’s National Income                                       17
     3.1 Overview of economic assessments of Brexit                              17
     3.2 Economic relationship with the EU                                       19
     3.3 Policy options for the UK outside of the EU                             23
     3.4 Key issues and why the assessments differ                               28
     3.5 Conclusion on short and long-term economic impacts                      46
4.     Brexit and the UK’s Public Finances                                       50
     4.1 Impact of changes in national income on the public finances             50
     4.2 Scenarios for the short-term impact on borrowing                        55
     4.3 Scenarios for the long-run public finance impact                        61
     4.4 Conclusion                                                              64
5.     Conclusion                                                                66
Appendix A. Possible reasons for deviations in the impact of national income on
the public finances                                                            68
References                                                                       72
Executive Summary
If the result of the referendum on 23 June leads to the UK leaving the EU, there
will be impacts on the UK public finances. This report aims to set out the possible
impacts, focusing particularly on the short run, given that the Chancellor wishes
to achieve a budget balance by the end of this parliament. We also look at
possible long-run consequences.
The overall impact on the public finances will depend on two distinct
components, each of which is uncertain to some degree:
• The mechanical effect. As a net contributor to the EU, leaving the EU would
strengthen the public finances because our net contribution would fall. But
given uncertainty over the form of any subsequent arrangement with the EU,
it might not necessarily fall to zero.
• The national income effect. Any effect of leaving the EU on UK national
income would affect the public finances. A rise in national income would
strengthen the public finances, a fall would weaken them.
The mechanical effect
The UK’s notional gross contribution (i.e. ignoring the UK’s rebate) in 2014 was
£18.8 billion, which is about 1% of GDP. It is by dividing this number by 52 weeks
that one comes to the widely-reported figure of over £350 million a week as the
UK’s contribution to the EU. But in this context, ignoring the rebate is clearly
inappropriate. It is equivalent to suggesting that were the UK to leave the EU and
not make any financial contribution to the EU’s budget then remaining EU
members would continue to pay the rebate to the UK. That is clearly absurd. The
correct figure to use for the UK’s gross financial contribution takes account of the
rebate. It stood at £14.4 billion, or 0.8% of GDP, in 2014. 1 (This is equivalent to
around £275 million a week.)
In principle, the UK’s public finances could be strengthened by that full
£14.4 billion a year if we were to leave the EU. However, the EU returns a
significant fraction of that each year. The amount varies, but on average our net
contribution stands at around £8 billion a year. That is £8 billion a year that we
could use to fund other spending, cut taxes or reduce the deficit. Table 1 shows
these direct, mechanical effects on the UK’s budget.
If we decided to spend less on agriculture, rural development, regional support or
university research, we would be able to boost the £8 billion of available money –
though obviously at the expense of current recipients who would lose out from
such a change.
1
Figures from HM Treasury (2015).
1
© Institute for Fiscal StudiesBrexit and the UK’s public finances
Table 1. The UK’s financial contribution to the EU Budget, 2013 and 2014
% of £bn £m per
GDP week
2013
Gross contribution 1.0 18.1 350
Contribution net of rebate 0.8 14.5 275
Contribution net of rebate and spending by 0.5 9.1 175
the EU in the UK
2014
Gross contribution 1.0 18.8 350
Contribution net of rebate 0.8 14.4 275
Contribution net of rebate and spending by 0.3 5.7 100
the EU in the UK
Approximate likely contribution net of 0.4 8 150
rebate and spending by the EU in the UK
going forwards
Note: Full details available in Browne, Johnson and Phillips (2016). Spending per week rounded to
the nearest £25 million.
There is uncertainty about what trade deal we would negotiate after leaving the
EU. Key Brexit campaigners seem to have ruled out any deal that would involve
membership of the European Economic Area (EEA), like Norway. In part, that is
because the UK would likely have to make a significant contribution to the EU
budget in those circumstances. If the UK were to make proportionally the same
net contributions that Norway makes, for instance, these might amount to about
half our current net contribution, leaving us with a strengthening of the public
finances of around £4 billion. The precise amount would depend on negotiations
and what, if any, EU programmes the UK decided to participate in. (The actual
financial flows between the EU and Norway are more opaque than one might
expect.)
Looser arrangements such as those agreed with Canada could allow the UK to
avoid paying into the EU budget but would entail less access to the EU’s markets,
especially in services. It is worth noting that no country outside the EEA has full
access to the EU’s financial services markets – not even Switzerland, which does
contribute to regional development funding (albeit to a lesser extent than EEA
members such as Norway).
The national income effect
If leaving the EU were to have no effect on national income, then the public
finances would be unambiguously strengthened. However, the public finances are
sensitive to even relatively small changes in national income. So if the economy
were to be just 1% bigger or smaller, then borrowing as a share of national
income could in today’s terms be around £14 billion less or more as a result. If
2Executive summary
leaving the EU were to reduce national income by just 0.6%, that would be
enough to outweigh the positive effect on the public finances of freeing up the net
£8 billion that we currently contribute to the EU. Clearly if we were to strike a
deal similar to the Norwegian one that involved us continuing to make a net
financial contribution to the EU, then even smaller negative GDP effects would be
enough to overwhelm the direct effect.
The precise effect of leaving the EU on national income is uncertain. There is
uncertainty about the precise deal we would reach on trade; there is uncertainty
about how much of the freedom to, for example, change regulations (including
immigration policy) would be used; and there is uncertainty over the effects of
each of these on growth. When thinking about the effects on national income, it
also matters whether we are looking at a short-term or a long-term effect. A
number of studies have been carried out on the likely effects on national income.
There is a range of estimates for each.
Short-term effects
Of the 14 organisations we have been able to find that have quantified the short-
run effects on national income, 12 suggest the effects would be negative, one
(broadly) neutral, and one (Economists for Brexit) suggests a positive effect on
national income. This does not include the Bank of England, which, whilst not
quantifying the likely effect, has nevertheless made it clear that it believes there
could be a significant negative effect (Bank of England, 2016).
These negative effects in the first few years following a vote to leave are driven
by a combination of an increase in uncertainty, a likely fall in the value of sterling
and increase in inflation, an increased cost of borrowing, and the first impacts of
the ‘longer-run’ effects on, among other things, trade (see below). The increase in
uncertainty in particular would be likely to drive a reduction in both
consumption and investment, particularly foreign direct investment, with a direct
effect on GDP as well as, in the case of the latter, a potential longer-term negative
effect on productivity.
The estimates of short-run effects range from reducing GDP by 6% (Société
Générale and the Treasury’s ‘severe shock’ scenario) to increasing it by 1.6%
(Economists for Brexit). Within these estimates, those by the National Institute of
Economic and Social Research (NIESR) are based on a particularly
comprehensive economic modelling exercise. Its estimates also happen to lie
towards the middle of the range of estimates. NIESR’s most optimistic scenario –
one that depends on the UK signing up to the EEA – implies a GDP loss of 2.1% in
2019 relative to what GDP would have been had we stayed in the EU. The most
pessimistic scenario it reports, which assumes no special free trade deal with the
EU, would see GDP 3.5% lower than otherwise in 2019. This latter scenario is
also modelled by the Treasury as a ‘severe shock’, which suggests a 6% hit to GDP
two years after a Brexit vote.
3Brexit and the UK’s public finances We estimate that if NIESR has broadly the right range of possible outcomes for GDP, then the budget deficit in 2019–20 would be between about £20 billion and £40 billion higher than otherwise. In the Treasury’s analysis, they estimate that their short-term hit to GDP results in a much smaller increase in public sector net borrowing than our estimates imply. This is because their shock involves much higher inflation, which they implicitly assume leads to spending by Whitehall departments on the delivery and administration of public services being less generous in real terms. In other words, they have built a significant real cut to public spending into their numbers. In any of these scenarios, the government would fail to reach a budget surplus in 2019–20 unless it were willing to raise taxes or cut spending by more than is already planned. In the most optimistic scenario, an additional fiscal tightening of 0.8% of national income (£15 billion in today’s terms) – on top of what is already planned for this parliament – would be required just to get to budget balance. That is roughly the amount that would be saved if the government undertook a combination of measures such as: increasing the cuts to day-to-day spending by central government on public services planned for this parliament by 40% (from £12 billion to £17 billion); increasing the size of the planned cuts to social security benefits and tax credits by 40% (from £12 billion to £17 billion); and increasing both the basic and higher rates of income tax by 1p (which would raise an estimated £5½ billion). Even this would only achieve a forecast budget balance. To restore the 0.5% of national income surplus that the Chancellor is currently aiming for would require a further £10 billion of spending cuts and tax rises to be found. A more likely response might be to delay the target to reach budget balance. In this case, spending cuts (or tax increases) at the same rate as we are experiencing over this decade would need to be implemented for an additional year or two years (depending on whether the more optimistic or pessimistic scenario turns out to be correct). Lower growth would also lead to public sector net debt falling less quickly as a share of national income. Under the most optimistic NIESR scenario, public sector net debt would fall by just 2.2% of national income between 2015–16 and 2019– 20, with half of this decline coming in the current financial year, before most of the hit to national income would occur. This compares with the OBR’s latest forecast for public sector net debt to fall by 6.7% of national income over this period. Long-run effects In the long run, the effects of uncertainty recede and trade effects dominate, with most models suggesting a negative effect from reduced access to EU goods and services markets. Some loss of foreign direct investment also has a negative effect, while some positive effect is possible from some reduction in regulation. If inward migration is reduced, models suggest a further negative effect. 4
Executive summary

Again, of all the studies we are aware of that quantify a long-run effect on
national income, Economists for Brexit are an outlier in suggesting a positive
central estimate. This derives largely from their assumption that UK exports
would be unaffected by leaving the EU and that, if we came out of the EU, we
would embark on a policy of unilateral free trade – i.e. completely drop our tariffs
on imports without necessarily receiving reciprocal agreements for our exports.
They suggest such a policy could significantly reduce import prices, boost
national income by 4%, and increase the size of our highly productive service
sector, at the expense of our agricultural and manufacturing sectors. Other
studies – for example, those by the Centre for Economic Performance (CEP) and
Open Europe – also look at the impact of unilateral free trade but find much
smaller effects.

With the exception of Open Europe (which suggests the effect could be
marginally positive or negative), all other quantitative analyses suggest that GDP
would be materially lower in the long run if we were to leave the EU. There is
significant variation in the scale of the negative effects, driven by two
considerations. First, most of the models suggest that the more we can replicate
current access to the single market – for example, by membership of the EEA –
the lower the cost of exit will be. By contrast, the further we move from that
model – for example, relying on World Trade Organisation (WTO) rules – the
greater the cost. Second, it matters a great deal whether ‘dynamic’ effects of trade
are included in the models. That effectively means taking account of the knock-on
effects of less openness and less trade on productivity across the economy. That
such effects exist is not controversial, but there is much uncertainty over their
size. Taking account of these dynamic effects, and assuming WTO rules, NIESR,
CEP and HM Treasury all find that GDP could be more than 7% less in the long
run than it would otherwise have been.

In the long run, a neutral assumption for the public finances is that tax and
spending will remain at a constant level as a proportion of GDP. If GDP is lower,
then public spending will be lower in cash terms. If the GDP effect were to be in
line with NIESR’s more pessimistic scenario, this could lead to public spending
being £48 billion lower than otherwise in 2030. On more optimistic assumptions,
the effect could be much smaller – just £7 billion.

Conclusion
The mechanical effect of leaving the EU would be to improve the UK’s public
finances by in the order of £8 billion – assuming the UK did not subsequently sign
up to EEA or an alternative EU trade deal that involved contributions to the EU
budget. However, there is an overwhelming consensus among those who have
made estimates of the consequences of Brexit for national income that it would
reduce national income in both the short and long runs. The economic reasons
for this – increased uncertainty, higher costs of trade and reduced FDI – are clear.
The only significant exception to this consensus is ‘Economists for Brexit’.

                                                                                  5
Brexit and the UK’s public finances In the short run, our estimates therefore suggest that the overall effect of Brexit would be to damage the public finances. On the basis of estimates by NIESR, the effect could be between £20 billion and £40 billion in 2019–20, more than enough to wipe out the planned surplus. In the long run, lower GDP would likely mean lower cash levels of public spending. To put this in context, dealing with the public finance effect would require at least an additional one or two years of ‘austerity’ – spending cuts or tax rises – at the same rate as we have experienced recently to get the public finances back to balance (should that remain the government’s priority). Following this path would also mean government debt remaining higher than otherwise, and additional debt interest payments. These are important costs that would mean difficult decisions on tax, benefits and public services, but are not unmanageable if we wanted to pay them. The fiscal effects of leaving the EU would, of course, be only one part of the wider economic, social and political impacts of Brexit, all of which need to be taken into account. 6
1. Introduction
   If the UK were to decide to leave the European Union, many aspects of political
   and economic life would be affected. One of those would be the UK’s public
   finances. This would happen in a direct way. We are currently a net contributor
   to the EU budget and, in that respect, leaving the EU would strengthen our public
   finances. The amount we currently contribute, and could potentially save, is
   arithmetically quite straightforward to calculate. But public finances depend
   crucially on the strength of the overall economy, and if the economy were to be
   stronger or weaker outside the EU than within it then this effect would be likely
   to overwhelm the direct effect.

   In this report, we consider both the possible direct and indirect consequences of
   a Brexit for the UK’s public finances. In Chapter 2, we look at the direct effects.
   Were we to leave the EU and not join the European Economic Area (EEA) or
   similar arrangement, these effects are fairly clear. But there remains the
   possibility that in a post-Brexit world, the UK would sign up to all or some of the
   responsibilities that would go with joining the EEA, so we also look at what
   effects that might have.

   Chapter 3 looks at the now considerable literature and results from modelling the
   possible economic consequences of leaving the EU. It sets out the scale of trade
   with the EU and other partners and the role of tariffs – and other non-tariff
   barriers – and looks at the different options in terms of trade agreements
   following a leave vote. It then looks at both the short- and long-term possible
   economic effects of leaving the EU, drawing on the various studies and explaining
   the possible roles of uncertainty, trade, foreign direct investment, regulation and
   immigration.

   Chapter 4 goes on to use the analysis in the two previous chapters to look at
   possible public finance impacts in the short and long runs. Because there are no
   quantified economic scenarios from the Office for Budget Responsibility (OBR) or
   the Bank of England, we use some of the most credible independent economic
   forecasts to look at these possible public finance outcomes.

   Chapter 5 concludes.

   Finally, by way of introduction, it is important to stress that we are here looking
   at only one aspect of the Brexit debate. The economics and public finances
   matter, but they are by no means the only things that matter. We hope that what
   we have here will help inform that particular element of the debate for others to
   weigh up alongside all the other issues that will count in coming to a decision
   over our future membership of the EU.

                                            7

                                                         © Institute for Fiscal Studies
2. The Direct Impact of Brexit on the
Public Finances
If the UK were to leave the EU, the direct impact on the public finances (i.e.
regardless of any impact via, for example, changes in national income) would
come from the end of existing contributions to the EU budget. This would give
rise to a reduction in UK public spending, although replacing at least some of the
spending that is currently undertaken by the EU in the UK would presumably
offset some of this fall. Furthermore, some form of contribution to the EU budget
might be required if the UK wanted continued access to the EU’s single market,
particularly in services, which would further offset budgetary savings. This
chapter looks at the potential size of this direct impact on the public finances and
sets it in the context of overall UK government spending and borrowing. (The
indirect impact on the public finances of the UK leaving the EU – that is, taking
into account any change in national income – both in the short and long runs, is
considered in Chapter 4.)
2.1 How much does the UK contribute to the EU and
how does it affect the public finances?
The size and composition of the EU budget, the methods of calculating the
financial contributions of each member, and the resulting level of contributions
from each member are all described in detail in Browne, Johnson and Phillips
(2016). This section provides a summary of the key numbers relating to the UK’s
contribution. Section 2.2 describes the contributions to the EU budget currently
made by some countries that are outside the EU.
The overall EU budget accounts for about 1% of gross national income (GNI)
across the 28 member states. UK Treasury figures suggest that the UK’s gross
contribution (i.e. ignoring the UK’s rebate) in 2014 was £18.8 billion, which is
about 1% of GDP. It is by dividing this number by 52 weeks that one comes to the
widely-reported figure of over £350 million a week as the UK’s contribution to
the EU. But in this context, ignoring the rebate is clearly inappropriate. It is
equivalent to suggesting that were the UK to leave the EU and not make any
financial contribution to the EU’s budget, then remaining EU members would
continue to pay the rebate to the UK! After taking account of the rebate, the UK’s
contribution in 2014 was – again on the basis of Treasury figures – £14.4 billion,
or 0.8% of GDP. 2 This is equivalent to around £275 million a week.
Given that the UK has an above-average level of GDP per capita, it is perhaps
surprising that its contribution, net of the rebate, is lower than the EU average.
But it is also important to consider the amount of spending that is done in the UK
2
Figures from HM Treasury (2015).
8
© Institute for Fiscal StudiesThe direct impact of Brexit on the public finances
by the EU. In 2014, the UK received the lowest per-capita spend from the EU of
any member state. This explains why the UK negotiated to receive a rebate on its
contribution back in the 1980s (that remains in place to this day). After taking
this spending into account, figures from the EU suggest that the UK’s net
contribution – i.e. net in the sense of being the total amount the UK paid into the
EU budget less the amount of spending that was done by the EU in the UK –
amounted to £5.7 billion. 3 This is equivalent to 0.3% of national income, or just
over £100 million per week.
This implies that had the UK not contributed at all to the EU budget in 2014, and
had it chosen to continue to fund all those payments and services that are
currently paid for by the EU directly, then public spending (and therefore public
sector net borrowing) would have been £5.7 billion lower. Looking forwards, the
equivalent number looks likely to be bigger than this; the EU budget fluctuates
from year to year and 2014 appears to be a year when the UK’s net contribution,
when measured on this basis, was relatively low. For example, in 2013, the
amount that the UK paid into the EU less the amount of spending that was done
by the EU in the UK was £9.1 billion, or £175 million per week. On average over
the next five years, it seems likely to average around £8 billion a year. 4 This is
about 0.4% of national income, and is equivalent to about £150 million a week.
Table 2.1. The UK’s financial contribution to the EU budget, 2013 and
2014
% of £bn £m per
GDP week
2013
Gross contribution 1.0 18.1 350
Contribution net of rebate 0.8 14.5 275
Contribution net of rebate and spending by 0.5 9.1 175
the EU in the UK
2014
Gross contribution 1.0 18.8 350
Contribution net of rebate 0.8 14.4 275
Contribution net of rebate and spending by 0.3 5.7 100
the EU in the UK
Approximate likely contribution net of 0.4 8 150
rebate and spending by the EU in the UK
going forwards
Note: Full details available in Browne, Johnson and Phillips (2016). Spending per week rounded to
the nearest £25 million.
3
Source:
http://ec.europa.eu/budget/library/biblio/documents/2014/Internet%20tables%202000-2014.xls.
4
Source: Box 6.1 of Browne, Johnson and Phillips (2016).
9Brexit and the UK’s public finances
These different figures for the UK’s financial contribution to the EU budget are
summarised in Table 2.1.
This assumes that all of the spending that the EU funds that takes place in the UK
would be replaced with funding by one tier or another of government in the UK.
To the extent to which the UK chose not to fund these schemes, the direct impact
of the UK leaving the EU on the public finances would be greater. That is to say,
the direct reduction in public spending, and therefore in public sector net
borrowing, would be greater. One reason this might be the case is that the UK
might, for example, decide to spend less on supporting agriculture in the UK than
is currently the case under the EU’s Common Agricultural Policy. But the
reduction in public spending, and therefore in borrowing, could also be smaller,
for at least two reasons:
• First, there is some overseas aid spending that is funded by the EU that is
scored as being conducted on the UK’s behalf. If the UK wished to continue
funding this amount of aid spending – which it would have to do were it to
continue to comply with the stated desire of both the government and the
opposition, now set in legislation, to spend at least 0.7% of GNI on overseas
aid – then the direct improvement in the public finances would be less than
£8 billion.
• Second, it would also be lower than £8 billion if the UK did continue to make
some contribution to the EU budget – for example, in return for gaining
preferential access to some aspects of the EU’s single market (see Section
2.2).
Bearing this in mind, the possible direct impact on the public finances of the UK
leaving the EU is now considered. The analysis assumes that Brexit would lead to
an £8 billion reduction in public spending from 2018–19 onwards. As total public
spending is forecast to be £801 billion in that year, this is equivalent to a 1%
reduction in spending (to £793 billion). As shown in Figure 2.1, this would lead to
spending being forecast to be 0.4% of national income lower, at 37.6% instead of
38.0%.
A lower level of public spending would also reduce the gap between public
spending and total receipts, i.e. it would reduce public sector net borrowing. This
can be seen in Figure 2.1 and is shown more clearly in Figure 2.2. If public
spending in 2018–19 were reduced by £8 billion, this would reduce forecast
public sector net borrowing from £21.4 billion to £13.4 billion or, when
measured as a share of national income, from 1.0% of GDP to 0.6% of GDP. In
2019–20 – the first year that the Chancellor’s fiscal target to achieve an overall
budget balance could apply 5 – it would increase the forecast surplus from
£10.4 billion to £18.4 billion (or from 0.5% to 0.9% of national income).
5
The fiscal target applies to each year from 2019–20 unless growth over four quarters appears to
have dropped, or is forecast to drop, below 1%. For a discussion, see Crawford et al. (2016).
10The direct impact of Brexit on the public finances
Figure 2.1. UK public spending with and without net EU contributions
from 2018–19 onwards (% of national income)
50
45
Per cent of national income
40
35
Current receipts
Total managed expenditure (TME)
TME less net EU contributions from 2018–19
30
1996–97
1997–98
1998–99
1999–00
2000–01
2001–02
2002–03
2003–04
2004–05
2005–06
2006–07
2007–08
2008–09
2009–10
2010–11
2011–12
2012–13
2013–14
2014–15
2015–16
2016–17
2017–18
2018–19
2019–20
Source: Office for Budget Responsibility, Public Finances Databank, 16 March 2016,
http://budgetresponsibility.org.uk/data/; authors’ calculations.
Figure 2.2. UK public sector net borrowing with and without net EU
contributions from 2018–19 onwards (% of national income)
12
Public sector net borrowing (PSNB)
10
PSNB excluding net EU contributions
from 2018–19
8
Per cent of national income
6
4
2
0
-2
-4
1996–97
1997–98
1998–99
1999–00
2000–01
2001–02
2002–03
2003–04
2004–05
2005–06
2006–07
2007–08
2008–09
2009–10
2010–11
2011–12
2012–13
2013–14
2014–15
2015–16
2016–17
2017–18
2018–19
2019–20
Source: Office for Budget Responsibility, Public Finances Databank, 16 March 2016,
http://budgetresponsibility.org.uk/data/; authors’ calculations.
11Brexit and the UK’s public finances
Alternatively, of course, the UK government might decide to spend any additional
resources either on reducing the scale of cuts to public spending or on tax cuts.
The latest spending plans imply day-to-day spending by central government on
the delivery and administration of public services being cut by £12 billion (or
3.7%) between 2015–16 and 2019–20. 6 An additional £8 billion could therefore
be used to reduce the scale of these cuts by two-thirds (or from an average 3.7%
cut to an average 1.3% cut). Similarly, the announced cuts to social security
benefits and tax credits for this parliament are estimated to reduce spending,
relative to what it would otherwise have been, by £12 billion by the end of this
parliament. 7 Therefore an £8 billion reduction in spending on the EU could allow
two-thirds of these cuts to be cancelled. In terms of tax cuts, £8 billion would be
sufficient, for example, to finance a cut to both the basic and higher rates of
income tax of 1.4p. 8
As we shall see later, however, it is important to be clear that this direct effect on
the budget would easily be overwhelmed by only modest changes to national
income arising from a decision to leave the EU.
2.2 What can other countries tell us about what the
UK might contribute to the EU following Brexit?
If the UK votes to leave the EU, its existing contributions to the EU budget would
cease. However, depending on the type of access to the EU’s single market the UK
government wanted, and the deal it was able to negotiate, a contribution to the
EU budget, although likely lower, may need to be made. In this section, we briefly
discuss the deals non-EU countries have obtained, and the contributions they
make to the EU’s budget and receipts they receive.
Such contributions take two main forms. First, countries outside the EU can
become associate members of particular EU programmes (such as Horizon 2020),
contributing to them on the basis of their gross national income – the same basis
on which the bulk of EU members’ contributions are calculated. These countries
are then eligible for funding from these programmes too. Second, the richer
countries with the greatest market access to the EU – such as Norway and
Switzerland – pay for additional direct grants to poorer EU member states to
bolster development.
Unfortunately, the EU does not appear to publish figures on net budgetary
contribution figures for these non-member countries (nor do the relevant
national governments), or at least not in an easily accessible form. This lack of
transparency is far from ideal and, as a result, any figures reported below are
6
This is the cut to resource departmental expenditure limits (RDEL) as of the March 2016 Budget.
Source: Crawford, 2016.
7
See, for instance, Hood (2015).
8
https://www.gov.uk/government/statistics/direct-effects-of-illustrative-tax-changes.
12The direct impact of Brexit on the public finances
calculated using rather ad-hoc methods and should be treated as indicative only.
As a result, in many instances, we can only make qualitative statements.
Contributions of EEA members
If the UK were to leave the EU, membership of the European Economic Area
(EEA) would be the option that represented the smallest change to both trading
arrangements and, in all likelihood, budget contributions. Currently, EEA
membership comprises Iceland, Liechtenstein and Norway (in addition to EU
member states).
These three EEA member countries have, with the exception of agricultural and
fisheries products, tariff-free access to the EU’s markets, although customs
checks and documentation are required to ensure that goods satisfy ‘rules of
origin’ designed to stop exports from third countries entering the EU tariff-free
via these countries (since the EU and these countries operate their own external
tariff systems). 9 Perhaps in recognition of this preferential access to the EU’s
single market, the EEA countries’ agreement with the EU entails them
contributing to economic and social programmes in 15 of the least prosperous EU
member states in order to ‘alleviate social and economic disparities’. 10 They also
have the ability to sign up to contribute to specific EU programmes and, as a
result, gain access to funding from these programmes.
In the case of Norway, contributions will take three main forms over the period
between 2014 and 2020 or 2021: 11
• the general EEA Grants scheme, amounting to around €212 million a year, on
average; 12
• the additional Norway Grants scheme, amounting to €179 million a year, on
average;
• contributions to a number of EU programme areas, most notably in the area
of science and education, amounting to €447 million a year, on average
(rising from €306 million in 2014 to €550 million in 2020).
This means a gross contribution to the EU budget, or directly to poorer EU
member states, amounting to €837 million a year, on average, over this period
(although perhaps more like €700 million in 2014). 13 This is around £125 per
9
The three countries also have to meet the vast majority of EU regulations, especially in relation
to trade, despite having no formal say in the setting of these regulations, and accept free
migration of EU citizens (and vice versa). Chapter 3 provides further details.
10
For further information, see http://eur-lex.europa.eu/resource.html?uri=cellar:02eed2b7-da51-
11e5-8fea-
01aa75ed71a1.0011.03/DOC_1&format=HTML&lang=EN&parentUrn=CELEX:52016PC0084.
11
Figures available at http://www.eu-norway.org/eu/Financial-contribution/#.Vzx5rXotFLg.
12
Iceland and Liechtenstein together contribute around €9 million a year to this general grant.
13
Unfortunately, figures are not available for the Norway and EEA Grants schemes on an annual
basis. The figure for 2014 is therefore based on the reported contribution to the EU programme
13Brexit and the UK’s public finances
Norwegian per year over the period as a whole, based on current exchange rates
(and perhaps £105 per year in 2014). 14 These amounts compare with a gross
contribution forecast to be around £215 per person per year over the same
period for the UK (which, as a member of the EU, participates in many other
programmes, including the Common Agricultural Policy). 15
Unfortunately, official figures for net contributions to the EU budget are not
available for Norway or the other EEA countries. However, an analysis of science
funding – the main area Norway contributes to – during the period between 2007
and 2013 suggests Norway received back slightly more than half of what it
contributed to that funding area. 16 If this were replicated across all spending
areas and were to continue during the 2014 to 2020 funding period, then
Norway’s net contribution would amount to around £91 per person per year, on
average.
Exactly what the UK would contribute if it opted for EEA membership would
depend on negotiation over its contributions to poorer areas of the EU, on what
EU programmes it decided to participate in, and its success in winning funding
from those programmes. However, if it contributed and received back the same
proportion of national income as Norway, the UK’s net contribution would be
around £52 per person (£3.3 billion in aggregate) per year, compared with a UK
net contribution to the EU budget forecast to be around £121 per person
(£8 billion in aggregate) per year over the same period if we remain part of the
EU. 17 The case of Norway therefore suggests that the UK’s net contributions to
the EU could be expected to be substantially lower if it left and joined the EEA
than if it remained part of the EU, but could still be significant.
Contributions of Switzerland
Switzerland is not a member of the EEA, but it is a member of the broader
European Free Trade Area (EFTA). This provides it with tariff- and quota-free
access to the EU’s markets for manufactured goods, although, as with EEA
members, customs checks and documentation are required. Switzerland does not
have full access to markets in services; instead, it has negotiated a series of deals
areas in that year, and the average figure for between 2014 and 2021 for the Norway and EEA
Grants schemes.
14
Calculated using out-turn and projection figures for Norway’s population:
http://www.ssb.no/en/befolkning/statistikker/folkfram/aar/2014-06-17.
15
Authors’ calculations using OBR forecasts for UK contributions to the EU and ONS UK
population projections, available at http://budgetresponsibility.org.uk/efo/economic-fiscal-
outlook-march-2016/ and
https://www.ons.gov.uk/peoplepopulationandcommunity/populationandmigration/populationpro
jections/.
16
Source: Authors’ calculations; http://europa.eu/rapid/press-release_IP-14-566_en.htm;
http://www.efta.int/sites/default/files/documents/advisory-bodies/parliamentary-committee/jpc-
reports/EEA_JPC_Report_EU_Programmes.pdf.
17
Norwegian GNI per person is around 1.75 times that of the UK.
14The direct impact of Brexit on the public finances
with the EU for particular sectors such as insurance, which leaves out many
financial services. Switzerland also participates in and contributes to a number of
EU programmes, such as Horizon 2020, 18 and provides grants to those countries
that have joined the EU since 2004, which amount to approximately £900 million
in commitments over five years (with actual payments spread over ten). 19
Unfortunately, figures on the overall contributions made by Switzerland – either
gross or net – to the EU or directly to EU members are not readily available.
However, the Swiss government has reported that Switzerland was a net
beneficiary of research funding in the period 2007–13, paying in 2.3 billion and
receiving back 2.5 billion Swiss Francs. 20 The smaller payments to poorer EU
members, and greater success at winning research money, mean Switzerland’s
net contribution is almost certainly significantly lower than Norway’s.
Other countries
Many other countries have bilateral agreements with the EU giving some form of
preferential access to the EU’s markets, and some of these also participate in EU
programmes.
Turkey, for instance, has tariff- and quota-free access to the EU’s market in goods,
with the exception of raw agricultural produce. As part of the EU’s customs union,
it applies the EU’s external tariffs, meaning customs checks for most goods are
not required. However, it does not have access to the EU’s services market. It
participates in a number of EU programmes such as Horizon 2020 and the
Erasmus+ scheme, contributing on the basis of GNI. In addition to being eligible
for funding under these programmes, as a membership candidate, Turkey is
eligible for funding under the EU’s pre-accession arrangements. This funding is
set to amount to €631 million in 2016, 21 which means Turkey is a net recipient of
EU funding. The same is true for other poorer European states that are also
candidates for EU membership: Serbia, Albania, Macedonia, Kosovo, Bosnia and
Montenegro (although these countries are not also part of the EU’s customs
union). Of course, were the UK to leave the EU, it would not be a candidate for EU
membership.
Finally, the EU has a range of trade deals with other countries, which differ in
significant ways, providing different degrees of access to each others’ markets in
goods and services. 22 One example that has been cited during the EU referendum
18
Although, following the Swiss people’s decision to restrict EU migration rights, full
participation in and contribution to these programmes are on hold.
19
https://www.eda.admin.ch/erweiterungsbeitrag/en/home/the-swiss-contribution/kurzportraet-
erweiterungsbeitrag.html.
20
http://www.sbfi.admin.ch/aktuell/medien/00483/00594/index.html?lang=en&msg-id=60389.
21
http://ec.europa.eu/enlargement/instruments/overview/index_en.htm.
22
A full list is available at http://ec.europa.eu/trade/policy/countries-and-regions/agreements/.
15Brexit and the UK’s public finances debate is that with Canada, which is the most comprehensive free trade deal the EU has agreed to date. It provides tariff- and quota-free access for the vast majority of goods, including significant areas of agricultural products, although some tariffs remain (e.g. on automotive vehicles). Significant areas of services are covered by the deal, but there are exceptions including financial services. The key thing to note for this discussion is that the Canada–EU deal entails no budgetary contributions to the EU. But, of course, for many reasons – not least geography – the degree to which the EU will trade with Canada in future will likely be far less than the degree to which the UK, whether or not in the EU, would trade with the EU. The extent to which the Canada deal offers a template for the UK is therefore debatable. Lessons for the UK The above discussion highlights the array of trade arrangements the EU has with non-members and the budget contributions that are associated with these arrangements. The EEA countries, which have the greatest access to the EU’s single market, are obliged to contribute grants to poorer parts of the EU. Switzerland also provides funding to poorer EU members, although the scale of this funding is proportionately smaller, via a series of bilateral agreements with the specific countries rather than with the EU. It is therefore not clear whether Switzerland’s preferential access to the EU’s markets should be seen as contingent on this funding. Other countries with which the EU has trade deals are not obliged to contribute to the EU budget. However, like the EEA members and Switzerland, some participate in EU programmes and thus contribute to them and receive funding from them. What does this mean for the UK? First, if it wished to join the EEA and have the greatest access to the EU’s markets, then contributions to poorer EU members would almost certainly be required. These – and any contributions to EU programmes the UK wished to participate in – would be less than the current net contribution, but could still be substantial. If the UK opted for a looser relationship with the EU via a bilateral trade deal, then things are less clear. Ultimately, whether, and if so how much, the UK would have to contribute would be decided by bilateral negotiations, the outcomes of which it is difficult to predict in advance with any degree of confidence. It is worth noting, however, that no country outside the EU or EEA – even Switzerland, which does contribute some funds to poorer EU members – has full access to the EU’s internal services market, including financial services. This suggests the UK might have to accept restrictions on its access to the EU’s markets in key sectors if it did not wish to provide at least some funding to EU member states. 16
3. Brexit and the UK’s National Income
   The impact of Brexit on the UK’s public finances will depend largely on how it
   affects the state of the economy, rather than on the direct budgetary scenarios
   identified in Chapter 2.

   This chapter reviews the economic estimates of the effect of leaving the EU. It
   sets out different authors’ estimated impacts (Section 3.1), looks at the UK’s
   economic relationship with the EU (Section 3.2) and the alternative policy
   options (Section 3.3), and identifies and assesses the main economic issues
   (Section 3.4). The concluding section identifies the estimates of impacts on
   national income that feed into the next chapter, which presents the public finance
   implications.

   3.1 Overview of economic assessments of Brexit
   A wide range of academics, consultancies, think tanks and others have made
   substantive quantitative economic assessments of the UK leaving the EU over
   both the short term and the long term. Table 3.1 summarises the substantive
   modelled estimates from the last two years.

   The scenarios and coverage of the studies differ significantly. Most studies refer
   to the three potential trade scenarios for the UK – EEA (European Economic
   Area) membership, FTA (Free Trade Agreement) with the EU, and WTO (World
   Trade Organisation) membership. We set out the different policy possibilities in
   Section 3.3, but the studies make different assumptions about what these
   scenarios mean (for example, in the WTO scenario, some studies assume that the
   UK unilaterally removes restrictions on imports, while others assume the UK
   would apply tariffs according to the ceilings set by the WTO).

   Table 3.1 also sets out the main impacts assessed by each study. All of the studies
   assess the trade and budgetary impacts for the UK. Over half consider the impact
   on foreign direct investment (FDI) and some assess the impact on productivity,
   migration and regulation. Similarly, all of the studies listed here use
   macroeconomic models to assess the impacts on GDP (gross domestic product)
   and other economic variables. Note that when looking at the short-term impact
   on public finances in Chapter 4 (see Table 4.2), we consider a slightly broader
   range of quantitative estimates.

   Table 3.1 reports long-term estimates in terms of GDP as this is our main concern
   for forecasts of the public finances. Some studies also make separate estimates of
   GDP per person. These are generally similar to the overall GDP estimates. 23

   23
     In some estimates, scenarios with different patterns of migration imply marginal differences
   between GDP and GDP per head figures.

                                                  17

                                                                  © Institute for Fiscal Studies
Brexit and the UK’s public finances
Table 3.1. Assessments of 2030 economic impact of Brexit
Organisation Scenario Estimate Range Impacts modelled
(% GDP)
CEP (2016a) Dynamic –7.9 (–6.3 to –9.5) Budget, trade,
EEA/FTA productivity
Static EEA –1.3 N/A Trade only
Static WTO –2.6 N/A Trade only
HM Treasury EEA –3.8 (–3.4 to –4.3) Budget, trade, FDI,
FTA –6.2 (–4.6 to –7.8) productivity
WTO –7.5 (–5.4 to –9.5)
OECD WTO/ FTA –5.1 (–2.7 to –7.7) Budget, trade, FDI,
productivity,
migration,
regulation
NIESR EEA –1.8 (–1.5 to –2.1) Budget, trade, FDI
FTA –2.1 (–1.9 to –2.3)
WTO –3.2 (–2.7 to –3.7)
WTO+ –7.8 N/A Adds productivity
PwC/CBI FTA –1.2 N/A Budget, trade, FDI,
WTO –3.5 regulation
Oxford FTAa –2.0 (–0.1 to –3.9) Budget, trade, FDI,
Economics migration,
regulation
Open Europe FTA –0.8 to +0.6 (–2.2 to 1.6) Budget, trade,
migration,
regulation
Economists WTO +4.0 N/A Budget, tradeb
for Brexit
a
FTA with moderate policy scenario used as central estimate; range includes ‘liberal customs
union’ (–0.1) to ‘populist MFN scenario’ (–3.9).
b
Regulation impacts assessed separately.
Note: Estimates are for impact on GDP in 2030.
Source: Estimates from organisations above. Authors’ assessment of impacts modelled.
Of the eight studies considered, six see a negative economic impact of Brexit in
their central estimates. Indeed, even using the ranges around the estimates, none
of these six identifies a positive impact. Two studies, by Open Europe and
Economists for Brexit, highlight a potential positive impact, and only Economists
for Brexit have a positive figure as their central estimate.
18Brexit and the UK’s national income
In order to make an informed assessment of the public finance impacts of Brexit,
in the remainder of this chapter we consider the policy scenarios, assumptions
and approaches to the key issues of these different studies.
3.2 Economic relationship with the EU
This section gives an overview of the UK’s existing trade and investment
relationship with the EU.
Many studies identify trade shifts as the most important dimension of the
economic impact of Brexit, so we spend some time considering these estimates
and why they differ.
Overview of trade patterns and trends
Table 3.2 sets out the UK’s export and import trade patterns, highlighting that, in
2015, 44% of exports (in goods and services) went to the EU while 53% of
imports came from the EU.
Table 3.2. UK trade value and EU share, 2015
Exports Imports
£bn Share £bn Share
EU 223 44% 291 53%
US 95 19% 60 11%
Rest of the world 193 38% 197 36%
Total 511 100% 548 100%
Note: Shares may not sum due to rounding.
Source: Bank of England, 2016.
The US is our second-largest destination for exports, and Switzerland is our
third-largest, at £18.8 billion (3.7% of UK exports). China’s consumption of UK
exports has grown rapidly over the last decade and now amounts to £15.9 billion,
or 3.1% of UK exports (our fourth-largest destination).
In addition, a substantial portion of UK exports – 44% in 2015 – are in services
(see Table 3.3) and, as service imports are much smaller, this strengthens the
UK’s balance of trade, with net service trade of £89 billion accounting for some
5% of GDP. The EU accounted for nearly 40% of our services exports. The US, the
next biggest destination for service exports, accounted for 21%.
Services tend not to suffer from import tariffs in the same way as goods, partly
because of the difficulty for authorities identifying the trade. But there are
substantial non-tariff barriers to trading in services – for example, licensing
regimes – which add to the costs of exporting services. The EU’s single market
seeks to reduce these costs through harmonising regulations around service
provision, and some trade agreements can also seek to mitigate these differences.
19Brexit and the UK’s public finances
Table 3.3. UK service trade and EU share, 2015
Exports Imports
£bn Share £bn Share
EU 89 39% 68 50%
Rest of the world 137 61% 69 50%
Total 226 137
Source: Authors’ calculations; ONS balance of payments data,
https://www.ons.gov.uk/economy/nationalaccounts/uksectoraccounts/datasets/unitedkingdomec
onomicaccountsbalanceofpaymentscurrentaccount.
As well as the exports that go directly to the EU, the UK benefits from trade deals
the EU has struck. The EU currently has 33 preferential trade deals with 62 other
countries. 24 Open Europe (2016), uses ONS data for 2014 to calculate the
proportion of the UK’s trade covered by the EU and its trade deals with third
countries. It estimates that these agreements currently cover nearly 63% of
Britain’s global trade and that this would rise to 65% once agreements with
Canada and Singapore come into force. (The remainder is the UK’s trade with
non-EU countries with which the EU has not negotiated favourable terms.) If the
Transatlantic Trade and Investment Partnership (TTIP) between the EU and the
US were agreed, Open Europe estimates coverage would rise further to 78%.
A further important element of the UK’s economic relationship with other
countries is the foreign investment made by the UK overseas and made by other
countries in the UK, i.e. foreign direct investment (see Table 3.4).
Table 3.4. UK foreign direct investment (FDI) stock, as at end 2014
FDI in the UK UK FDI overseas
£bn Share £bn Share
EU 496 48% 404 40%
US 253 24% 240 24%
Rest of the world 286 28% 371 37%
Total 1,035 100% 1,015 100%
Note: Shares may not sum due to rounding.
Source: Bank of England, 2016.
UK FDI inflows are high relative to other EU countries. OECD (2016) shows that
in 2014, the UK accounted for the largest share, and over 30%, of inflows to EU15
countries. 25 Overseas investment is an important driver of economic activity and
is also linked to higher productivity through the transfer of skills and ideas
24
Different estimates exist for the level of coverage; we draw on the Open Europe (2016)
estimate for consistency here.
25
The OECD defines this group as the following 15 countries: Austria, Belgium, Denmark, Finland,
France, Germany, Greece, Ireland, Italy, Luxembourg, Netherlands, Portugal, Spain, Sweden and
the United Kingdom.
20Brexit and the UK’s national income
(OECD, 2016). If investors perceive that the UK’s economic prospects or access to
markets has diminished, this would likely reduce UK FDI. We return to this issue
below.
Overall, then, the EU is the UK’s largest trading partner, comprising around half of
all trade, and also its biggest investment partner. The EU is also the UK’s largest
service exports destination. Services account for some 44% of total UK exports
and make a substantial positive contribution to the UK’s trade balance and
therefore to national income.
EU trade policy and tariff levels
Trade with and beyond the EU contributes significantly to national income, and
the level of ‘openness’ 26 of an economy to trade has also been shown to increase
national income (OECD, 2016; CEP, 2016b).
Within the EU, the UK enjoys tariff- and customs-free access to a ‘single market’,
which uses common regulatory standards in many sectors. In addition, the EU
has struck 35 Free Trade Agreements 27,28 (FTAs), and plans to strike more, with a
range of other countries, and the UK benefits further from these arrangements.
The five main trade characteristics of EU membership are:
• tariff-free access to EU markets;
• no customs checks at borders within the EU (i.e. no ‘rules of origin’ checks);
• single market with common regulatory standards;
• access to more than 55 other markets through a range of EU FTAs;
• common external tariffs on imports to the EU from non-EU countries.
Tariffs are set by the EU according to World Trade Organisation rules (see
below). In practice, this means that some goods imported from outside the EU
(and beyond its FTA partners) face an ‘import tariff’ levied on the value of the
import. This import tariff is known as the ‘most favoured nation’ (MFN) tariff as
WTO rules require that, outside of trade agreements, all countries must face the
same tariff as the ‘most favoured’ nation. The WTO calculates the average level of
tariffs applied across all imports and also weights according to their value. For
the EU, the simple average of applied tariffs was 5.3% in 2014, and on a trade-
weighted average this was 3.6% (2013). Tariffs are substantially higher on
agricultural goods (see Table 3.5).
26
Trade openness is defined as the total value of exports and imports expressed as a proportion of
a country’s GDP.
27
See http://ec.europa.eu/trade/policy/countries-and-regions/agreements/index_en.htm.
28
Note that most trade agreements are known as ‘free trade agreements’ even when some tariffs
and other costs to trade remain.
21Brexit and the UK’s public finances
Table 3.5. MFN tariffs on imports applied by the European Union
Tariff type Total Agriculture Non-
agricultural
Simple average MFNa applied (%), 2014 5.3 12.2 4.2
Trade-weighted average (%), 2013 3.6 22.3 2.3
Imports in billion US$, 2013 1,996.5 128.7 1,867.8
a
‘Most favoured nation’ (MFN) means that the country that is the recipient of this treatment – in
this case, tariff levels – must, nominally, receive equal trade advantages to those of the ‘most
favoured nation’ by the country granting such treatment. In practice, this means that, outside of
trade deals, all countries facing import tariffs face the same level of tariffs.
Source: WTO, 2015.
These are the (average) tariff levels faced by importers to the EU unless they
agree a Free Trade Agreement, which could reduce some or all of the tariffs.
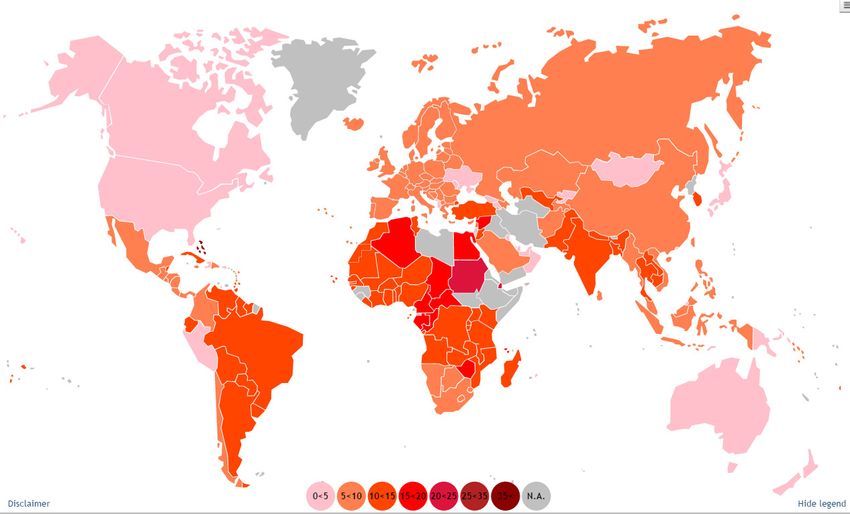
These compare with an overall average tariff of around 9% 29 applied by WTO
members (2013) to imports (see Figure 3.1).
Figure 3.1. Simple average applied (MFN) tariff (all products)
Source: World Trade Organisation, ‘International Trade and Market Access Data’, latest available
data (2013 and 2014),
https://www.wto.org/english/res_e/statis_e/statis_bis_e.htm?solution=WTO&path=/Dashboards/
MAPS&file=Map.wcdf&bookmarkState={%22impl%22:%22client%22,%22params%22:{%22lang
Param%22:%22en%22}}.
29
https://www.wto.org/english/thewto_e/20y_e/wto_20_brochure_e.pdf.
22You can also read