Essays on the Macroeconomics of Housing Markets - Fabian Greimel Inauguraldissertation - Universität Mannheim
←
→
Page content transcription
If your browser does not render page correctly, please read the page content below
Essays on the Macroeconomics
     of Housing Markets

                Inauguraldissertation
       zur Erlangung des akademischen Grades
     eines Doktors der Wirtschaftswissenschaften
              der Universität Mannheim

                    vorgelegt von

                Fabian Greimel
        im Frühjahrs-/Sommersemester 2020
Abteilungssprecher Prof. Volker Nocke, PhD Referent Prof. Michèle Tertilt, PhD Koreferent Prof. Klaus Adam, PhD Tag der Verteidigung 19. August 2020
Acknowledgements

I am indebted to my advisors Klaus Adam and Michèle Tertilt for their
guidance and support. They have provided excellent forums for the contin-
uous exchange of ideas among them and their students. This thesis greatly
benefitted from their feedback and experience.
    This thesis is the output of a fruitful collaboration with my co-authors
Moritz Drechsel-Grau and Frederick Zadow. Moritz and I started to develop
the idea for the first chapter of this thesis during our first year in Mannheim.
Our countless discussions over the years have made me a better economist.
    Chapter 1 has benefitted from formal conference discussions by Alina
Bartscher, Leo Kaas and Christian Kellner as well as feedback by Andrey
Alexandrov, Antoine Camous, Dan Greenwald, Andreas Gulyas, Hans Peter
Grüner, Anne Hannusch, Lukas Henkel, Matthias Meier, Ben Moll, Kurt
Mitman, Galo Nuño, Andreas Peichl, Krzysztof Pytka, Timo Reinelt, Alireza
Tahbaz-Salehi and Tony Smith, all at very different stages of this project.
    Chapter 3 has benefitted from feedback by Andrey Alexandrov, Antoine
Camous, Moritz Drechsel-Grau and Andreas Gulyas.
    I thank the University of Mannheim’s Graduate School of Economic and
Social Sciences, the foundation Geld & Währung and the German Research
Foundation (DFG) through CRC TR 224 (Project C02) and SFB 884 for
financial support and the state of Baden-Württemberg for computational
resources through bwHPC.
    Thank you, Moritz Drechsel-Grau, Matthias Stelter, Nils Wehrhöfer and
Inken Töwe for being amazing office-mates in three different buildings; An-
drey Alexandrov and Claudio Kretz for being amazing flat-mates in New
Haven; Tomasz Olma for being the most reliable lunch companion; and Felix
Holub, Enrico Camarda, Alina Bartscher, Claudia Noack, Dimo Barth, Timo
Reinelt, Lukas Neuhauser and Linnéa Rohde for making the PhD studies such
a pleasant experience.
    And lastly, but most importantly, I want to thank my little family. My
wife Judith, for going on this adventure with me, and her continuous support
over the past five years. And my little son Jakob, born in the third year of

                                       3
4 the PhD, for making me learn to use time efficiently and reminding me that a PhD is not such an important thing after all.
Contents
Preface 7
1 Falling Behind 9
1.1 Introduction . . . . . . . . . . . . . . . . . . . . . . . . . . . . 9
1.2 Model . . . . . . . . . . . . . . . . . . . . . . . . . . . . . . . 14
1.3 Analytical Results . . . . . . . . . . . . . . . . . . . . . . . . 20
1.4 Parameterization . . . . . . . . . . . . . . . . . . . . . . . . . 26
1.5 Quantitative Results . . . . . . . . . . . . . . . . . . . . . . . 31
1.6 Conclusion . . . . . . . . . . . . . . . . . . . . . . . . . . . . . 37
Appendices 41
1.A Data sources . . . . . . . . . . . . . . . . . . . . . . . . . . . 41
1.B Proofs . . . . . . . . . . . . . . . . . . . . . . . . . . . . . . . 42
1.C Numerical solution for a stationary equilibrium . . . . . . . . 45
1.D Additional tables . . . . . . . . . . . . . . . . . . . . . . . . . 49
2 Top Incomes and Mortgage Debt 51
2.1 Introduction . . . . . . . . . . . . . . . . . . . . . . . . . . . . 51
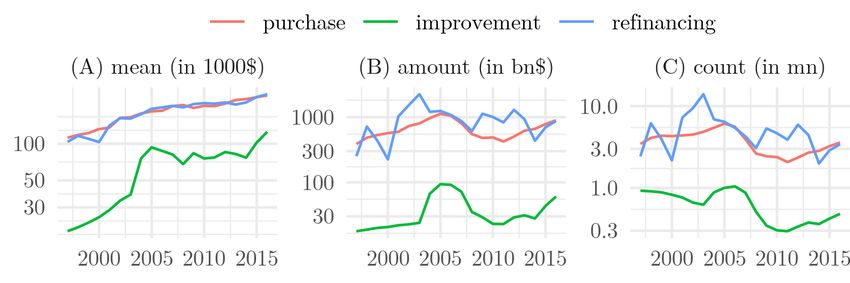
2.2 Data . . . . . . . . . . . . . . . . . . . . . . . . . . . . . . . . 54
2.3 Empirical Analysis . . . . . . . . . . . . . . . . . . . . . . . . 57
2.4 Conclusion . . . . . . . . . . . . . . . . . . . . . . . . . . . . . 66
3 Understanding Housing Wealth Effects 69
3.1 Introduction . . . . . . . . . . . . . . . . . . . . . . . . . . . . 69
3.2 A Simple Lifecycle Model with Housing . . . . . . . . . . . . . 73
3.3 Housing wealth effects with closed forms . . . . . . . . . . . . 77
3.4 Testing the predictions on housing wealth effects . . . . . . . . 81
3.5 Conclusion . . . . . . . . . . . . . . . . . . . . . . . . . . . . . 83
Appendices 85
3.A Proofs . . . . . . . . . . . . . . . . . . . . . . . . . . . . . . . 85
56 CONTENTS
Preface

This dissertation consists of three chapters. Each chapter is self-contained.

Chapter 1 is joint work with Moritz Drechsel-Grau.1 We evaluate the hy-
pothesis that rising inequality was a causal source of the US household debt
boom since 1980. The mechanism builds on the observation that households
care about their social status. To keep up with the ever richer Joneses, the
middle class substitutes status-enhancing houses for status-neutral consump-
tion. These houses are mortgage-financed, creating a debt boom across the
income distribution. Using a stylized model we show analytically that aggre-
gate debt increases as top incomes rise. In a quantitative general equilibrium
model we show that Keeping up with the Joneses and rising income inequality
generate 60% of the observed boom in mortgage debt and 50% of the house
price boom. We compare this channel to two competing mechanisms. The
Global Saving Glut hypothesis gives rise to a similar debt boom, but does
not generate a house prices boom. Loosening collateral constraints does not
generate booms in either debt or house prices.

Chapter 2 is joint work with Moritz Drechsel-Grau as well. This chapter
shows that the well-documented parallel surge in household debt and top
income inequality in the United States has an important geographical com-
ponent. First, we establish that rising incomes of the top 10% are tightly
linked to rising debt of the non-rich after controlling for non-rich income as
well as fixed state and year characteristics. Second, we show that this re-
lationship is entirely driven by mortgage debt. While state-level changes in
non-mortgage debt are not related to state-level top incomes, our estimates
suggest that a 10% increase in a state’s top incomes induces a persistent in-
crease in mortgage debt of the state’s non-rich households by up to 5% over
the following years. The tight relationship between state-level top incomes
and non-rich mortgage debt has important implications for our understand-
ing of the drivers of the US household debt boom. In particular, our findings
  1
      University of Mannheim.

                                      7
8 CONTENTS
are consistent with the theory that top income inequality drives non-rich
debt through growing demand for debt as non-rich households attempt to
keep up with the housing of the rich.
Chapter 3 is joint work with Frederick Zadow.2 Housing wealth effects—
the reaction of consumption to changes in house prices—were at the heart
of the Great Recession. Empirical and quantitative macroeconomic stud-
ies have found that housing wealth effects are stronger for more indebted
households. One important policy implication is that lowering debt limits
for borrowers will dampen the consumption slump in a house price bust.
Such conclusions might be premature. We build a simple life-cycle model
with housing with closed form solutions for housing wealth effects. We show
that the strength of housing wealth effects crucially depends on the under-
lying household characteristics which also determine the debt levels. In this
framework imposing one-size-fits-all debt limits does not necessarily mitigate
housing wealth effects. To be effective, policies have to be tailored to borrow-
ers’ characteristics. Aggregate housing wealth effects can be reduced in three
ways: (i) if old homeowners reduce their housing wealth; (ii) if the home own-
ership rate decreases; (iii) if agents have smaller houses. We provide a simple
empirical test of our model predictions. When explaining housing wealth ef-
fects, we find that the level of mortgages turns statistically insignificant once
relevant household characteristics (age and a proxy for housing preferences)
are added.
2
University of Mannheim.Chapter 1
Falling Behind:
Has Rising Inequality Fueled
the American Debt Boom?
Joint with Moritz Drechsel-Grau.
1.1 Introduction
Between 1980 and 2007, US household debt doubled relative to GDP. Mort-
gage debt was by far the most important driver of this household debt boom
(see Figure 1.1.1a). In lockstep with mortgages, top income inequality has
risen since 1980 and reached its peak in 2007 (see Figure 1.1.1b). While real
incomes have stagnated for the bottom half of the population, the incomes of
the top 10% have more than doubled over this time period (see Figure 1.1.2a).
In the public debate, it was argued that rising top income inequality fueled
the boom in household debt (e.g. Rajan, 2010; Stiglitz, 2009; Frank, 2013a),
which in turn played an important role in the Global Financial Crisis of 2007
and the ensuing Great Recession.1
In this paper, we formally assess the hypothesis that rising top income
inequality was a causal driver of the household debt boom. The underlying
mechanism builds on the idea that households care about their social status.
When top incomes rise and the rich upgrade their houses, the non-rich lose
some of their social status. The non-rich substitute status-enhancing housing
for status-neutral consumption to keep up with the richer Joneses. These
1
See the survey by van Treeck (2014) on the hypothesis that inequality caused the
financial crisis.
910 CHAPTER 1. FALLING BEHIND
houses are mortgage-financed, causing a debt boom across the whole income
distribution.
The idea that people care about how their belongings compare to those
of their neighbors is certainly not new (among others Veblen, 1899; Due-
senberry, 1949). Recently, there has been a growing empirical literature
showing that social comparisons shape people’s decision-making (e.g. Kuhn,
Kooreman, Soetevent, and Kapteyn, 2011; Luttmer, 2005; Bursztyn, Ederer,
Ferman, and Yuchtman, 2014; De Giorgi, Frederiksen, and Pistaferri, 2019).
We quantify the contribution of this mechanism to the observed mortgage
and house price booms (Figure 1.1.3) between 1980 and 2007 and compare
it to two alternative mechanisms in the literature. First, the Global Saving
Glut hypothesis (e.g. Bernanke, 2005; Justiniano, Primiceri, and Tambalotti,
2014) according to which foreign capital inflow has driven down interest
rates and hence enabled households to take out more debt. Second, financial
liberalization (e.g. Favilukis, Ludvigson, and van Nieuwerburgh, 2017), which
may increase borrowing due to a loosening of collateral constraints.2
To that end, we build a heterogeneous agent general equilibrium model
with housing and non-durable consumption goods, elastic housing supply, a
collateral constraint, a state-of-the-art earnings process (Guvenen, Karahan,
Ozkan, and Song, 2019) and a social comparison motive that we discipline
using recent micro evidence on housing comparisons in the US (Bellet, 2019).
We compare two steady states that differ only in the exogenous degree of in-
come inequality. Based on evidence by Kopczuk, Saez, and Song (2010) and
Guvenen, Kaplan, Song, and Weidner (2018) we scale the permanent com-
ponent of income inequality to match the increase in cross-sectional income
dispersion between 1980 and 2007.
We find that this rise in income inequality generates quantitatively signif-
icant mortgage and house price booms in the presence of Keeping up with the
Joneses. Our model generates 60% of the observed increase in the mortgage-
to-income ratio and 50% of the observed increase in house prices between
1980 and 2007. Even in the absence of Keeping up with the Joneses rising
inequality drives houses prices through growing demand for housing at the
top of the income distribution. Complementarities between housing and non-
durable consumption increase the housing and mortgage demand of non-rich
households. These general equilibrium effects are roughly doubled by social
comparisons. Social comparisons directly raise the housing demand (and
thus, demand for mortgages) for non-rich as a response to choices of the rich
2
The expectations channel (Adam, Kuang, and Marcet, 2012; Kaplan, Mitman, and
Violante, 2020) is another important channel, but it cannot be easily integrated into our
model.1.1. INTRODUCTION 11
total debt mortgages other
100% mortgages top 10% income share
70%
debt/GDP
75%
income share
60% 44%
debt/GDP
50% 50%
40%
40%
25% 36%
30%
1962 1971 1980 1989 1998 2007 1962 1971 1980 1989 1998 2007
(a) The American household debt (b) Inequality and mortgages have grown
boom was mostly driven by mort- in lockstep since 1980.
gages.
Figure 1.1.1: The American household debt boom and rising income in-
equality. Sources: US Flow of Funds and Alvaredo et al. (2016). Details see
Appendix 1.A.
through the status externality.
In comparison, the Saving Glut generates a similarly strong debt boom
through lower interest rates. However, it does not generate a strong house
price increase. Both mechanisms together can explain 75% of the increase
in the mortgage-to-income ratio and 60% of the house prices boom. Decom-
posing this total effect, we can attribute between one third and two thirds
of the explained increase in debt and about 90% of the explained increase in
house prices to rising inequality and social comparisons. Financial innova-
tion, i.e., relaxed collateral constraints, raises neither debt nor house prices
significantly.
Extensive robustness checks show that our quantitative findings are ro-
bust to perturbations in the internally and externally calibrated parameters.
The generated effects stay quantitatively significant for deviations from the
calibrated strength of the comparison motive.
In addition to the quantitative results, we show in closed form how top
incomes can affect aggregate debt in a stylized version of the model without
idiosyncratic earnings risk. In this infinite horizon network model (extend-
ing the one-period models in Ballester, Calvó-Armengol, and Zenou, 2006;
Ghiglino and Goyal, 2010), we prove that an individual’s debt is increasing
in top incomes if the household cares about the rich (directly or indirectly).
Moreover, we prove that if comparisons are upward looking (i.e., everybody
cares about the rich directly or indirectly), aggregate debt is increasing in
top incomes.12 CHAPTER 1. FALLING BEHIND
bottom 50% P50P90 top 10% quintile 1 2 3 4 5
mortgage to income
300%
200%
250%
150% 200%
150%
100%
100%
1962 1971 1980 1989 1998 2007 1983 1989 1995 2001 2007 2013
Real average pre-tax income growth from Growth of mean mortgage debt as a frac-
1962 to 2014 in the US. Data are taken tion of mean income by income quintiles.
from Piketty, Saez, and Zucman (2018a). Use OECD-modified equivalence scale for
Growth rates are relative to the base year income quintiles. Data from the Surveys of
1980. Consumer Finances.
(a) Since 1980 real incomes have stag- (b) Mortgages rose across the whole in-
nated for the bottom 50 %. come distribution.
Figure 1.1.2: Despite stagnating incomes, mortgage debt increased for the
bottom 50 %.
housing expenditures other
house prices nominal real
relative change
400%
40%
300%
20%
200%
100% 0%
1982 1990 1998 2006
1970 1980 1990 2000 2010
Figure 1.1.4: Relative change of
Figure 1.1.3: Nominal: Case-Shiller
housing expenditures and other ex-
Home Price Index for the USA. Real:
penditures over time. Data from
Deflated by the Consumer Price In-
Bertrand and Morse (2016, aggre-
dex. Source: http://www.econ.
gated from the Survey of Consumer
yale.edu/~shiller/data.htm
Expenditures) for the USA.1.1. INTRODUCTION 13
Contributions to the literature
Our findings contribute to the literature on distributional macroeconomics
(e.g. Kaplan and Violante, 2014; Ahn, Kaplan, Moll, Winberry, and Wolf,
2017; Kaplan, Moll, and Violante, 2018), providing another reason why
“inequality matters for macro”. Rising income inequality has an effect on
macroeconomic outcomes like house prices and aggregate mortgage debt as
agents are linked not only through prices but also directly through social
externalities of their consumption decisions.
Our main contributions concern the growing literature on the macroeco-
nomics of the mortgage and house price booms. This literature builds on
a variety of mechanisms: looser collateral constraints (e.g. Favilukis et al.,
2017), lending limits (Justiniano, Primiceri, and Tambalotti, 2019), dynam-
ics in foreign capital flows (Justiniano et al., 2014) and changes in house
price expectations (Adam et al., 2012; Kaplan et al., 2020). Besides intro-
ducing a novel mechanism into this literature, we provide new insights and
confirm findings on two other mechanisms. First, consistent with Kiyotaki,
Michaelides, and Nikolov (2011) and others, we find that relaxation of collat-
eral constraints does not generate sizable effects on debt and house prices.3
Second, we confirm that foreign capital inflows can have sizable effects on
household debt. In our model, the Saving Glut generates effects similar to
those in Justiniano et al. (2014).
Kumhof, Rancière, and Winant (2015) formalize an alternative causal
mechanism that links inequality and the debt boom in a model without
housing. In their model, the debt boom is driven by the rich who derive utility
from financial wealth, driving down interest rates. We provide an alternative
causal mechanism that is consistent with micro-evidence and the fact that
almost all of the debt boom was driven by mortgages (see Figure 1.1.1a).
Livshits, MacGee, and Tertilt (2010) show that if cross-sectional inequality
is driven by greater uncertainty (as opposed to variation in the permanent
component) aggregate unsecured debt is decreasing. This quantitative result
is driven by the precautionary savings motive. We complement their finding
by showing that aggregate debt is increasing with higher permanent income
inequality in an economy with durable goods.
In addition, a growing literature analyzes the consumption response to
house price changes (Guren, McKay, Nakamura, and Steinsson, 2020; Gar-
riga and Hedlund, 2020; Berger, Guerrieri, Lorenzoni, and Vavra, 2018). It
finds that consumption reacts more when houses are bigger. Our model
implies that house values become an ever bigger share of lifetime income
3
This is in contrast to Favilukis et al. (2017) who generate sizable effects in their model
with a large fraction of agents close to the collateral constraint.14 CHAPTER 1. FALLING BEHIND
when top incomes rise. Thus, rising top income inequality is amplifying the
consumption response in financial crises.
A large empirical literature has established that social comparisons mat-
ter for well-being (e.g. Luttmer, 2005; Card, Mas, Moretti, and Saez, 2012;
Perez-Truglia, 2019) and economic choices (Charles, Hurst, and Roussanov,
2009; Kuhn et al., 2011; Bursztyn et al., 2014; Bertrand and Morse, 2016;
Bursztyn, Ferman, Fiorin, Kanz, and Rao, 2017; Bellet, 2019; De Giorgi et al.,
2019). While the macroeconomic effects of keeping up with the Joneses have
already been studied in the context of representative agent models (e.g. Abel,
1990; Campbell and Cochrane, 1999; Ljungqvist and Uhlig, 2000), we are the
first to introduce social comparisons into a quantitative heterogeneous agents
model.
We build on the macroeconomic literature on keeping up with the Joneses
and bring it closer to the empirical evidence. First, we distinguish between
conspicuous and non-conspicuous goods. In our model households compare
themselves only in their houses, arguable the most important conspicuous
good (e.g. Solnick and Hemenway, 2005; Bertrand and Morse, 2016). And
second, agents compare themselves to the rich (e.g. Card et al., 2012; Bellet,
2019). Households only lose satisfaction with their own house, when a big
house is built.
Our analytical results extend those by Ghiglino and Goyal (2010) and
Ballester et al. (2006) who show that agents’ choices depend on the strengths
of social links in a one-period model. We extend their network models to infi-
nite horizon and add a durable good (housing) to show that debt is increasing
in the centrality of an agent. The centrality is reinterpreted as the weighted
sum of incomes of the comparison group.
Structure of the paper The rest of the paper is structured as follows:
In Section 1.2 we describe the model. In Section 1.3 we derive analytically
how top incomes drive debt in a stylized version of the model. In Section 1.4
we describe the parameterization of the full model, followed by quantitative
results in Section 1.5.
1.2 Model
We add social comparisons into an otherwise standard macroeconomic model
of housing. Our model is a dynamic, incomplete markets general equilibrium
model similar to the “canonical macroeconomic model with housing” in Pi-
azzesi and Schneider (2016). We formulate our model in continuous time to
take advantage of the fast solution methods of Achdou, Han, Lasry, Lions,1.2. MODEL 15
and Moll (2017, in particular Section 4.3). We build our model with two aims
in mind. First, we want to illustrate how rising top-incomes and social com-
parisons can lead to rising debt levels across the whole income distribution.
And second, we want to quantify the effect of this channel on the increase in
aggregate mortgage debt and house prices from 1980 to 2007.
1.2.1 Setup
Time is continuous and runs forever. There is a continuum of households that
differ in their realizations of the earnings process. Households are indexed by
their current portfolio holdings (at , ht ), where at denotes financial wealth and
ht denotes the housing stock, and their pre-tax earnings yt . They supply labor
inelastically to the non-durable consumption good and housing construction
sectors. The financial intermediary collects households’ savings and extends
mortgages subject to a collateral constraint. The state of the economy is the
joint distribution µt (a, h, y). There is no aggregate uncertainty.
1.2.2 Households
Households die at an exogenous mortality rate m > 0. The wealth of the
deceased is redistributed to surviving individuals in proportion to their asset
holdings (perfect annuity markets). Dead households are replaced by new-
born households with zero initial wealth and earnings drawn from its ergodic
distribution.4 Households derive utility from a non-durable consumption
good c and housing status s. They supply labor inelastically and receive
earnings y. After-tax disposible earnings are given by
ỹt = yt − T (yt ),
where T is the tax function. Households choose streams of consumption ct >
0, housing ht > 0 and assets at ∈ R to maximize their expected discounted
lifetime utility
1−γ
ε
Z ∞ (1 − ξ)cεt + ξs(ht , h̄t )ε
E0 e−(ρ+m)t ,
0 1−γ
where ρ ≥ 0 is the discount rate and the expectation is taken over realizations
of idiosyncratic earnings shocks. 1/γ > 0 is the inter-temporal elasticity of
substitution, 1/(1 − ε) > 0 is the intra-temporal elasticity of substitution
4
This follows Kaplan et al. (2018).16 CHAPTER 1. FALLING BEHIND
between consumption and housing status and ξ ∈ (0, 1) is the relative utility-
weight for housing status.
A household’s utility from housing is a function of the housing status
s(h, h̄). Housing status increases in the household’s housing stock h and
decreases in reference housing h̄ which is a function of the equilibrium dis-
tribution of housing as introduced in the next section.
Housing is both a consumption good and an asset. It is modeled as a
homogenous, divisible good. As such, h represents a one-dimensional mea-
sure of housing quality (including size, location and amenities). An agent’s
housing stock depreciates at rate δ and can be adjusted frictionlessly.5 Home
improvements and maintenance expenditures xt have the same price as hous-
ing (p) and go into the value of the housing stock one for one.
Households can save (a > 0) and borrow (a < 0) at the equilibrium inter-
est rate r. Borrowers must post their house as collateral to satisfy an exoge-
nous collateral constraint. The collateral constraint pins down the maximum
possible loan-to-value ratio ω.
Households’ assets evolve according to
ȧt = ỹt + rt at − ct − pt xt ,
ḣt = −δht + xt ,
subject to the constraints
at ≥ −ωpt ht , (1.1)
ht > 0.
1.2.3 Social comparisons
We build on the macroeconomic literature (e.g. Abel, 1990; Gali, 1994; Camp-
bell and Cochrane, 1999; Ljungqvist and Uhlig, 2000) on keeping up with the
Joneses and bring it closer to the empirical evidence. These papers feature
representative agent models with one good and one asset. Agents compare
themselves in the single consumption good, and their reference measure is
the average consumption in the economy.6
We depart from this literature in two ways. First, we assume that house-
holds compare themselves only in their houses. This captures that people
compare themselves only in conspicuous goods and that housing is one of the
5
Frictionless adjustment is justified, because we will be comparing long-run changes
(over a period of 27 years).
6
In equilibrium the reference measure has to be equal to the optimal choice of the
representative agent.1.2. MODEL 17
most important conspicuous goods—both in terms of visibility and expendi-
ture share (e.g. Solnick and Hemenway, 2005; Bertrand and Morse, 2016).
Second, we allow the reference measure to be a function of the distribution
of houses (and not necessarily its mean): h̄i = h̄i (µh ). This reflects that the
comparison motive is asymmetric, being strongest (and best documented)
with respect to the rich (e.g. Clark and Senik, 2010; Ferrer-i-Carbonell, 2005;
Card et al., 2012, on self-reported well-being). People buy bigger cars when
their neighbors win in the lottery (Kuhn et al., 2011); non-rich move their
expenditures to visible goods (such as housing) when top incomes rise in their
state (Bertrand and Morse, 2016); and construction of very big houses leads
to substantially lower levels of self-reported housing satisfaction for other
residents in the same area—while the construction of small houses does not
(Bellet, 2019).
For our analytical results we assume that h̄ is a weighted mean of the
housing distribution and use s(h, h̄) = h − φh̄ for tractability. For the quan-
titative results, we set h̄ to the 90th percentile of the housing distribution
and use s(h, h̄) = h̄hφ based on empirical evidence (see Section 1.4).
1.2.4 Pre-tax earnings process
In our main experiment, we want to adjust life-time (permanent) income in-
equality independently of income risk to capture the way income inequality
has changed over time. We follow Guvenen et al. (2019), who estimate a pre-
tax earnings process on administrative earnings data. The process consists of
(i) individual fixed effects (αi ), a persistent jump-drift process (zit ), a tran-
sitory jump-drift process (εit ), and heterogeneous non-employment shocks
(νit ).7 We translate their estimated process to continuous time. Heterogene-
ity in αi represents fixed ex-ante differences in earnings ability which is an
important source of life-time inequality. The innovations of both the transi-
tory and persistent process are drawn from mixture distributions to match
higher order moments of income risk and impulse response functions. Finally,
Guvenen et al. (2019) show that a non-employment shock with z-dependent
shock probabilities greatly improves the model fit.8
7
We use version (7), where we take out the deterministic life-cycle profile. The only
component that this version does not have are differences in deterministic income growth
rates.
8
The only component that is missing compared to the Benchmark process is fixed
heterogeneous income profiles, i.e. ex-ante permanent heterogeneity in lifecycle income
growth rates.18 CHAPTER 1. FALLING BEHIND
If employed, individual pre-tax earnings are given by
yitpot = exp(α̃i + zit + εit ).
We will refer to y pot as potential earnings. The actual pre-tax earnings (taking
into account unemployment) are
yit = (1 − νit )yitpot ,
where
α̃i ∼ N (µα , σα ),
z z
it = −θ zit + J it ,
εit = −θε zit + J εit .
Jitz is a jump-process that arrives at rate λz . The size of the jump, ηitz is
drawn from a mixture of two normal distributions,
with prob. pz
(
z N µz (1 − pz ), σ1z
ηit =
with prob. 1 − pz .
N − pz µz , σ2z
Similarly, the jump process for the transitory process arrives at rate λε and
the jump size, ηitz is drawn from a mixture of two normal distributions,
with prob. pε
(
ε N − εit + µε (1 − pε ), σ1ε
ηit =
with prob. 1 − pε .
N − εit − pε µε , σ2ε
The key difference between the persistent and the transitory process is that
the jumps in the former are added to the current state whearas the jumps in
the latter process reset the process such that the post-jump state is centered
around zero.
The nonemployment shock arrives at rate λν0 (zit ) and has average duration
1/λν1 . Specifically, the arrival probability as a function of the current state
of the persistent process is modeled as
ν exp a + bzit
λ0 (zit ) = .
1 + exp a + bzit
1.2.5 Production
There are two competitive production sectors producing the non-durable
consumption good c and new housing investment Ih , respectively. Following
Kaplan et al. (2020), there is no productive capital in this economy.1.2. MODEL 19
Non-Durable Consumption Sector The final consumption good is pro-
duced using a linear production function
Yc = Nc
where Nc are units of labor working in the consumption good sector. As total
labor supply is normalized to one, Nc is also the share of total labor working
in this sector. The equilibrium wage per unit of labor is pinned down at
w = 1.9
Construction Sector We model the housing sector following Kaplan et al.
(2020) and Favilukis et al. (2017). Developers produce housing investment
Ih from labor Nh = 1 − Nc and buildable land L̄, Ih = (ΘNh )α (L̄)1−α with
α ∈ (0, 1). Each period, the government issues new permits equivalent to L̄
units of land, and these are sold at a competitive market price to developers.
A developer solves
max pt Ih − wNh s.t. Ih = Nhα L̄1−α
Nh
In equilibrium, this yields the following expression for optimal housing in-
vestment
α
Ih = (αp) 1−α L̄
which implies a price elasticity of aggregate housing supply of α
1−α
.
1.2.6 Financial markets
The financial intermediary collects savings from households and issues mort-
gages to households. Lending is limited by the households’ exogenous collat-
eral constraint (1.1).
In addition, the intermediary has an exogenous net asset position with
the rest of the world aSt . The equilibrium interest ensures that bank profits
are zero and the asset market clears,
Z
at (a, h, y)µt = aSt . (1.2)
9
Neither labor supply nor the wage appear in the earnings process, because there is no
aggregate risk, households inelastically supply one unit of labor, and the wage is equal to
1.20 CHAPTER 1. FALLING BEHIND
1.2.7 Stationary Equilibrium
A stationary equilibrium is a joint distribution µ(a, h, y), policy functions
c(a, h, y, h̄), x(a, h, y, h̄), h(a, h, y, h̄), a(a, h, y, h̄), prices (p, r) and a reference
measure h̄ satisfying the following conditions
• Policy functions are consistent with agents’ optimal choices (ct , ht , at )t>0
given incomes (yt )t>0 , prices p, r and the reference measure h̄.
• Housing investment is such that the construction sector maximizes
profits.
• µ(a, h, y) is stationary. That is, if the economy starts at µ, it will stay
there.
• Asset market clears (1.2) and housing investment equals housing pro-
duction x(a, h, y)dµ = Ih .
R
• The reference measure is consistent with choices: h̄ = h̄(µ).
1.3 Analytical Results
In this section we use a stylized version of the model described in section 1.2
to illustrate how rising top incomes can lead to rising mortgage levels across
the whole income distribution via social comparisons. In this section we show
analytically the following results.
In Proposition 1 we provide formulas for optimal housing and consump-
tion, as functions of their permanent incomes, and the permanent incomes
of the direct and indirect reference groups. In Proposition 2 we show that
optimal debt is increasing in the incomes of the direct and indirect reference
groups. In Proposition 3 we show that the impact of rising incomes ỹi on
aggregate debt is increasing in type i’s popularity. In Corollary 1 we show
that total debt-to-income is increasing in top incomes if at least one person
compares themselves to the rich. In Corollary 2 we show that under Cobb-
Douglas aggregation (ε = 0), these results hold even under housing market
clearing because they are independent of house prices p. In Corollary 3 we
show that these results crucially depend on the fact the status good h is
durable.
The assumptions needed to obtain tractability are that there is no id-
iosyncratic income risk; that the social status function is linear; and that the
interest rate equals the discount rate (all of these assumptions are relaxed in
the following sections).1.3. ANALYTICAL RESULTS 21
Assumption 1. r = ρ.
Further, we assume that there is a finite number of types of households i ∈
{1, . . . , N }. Agents vary by their initial endowments a0 and flow disposable
income ỹ.
Assumption 2. Flow income ỹi is deterministic and constant over time, but
varies across types i.
Without loss of generality, we assume that types are ordered by their
permanent income Yi = rai0 + ỹi ,
Y1 ≤ Y 2 ≤ . . . ≤ Y N .
We use bold variables to denote the vector variables for each type using the
above ordering, e.g. h = (h1 , . . . , hN )T .
Assumption 3 (Tractable social comparisons). P The status function s(h, h̄) =
h − φh̄ is linear and the reference measure h̄i = j6=i gij hj is a weighted sum
of other agent’s housing stock (we assume gij ≥ 0).
Note, that we can write the vector of reference measures as h̄ = (h̄1 , . . . , h̄N )T =
G · h := (gij )(hi ). The matrix G can be interpreted as the adjacency matrix
of the network of types capturing the comparison links between agents of
each type. gij measures how strongly agent i cares about agent j.
We further require the comparisons to satisfy the following regularity
condition.
Assumption 4. The Leontief inverse (I − φG)−1 exists and is equal to
i=0 φ G for φ from Assumption 3.
P∞ i i
This assumption is not very strong. This assumption is satisfied whenever
the power of the matrix converges, Gi → G∞ . For example, if G represents
a Markov chain with a stationary distribution or if G is nilpotent.
1.3.1 Characterizaton of the partial equilibrium
We solve for a simplified version of the equilibrium in Section 3.2.1. Agents
solve their optimization problem given prices and the reference measure; the
reference measure is consistent; but for now, we don’t require market clearing.
We use a lifetime budget constraint instead of the implicit transversality
condition.
Households optimal decisions are given in the following proposition.22 CHAPTER 1. FALLING BEHIND
Proposition 1. Under assumptions 1, 2, 3 and 4 the optimal choices h =
(h1 , . . . , hN )T and a = (a1 , . . . , aN )T are given by
X ∞
h= (κ1 φG)i κ2 Y.
i=0
∞
X
−ra = ỹ − κ3 Y + (1 − κ3 ) (κ1 φG)i Y (1.3)
i=1
where κ1 = p(r+δ) 1
∈ (0, 1), κ2 = κ1
κ0
, κ3 = 1
pr
1+ δp+κ
∈ (0, 1) and κ0 =
κ0
+1 0
1
1−ε
(r + δ) 1−ξ
ξ
p .
Proof. See appendix 1.B.2.
Households’ choices depend on a weighted average of the permanent
incomes of their (direct and indirect) reference groups. The weights are
positive, whenever there is a direct or indirect social link between those
agents. This is captured by the income-weighted Bonacich centrality, B =
i=0 (C1 φG) Y. If the weight Bij is positive, household j’s lifetime income
P∞ i
affects household i’s choices. This is the case whenever j is in i’s reference
group (there is a direct link gij > 0), or if j is in the reference group of some
agent k who is in the reference group of agent i (there is an indirect
Q −1 link of
length two, gik gkj > 0) or if there is any other indirect link ( N n=1 g`n ,`n+1
where `1 = i and `N −1 = j).
These results are reminiscent of those in Ballester et al. (2006). They
showed that the unique Nash equilibrium in a large class of network games
is proportional to the (standard) Bonacich centrality.
1.3.2 Comparative statics
First, we show that optimal debt and optimal housing are increasing in in-
comes of the direct and indirect comparison groups.
Proposition 2. For each type j in i’s reference group (that is, gij > 0) and
for each k that is in the reference group of the reference group (etc.) of i
(that is, there is j1 , j2 , . . . , jn such that gij1 gj1 j2 · · · gjn−1 jn gjn k > 0), then hi is
increasing and ai is decreasing in Yj (or Yk ).
Proof. G is non-negative, so i ci Gi is non-negative for all c ≥ 0. From
P
the definition of the Leontief inverse, being the discounted sum of direct and
indirect links it follows,
∂hi ∂hi
> κ2 κ1 φgij > 0 and > κ2 (κ1 φ)n−1 gij1 gj1 j2 · · · gjn−1 jn gjn k > 0.
∂ ỹj ∂ ỹk1.3. ANALYTICAL RESULTS 23
Similarly
∂ai ∂ai
− > (1−κ3 )κ1 φgij > 0 and − > (1−κ3 )(κ1 φ)n−1 φgij1 gj1 j2 · · · gjn−1 jn gjn k > 0.
∂ ỹj ∂ ỹk
Agent A’s debt increases if agent B’s lifetime income increases—as long
as there is a direct or indirect link from A to B. That link exists, if agent
A cares about agent B, or if agent A cares about some agent C who cares
about agent B.
Second, we show how aggregage housing and debt react to changes in
type j’s income Yj . We first define the popularity of a type.
Definition 1 (Popularity). We define the vector of popularities as
∞
X
T T
b =1 (κ1 φG)i ,
i=1
and type i’s popularity bi as the ith component of b.
The popularity is the sum of all paths that end at individual i. It measures
how many agents compare themselves with i (directly and indirectly) and
how strongly they do. The popularity of a type is crucial in determining how
strongly their income will affect economic aggregates.
Proposition 3. The impact of a change in type j’s on aggregate housing
and aggregate debt is proportional to its popularity.
∂ X
hi = κ2 (1 + bj )
∂ ỹj i
∂ X
rai = (1 − κ3 )(1 + bj ).
∂ ỹj i
Proof. Take the expressions from proposition 1 and plug in the definitions
for Y and b (Definition 1), aggregate housing can be written as N
P
h =
PNi=1 i
κ2 i=1 (1 + bi )(ỹi + ra0 ) and aggregate debt can be written as − i=1 rai =
PN i
(1 − κ3 ) ỹi − κ3 ai0 + (1 − κ3 ) N i=1 bi (ỹi + ra0 ). The derivatives follow
i
P P P
immediately.
Corollary 1. If all types i 6= j are connected to agent j and ỹj increases,
then debt-to-income increases for all types i 6= j.24 CHAPTER 1. FALLING BEHIND
Proof. By Proposition 2 debt of types i 6= j increases, while their income is
unchanged. It follows that debt-to-income rises.
Corollary 2. Under Cobb-Douglas aggregation, the results for a in Proposi-
tions 1, 2 and 3 are independent of house prices.
Proof. Under Cobb-Douglas κ0 is divisible by p. This means that p cancels
in κ1 and κ3 . Thus, all p cancel in the expression for a in Proposition 1 and
consequently doesn’t show up in the respective expressions in Propositions 2
and 3.
The results on optimal debt in Propositions 2 and 3 and Corollary 1 break
down if houses are not durable. When houses are non-durable, for any small
time interval ∆, the depreciation rate has to be δ = ∆1 , so that the housing
stock depreciates immediately,
(1 − ∆δ)ht = 0.
To analyze this case in continuous time, we thus let the depreciation rate δ
go to infinity.
Corollary 3. When δ → ∞, optimal debt does not depend on others’ in-
comes.
Proof. It can be easily seen that κ3 → 1 as δ → ∞, thus (1 − κ3 ) → 0.
Since all other terms in expression (1.3) are bounded, the part containing
the Leontief inverse vanishes and becomes −ra = ỹ − Y = −ra0 .
1.3.3 How rising top incomes fuel the mortgage boom:
Intuition
It is at the heart of the mechanism that there is a complementarity between
a household’s housing stock and their reference measure. When top incomes
YN rise, households of type N will improve (or upsize) their housing stock
hN , increasing the reference measure h̄i for all types i that care about type N
directly or indirectly. Each of these agents will optimally substitute durable,
status-enhancing housing for non-durable status neutral consumption.
For debt to be affected it is key that the status good is durable and the
status-neutral good in non-durable. Agents want their stock of the durable
good to be constant over time. They need to pay for the whole good ph
upfront and only replace the depreciation δph in the future. Agents need to
shift some of their lifetime income forward to finance their house. They use1.3. ANALYTICAL RESULTS 25
mortgages as an instrument to achieve that. The greater the value of the
house, the bigger is the necessary mortgage.
Corollary 3 formalizes this intuition. It shows that if houses are non-
durable (δ → ∞), the term containing the Leontief inverse of the adjacency
matrix G vanishes.
1.3.4 Example: Upward comparisons with three types
of agents
We now illustrate the results for the simple case of three types of agents,
poor P , middle class M , and rich R. The poor type compares himself with
both other types, the middle type compares himself only with the rich type,
and the rich type not at all. Figure 1.3.1 shows the corresponding graph and
its adjacency matrix.
P M R
gP R
P 0 gP M gP R
gP M G = M 0 0 gM R
P M gM R R R 0 0 0
(a) The graph. (b) The adjacency matrix.
Figure 1.3.1: The social network structure with three types, assuming upward
comparisons. The network can be represented as a graph and as its adjacency
matrix.
Since G is a triangular matrix with only zeros on the diagonal, it is
nilpotent (G3 = 0), and thus the Leontief inverse exists.
P M R
P 0 0 gP M gM R
2
G = M 0
0 0 , G3 = 0
R 0 0 0
The matrix G2 counts the paths of length 2. In our example there is only
one such path—from type P to type R. Defining φ̃ = κ1 φ, the vector of
Bonacich centralities is given by
∞
X 2
X 0 α · gP M α · gP R + α2 · gP M · gM R
αi Gi = I + αi Gi = I + 0 0 α · gM R
i=0 i=1 0 0 026 CHAPTER 1. FALLING BEHIND
The partial equilibrium choices for housing and debt are now given by
hP 1 φ̃ · gP M φ̃ · gP R + φ̃2 · gP M · gM R YP
hM = κ2 0 1 φ̃ · gM R YM
hR 0 0 1 YR
aP 0 φ̃ · gP M φ̃ · gP R + φ̃2 · gP M · gM R YP
−r aM = ỹ − κ3 Y + (1 − κ3 ) 0 0 φ̃ · gM R Y M
aR 0 0 0 YR
An agent’s housing choice increases linearly in own permanent income, Y =
ỹ + ra0 , and on the permanent income of agents in the reference group.
The poor agent’s consumption increases through the direct links, but also
indirect links (which are discounted more strongly). Agents’ decisions to
save or borrow depend on the ratio of initial wealth a0 and income ỹ. The
higher the income relative to initial wealth, the greater the need to borrow.
1.4 Parameterization
Now we return to the full model. We parameterize the model to be consistent
with the aggregate relationships of mortgage debt, house value and income in
the US at the beginning of the 1980s. We use the estimated income process
from Guvenen et al. (2019) and assign eight other parameters externally.
The remaining two parameters (the discount rate ρ and the utility weight of
housing status ξ) are calibrated internally so that in general equilibrium the
aggregate net-worth-to-income ratio and aggregate loan-to-value ratio match
these aggregate moments in the 1983 Survey of Consumer Finances.
Income Process We translate the estimated income process from Guvenen
et al. (2019) to continuous time. It has a permanent, a persistent and a
transitory component and state-dependent unemployment risk. Guvenen
et al. (2019) estimate it to data from the time period 1994–2013. In order
to construct the income process for the baseline economy E (corresponding
to the year 1980) we rescale the permanent component following evidence on
the changes in the income distribution from Kopczuk et al. (2010), Guvenen,
Ozkan, and Song (2014) and Guvenen et al. (2018).
The cross-sectional dispersion of incomes has increased substantially be-
tween 1980 and 2007. Figure 1.4.1 (taken from Guvenen et al., 2018, Figure
12) shows the variation of three common measures over time: the P90/P50
ratio, the P90/P10 ratio and the standard deviation of log-earnings. These
changes in the variation of incomes can come from either component of the
income process, or even a combination of them.1.4. PARAMETERIZATION 27
measure P90P10 P90P50 SD log
140%
relative to 2004
120%
100%
80%
60%
1962 1971 1980 1989 1998 2007
Figure 1.4.1: Change in the cross-sectional distribution of male earnings in
the US. Vertical bars in 1980, 2004 and 2007. Source: Guvenen et al. (2018)
While there is no consensus yet,10 as to which of those factors contributed
how much, there is evidence that rising permanent inequality explains a
substantial share in increased cross-sectional variation. Kopczuk et al. (2010,
Figure V) find that almost all of the change in earnings variation came from
increases in permanent inequality. This finding is supported by Guvenen
et al. (2014, Figure 5) who show that the variances of earnings shocks have
had a slight downward trend since 1980.
Given this evidence, we attribute all change in inequality to changes in
permanent inequality (σα ). In our income process, permanent income in-
equality is represented by the permanent component α̃. So, given the dis-
cretized version of the process, we stretch the upper half of the α̃-grid to
match the changes in the cross-sectional P90/P50 ratio.
When translating the process to continuous time, we assume that shocks
arrive on average once a year (instead of every year). Moreover, we replace
the discrete time iid process by jump-drift process (εit ) that is re-centered
around zero whenever a shock hits so that shocks do not accumulate. The
mean reversion rate of the persistent process (zit ) is the negative log of the
discrete time persistence parameter which preserves the same annual auto-
correlation. The exit rate out of nonemployment is chosen to match the
average duration of nonemployment stays in the discrete time process. As
households in our infinite horizen model die at a constant rate, we remove all
age-dependence by setting the age profile constant (to the value at the mean
age t̄).11 Table 1.1 shows all parameters of our continuous time earnings
10
Carr and Wiemers (2016, 2018) show that depending on data source, sample selection,
and statistical model one can find substantial differences in the decomposition into risk
and permanent inequality.
11
This affects the mean of log earnings as well as the arrival rate of nonemployment
shocks.28 CHAPTER 1. FALLING BEHIND
Table 1.1: Earnings Process Parameters
Parameter Value
Fixed Effects
µα mean 2.7408 + 0.4989t̄ − 0.1137t̄2
σα standard deviation 0.467
Persistent Process
λz arrival rate 1.0
θz mean reversion rate − log(0.983)
pz mixture probability 0.267
µz location parameter -0.194
σ1z std. dev. of first Normal 0.444
σ2z std. dev. of second Normal 0.076
σ0z std. dev. of zi0 0.495
Transitory Shocks
λε arrival rate 1.0
θε mean reversion rate 0.0
pε mixture probability 0.092
µε location parameter 0.352
σ1ε std. dev. of first Normal 0.294
σ2ε std. dev. of second Normal 0.065
Nonemployment Shocks
a constant −3.2740 − 0.8935t̄
b slope −4.5692 − 2.9203t̄
λ1 exit rate
ν
1/0.9784
process.
We put the process on a discrete state space, using the approach of
Kaplan et al. (2018). We discretize each component separately, obtaining
continuous-time Markov chains12 for the persistent and transitory compo-
nents and combining them afterwards. Finally, we add the state-dependent
non-employment risk.
Income Taxation We use the progressive income tax function from Heath-
cote, Storesletten, and Violante (2017),
T (y) = y − τ0 y 1−τ1 .
12
Mostly called Poisson processes in the literature.1.4. PARAMETERIZATION 29
Table 1.2: Baseline Parameters
Parameter description Source Value
Preferences
φ strength of keeping up motive Bellet (2017) 0.7
ρ discount rate internal 0.02
ξ utility weight of housing internal 0.277
1
1−ε
intra-temporal elasticity of substitution Flavin and Nakagawa (2008, AER) 0.15
γ inverse intertemporal elasticity of substitution standard 1.5
m
1
constant mortality rate 45 years worklife 45.0
Housing and financial technogy
α
1−α
price elasticity of housing supply Saiz (2010, QJE) 1.5
δ depreciation rate of housing Bureau of Economic Analysis 0.021
ω maximum loan-to-value ratio P95 of LTV 0.85
aS /ȳ exogenous net asst supply cum. current account -0.01
Taxation and Unemployment Insurance
τ0 level of taxes internal 0.932
τ1 progressivity Heathcote et al. (2017) 0.15
b replacement rate Dept of Labor 0.32
If non-employed, households receive a fraction b of their potential earnings
from unemployment insurance. Thus, the post-tax disposable income is given
by
yitpot − T (yitpot ) if employed
(
ỹt =
byitpot otherwise.
We follow Kaplan et al. (2020) in our choice of the parameters τ0 , τ1 . The
progressivity parameter τ1 is an estimate from Heathcote et al. (2017) and
the scale parameter τ0 is set to match the tax revenue from personal income
tax and social security contribution as a share of GDP in 1980 (14.4%).13 We
set the replacement rate to 32%, matching average unimployment insurance
benefits, as a fraction of average wage, as reported by the US Department of
Labor.14
Preferences and demographics The discount rate ρ and the utility
weight of housing status ξ are internally calibrated to match the economy-
wide mortgage-debt-to-income and loan-to-value ratios from the 1983 SCF.
The interpretation of the utility weight ξ differs from other models, because
ξ is the utility weight of housing status (not housing stock).
The literature has not yet converged to a common value for the intratem-
poral elasticity of substitution 1−ε
1
. Estimates range from 0.13–0.24 (from
structural models; e.g. Flavin and Nakagawa, 2008; Bajari, Chan, Krueger,
13
Retrieved from https://taxfoundation.org/federal-tax-revenue-source-1934-2018/.
14
Retrieved from https://oui.doleta.gov/unemploy/DataDashboard.asp.30 CHAPTER 1. FALLING BEHIND
and Miller, 2013) up to 1.25 (Ogaki and Reinhart, 1998; Piazzesi, Schnei-
der, and Tuzel, 2007, using estimates from aggregate data). Many papers
have picked parameters out of this range.15 We follow the evidence from
structurally estimated models and set the elasticity to 0.15.
The inverse intertemporal elasticity of substitution γ is set to the standard
value 1.5. The constant annual mortality rate m = 1/45 is set to get an
expected (working) lifetime of 45 years.
Social comparisons For the status function we use a ratio-specification
s(h, h̄) = h̄hφ as in Abel (1990). Bellet (2019) shows that this functional
form captures the empirical finding that the utility loss from a big houses
decreases with own house size. Households with a medium sized house are
more affected by top housing than households living in a small house.16
We define the reference measure as the 90th percentile of the (endogenous)
housing distribution, h̄ = hP90 . This follows Bellet (2019) who shows that
households are only sensitive to changes in the top quintile of the house (size)
distribution and strongest when the reference measure is defined as the 90th
percentile.17
The parameter φ pins down the strength of the comparison motive. It is
the ratio of two utility elasticities
elasticity of utility w.r.t. h̄
φ=− .
elasticity of utility w.r.t. h
If the reference houses improves by 1%, then agents would have to improve
their own house φ% to keep utility constant. Bellet (2019) estimates φ to
be between 0.6 and 0.8 when setting h̄ equal to the 90th percentile of the
housing distribution. We thus choose φ = 0.7.18 Note that Bellet (2019)
estimates exactly this sensitivity allowing us to take his estimates without
an intermediate indirect inference procedure.
Technology and Financial Markets The construction technology pa-
rameter α is set to 0.6 so that the price elasticity of housing supply ( 1−α
α
)
equals 1.5, which is the median value across MSAs estimated by Saiz (2010).
15
Garriga and Hedlund (2020) use 0.13, Garriga, Manuelli, and Peralta-Alva (2019) use
0.5, many papers use Cobb-Douglas (that is, an elasticity of 1.0, e.g. Berger et al., 2018;
Landvoigt, 2017) and Kaplan et al. (2020) use 1.25.
16
Note that the more tractable linear specification (h − φh̄) as used in Campbell and
Cochrane (1999), Ljungqvist and Uhlig (2000) and Section 1.3 would imply the opposite
relationship between own house size and comparison strength.
17
See Figure 6 in Bellet (2019).
18
See Table 2 in Bellet (2019)1.5. QUANTITATIVE RESULTS 31
Table 1.3: Targeted moments
moment model data (80/83)
aggregate loan-to-value 0.24 0.24
aggregate networth-to-income 4.63 4.6
tax-revenue-to-income 0.14 0.14
The maximum admissible loan-to-value ratio (ω) is set to 0.85, to match the
95th percentile of the LTV distribution in the SCF (Kaplan et al., 2020, use a
similar approach for setting the debt-service-to-income constraint). Finally,
we specfiy the exogenous net supply of assets aS to match the net foreign
debt position of the US. The net foreign debt position can be well approxi-
mated by the cumulative current account deficit of the US (Gourinchas, Rey,
and Govillot, 2017), which was 1% of GDP in 1980 (see also Figure 1.5.3).
1.4.1 Internal calibration and model fit
For the internal calibration we target the aggregate networth-to-income ratio
(4.6) and the aggregate loan-to-value ratio (0.24) from the first wave of the
Survey of Consumer Finances in 1983. We pick the utility weight of hous-
ing ξ and the the discount rate ρ so that simulated moments match their
counterparts in the data. Table 1.3 shows that the model fits the data very
well.
1.5 Quantitative Results
In this section we study how the model economy reacts to changes in the
environment in the long-run. We compare the initial stationary equilibrium
E (corresponding to 1980) with alternative stationary equilibria E x where
we adjust income inequality I, capital inflow (Saving Glut) S and and the
collateral constraints ω to reflect the observed changes in the data.
In the first experiment we compare E to E I where only income inequality
rises. Afterwards we set these results into perspective, comparing them to
equilibria that reflect other (combinations) of mechanisms like E S (Saving
Glut), E ω (relaxation of borrowing limit) and E ISω (all three mechanisms).32 CHAPTER 1. FALLING BEHIND
data Ineq & KJ
mortgage-to-income house prices
relative change
60%
90%
40%
60%
30% 20%
0% 0%
data model data model
Figure 1.5.1: Comparison simulated changes in aggregate variables between
the steady states in 1980 and 2007.
1.5.1 Rising inequality, mortgages and house prices
We now move to the main experiment of the paper. We start from the
steady-state calibrated to the U.S. economy in 1980. Then we raise income
inequality to match the level in 2007 and compare the mortgage debt, house
prices and housing production between 1980 and 2007. Before getting to the
results, we describe how we model the increase in income inequality.
Modelling rising inequality
As we have discussed in Section 1.4, the cross-sectional dispersion of income
has increased substantially between 1980 and 2007. Given the evidence in
Kopczuk et al. (2010) and Guvenen et al. (2014) we attribute the whole
change in cross-sectional inequality to changes in permanent inequality. In
our model permanent inequality is reflected by the standard deviation of the
distribution of the permanent component σα . Thus, we increase σα to match
the increase in the cross-sectional P90/P50 ratio.
Results
Rising inequality and keeping up with the Joneses creates both a mortgage
boom and a house price boom in our model. Figure 1.5.1 shows that our
mechanism generates an increase in the mortgage-to-income ratio of about
60%—about half of the increase that is observed in the data. Similarly, we
generate a house price boom (+38%) that generates 62% of the increase in
the data.
Keeping up with the Joneses are a quantitatively important to generate
the results. Figure 1.5.2 shows how much of the simulated debt and mortgageYou can also read