Journal of International Economics - NYU Stern
←
→
Page content transcription
If your browser does not render page correctly, please read the page content below
Journal of International Economics 129 (2021) 103418

                                                               Contents lists available at ScienceDirect

                                                 Journal of International Economics
                                                 journal homepage: www.elsevier.com/locate/jie

International trade and social connectedness
Michael Bailey a, Abhinav Gupta b, Sebastian Hillenbrand b, Theresa Kuchler b,
Robert Richmond b,⁎, Johannes Stroebel b
a
    Facebook, Inc, United States of America
b
    Stern School of Business, New York University, United States of America

a r t i c l e             i n f o                           a b s t r a c t

Article history:                                            We use de-identified data from Facebook to construct a new and publicly available measure of
Received 11 September 2020                                  the pairwise social connectedness between 170 countries and 332 European regions. We find
Received in revised form 23 December 2020                   that two countries trade more when they are more socially connected, especially for goods
Accepted 23 December 2020
                                                            where information frictions may be large. The social connections that predict trade in specific
Available online 29 December 2020
                                                            products are those between the regions where the product is produced in the exporting coun-
Dataset link: https://data.mendeley.com/                    try and the regions where it is used in the importing country. Once we control for social con-
datasets/7wddm84w9r/1                                       nectedness, the estimated effects of geographic distance and country borders on trade decline
                                                            substantially.
                                                                                                                  © 2020 Elsevier B.V. All rights reserved.
JEL codes:
F1
F5
F6
Keywords:
International trade
Social connectedness
Information frictions
Border effects

   The propensity for residents of different countries to be connected to one another varies enormously. For example, a
U.S.-based Facebook user is 65% more likely to be friends with a given Facebook user living in Germany than with a
given Facebook user living in France. Such differences in bilateral social connectedness play an important role in many nar-
ratives of economic and political interactions between countries. For example, beginning with Tinbergen (1962), re-
searchers have explored the determinants of international trade using gravity models that relate trade between countries
to various measures of the relationship between those countries.1 These models have had substantial empirical success,
but their economic underpinnings—and especially the mechanisms behind the large estimated negative effect of physical
distance on trade—have remained elusive. One prominent explanation is that geographic closeness proxies for social con-
nections between individuals, which can help facilitate trade. While such a mechanism is intuitively appealing, the absence
of comprehensive data on social connections across regions and countries has limited researchers' ability to provide evi-
dence in favor of this interpretation.

  ⁎ Corresponding author.
     E-mail addresses: mcbailey@fb.com (M. Bailey), agupta4@stern.nyu.edu (A. Gupta), shillenb@stern.nyu.edu (S. Hillenbrand), tkuchler@stern.nyu.edu (T. Kuchler),
rrichmon@stern.nyu.edu (R. Richmond), johannes.stroebel@nyu.edu (J. Stroebel).
  1
    Prominent contributions that have explored the relationship between geography and trade include Leamer and Levinsohn (1995), Trefler (1995), Obstfeld and
Rogoff (2000), Eaton and Kortum (2002), and Hortaçsu et al., (2009).

https://doi.org/10.1016/j.jinteco.2020.103418
0022-1996/© 2020 Elsevier B.V. All rights reserved.
M. Bailey, A. Gupta, S. Hillenbrand et al.                                                                             Journal of International Economics 129 (2021) 103418

    In this paper, we introduce a new measure of the pairwise social connectedness between 170 countries and 332 European re-
gions, and show that much of the variation in global trade can indeed be explained by patterns of social connectedness. We also
find support for mechanisms proposed by theoretical models in which social connectedness facilitates trade by reducing informa-
tion frictions.2 By exploiting the granular nature of our social connectedness measure and detailed data on the geography of pro-
duction, we are able to further understand the impact of social connectedness on trade flows. Specifically, we show that it is the
social connections between the regions where a good is produced in the exporting country and those regions where it is used in
the importing country that predict trade in that good. Once we control for social connectedness, the estimated effects of geo-
graphic distance and country borders on trade decline substantially.
    Our measure of social connectedness is based on a de-identified snapshot of all friendship links on Facebook, the world's larg-
est online networking site with more than 2.7 billion active users around the globe. Our Social Connectedness Index between pairs
of regions corresponds to the relative probability of a friendship link between Facebook users in the two regions. We construct
this pairwise measure of social connectedness for 170 countries and 332 European regions. To facilitate further research on the
relationship between social connectedness and trade flows, we have made the Social Connectedness Index publicly available to
other researchers.3
    When relating the Social Connectedness Index to trade flows, we do not interpret our findings as evidence that Facebook links
directly cause or facilitate trade. Instead, we interpret our measure of social connectedness as providing a high-quality proxy for
existing trade-facilitating relationships across countries and regions. The ability of our data to capture these relationships at a geo-
graphically disaggregated level is the result of Facebook's scale, the relative representativeness of its user body, and the fact that
people primarily use Facebook to interact with real-world friends and acquaintances. Throughout the paper, we present a number
of results that mitigate concerns that our findings are the result of omitted country-level variables or reverse causality whereby
trade flows lead to more underlying friendships.
    We first describe the rich patterns of social connectedness observed in our data. About half the variation in social connected-
ness between countries is explained by geographic distance. Quantitatively, a 10% increase in the distance between two countries
is associated with a 12%–16% decline in their social connectedness. Migration patterns and colonial history further influence the
probability of present-day friendship links across country pairs. We also find stronger social connections between countries that
share a common language, as well as between countries that are similar in terms of economic development, religious beliefs, and
the genetic make-up of their populations. Within Europe, common language and common history shape the social connectedness
between regions over and above distance and common nationality. Beyond these systematic patterns, our measure of social con-
nectedness is also affected by idiosyncratic factors that are specific to particular country and region pairs.
    Next, we document that patterns of social connectedness explain a substantial part of the variation in international trade
flows. When we introduce social connectedness into a standard gravity model of country-level goods trade, we find that social
connectedness and geographic distance explain similar shares of the cross-sectional variation in trade flows. The elasticity of
trade in goods with respect to social connectedness is 0.28 in specifications that also control for geographic distance. This implies
that, all else equal, trade between the U.S. and Germany should be 18% higher than trade between the U.S. and France, since the
U.S. is 65% more connected to Germany than it is to France. Controlling for social connectedness reduces the distance elasticity of
trade from about −1 to roughly −0.70. This is a substantial decline that does not occur when controlling for other gravity vari-
ables such as common language or common colonial origins. Social connectedness as measured by today's Facebook links strongly
explains trade flows at least since the 1980s, demonstrating that the underlying trade-facilitating relationships across countries
are very stable over time. The combined evidence suggests that social connectedness is an important determinant of trade
flows, and highlights that the relationship between geographic distance and trade in the prior literature might partially capture
this role of social connectedness.
    We then explore possible explanations for the observed relationship between trade flows and social connectedness. In partic-
ular, the literature has proposed that social links can facilitate trade by alleviating a number of informal trade barriers, including
contract enforcement frictions and search costs due to information frictions (see Chaney, 2016, for a review). We provide evi-
dence suggesting that social links as measured through the Social Connectedness Index help alleviate information frictions while
they do not appear to significantly mitigate contract enforcement frictions.
    We first study how the elasticity of trade with respect to social connectedness varies for trade in different products. In partic-
ular, Rauch (1999) and Rauch and Trindade (2002) suggest that information frictions are largest for products that are not traded
on organized exchanges. Consistent with the idea that social connections can help to mitigate such information frictions, we show
that the elasticity of trade to social connectedness is particularly large for these non-exchange-traded goods. To understand
whether social connectedness can mitigate contract enforcement frictions, we also study how the elasticity varies with measures
of the rule of law in the importing and exporting countries. This analysis is motivated by a literature that shows that weak rule of
law reduces trade due to difficulties with the enforcement of contracts (e.g., Anderson and Marcouiller, 2002). In these

  2
    Papers which study the role of information frictions in international trade include, Jensen (2007); Aker (2010); Allen (2014); Chaney (2014); Simonovska and
Waugh (2014); Startz (2016); Steinwender (2018).
  3
    This new and comprehensive measure of international social connectedness can be downloaded at https://data.humdata.org/dataset/social-connectedness-index.
See Bailey et al. (2018a, 2020a) for a description of a related data set measuring the social connectedness between U.S. counties, and between zip codes in the New York
metro area. See Bali et al. (2018), Hirshleifer et al. (2019), Rehbein et al. (2020), Kuchler et al. (2020a, 2020b), Bailey et al. (2020b), and Wilson (2019) for recent uses of
the U.S. Social Connectedness Index in economics and finance research.

                                                                                       2
M. Bailey, A. Gupta, S. Hillenbrand et al.                                                                       Journal of International Economics 129 (2021) 103418

regressions, we find little variation in the elasticity across countries with different levels of rule of law, suggesting that the pri-
mary channel behind the observed aggregate relationships is the reduction of information frictions.
    After documenting how social connectedness relates to trade at the country level, we use our granular measure of social con-
nectedness across sub-national European regions to further understand the mechanism behind the observed relationships. Our re-
sults in that section provide new evidence on the interaction of trade flows, the spatial distribution of production, and the
structure of social networks. Our findings also help us rule out country-level omitted variables or reverse causality as alternative
interpretations of the observed aggregate relationship between social connectedness and trade.
    Our approach builds on a literature that documents that firms and individuals working at those firms are central to facilitating
international goods trade.4 Based on this insight, we construct product-specific measures of the social connectedness between
countries, which overweight the connectedness between those regions where the goods are produced in the exporting country
and those regions where the goods are used in the importing country. This measure contrasts with our baseline measure of social
connectedness between two countries, which corresponds to the population-weighted average connectedness between all regions
in the countries. As an example, more than 80% of Italian exports of non-metallic mineral products to Greece are used as inputs in
the Greek construction sector. Our proposed measure of social connectedness relevant for exporting non-metallic mineral prod-
ucts from Italy to Greece thus overweights the observed connectedness between the regions that produce non-metallic mineral
products in Italy (primarily the Piedmont region around Torino) and the regions with significant construction employment in
Greece (e.g., the Attica region around Athens).
    We then regress product-level trade between countries on both measures of social connectedness. When controlling for the
product-specific measure of social connectedness, the population-weighted measure has no further predictive power for trade
at the product-level. This remains true after controlling for product-specific measures of distance. This evidence suggests that it
really is the social connectedness between the regions where a good is produced and the regions where it is used that matters
for trade in that good. We also find that the elasticity of trade to the product-specific measures of social connectedness is unaf-
fected by the inclusion of country pair fixed effects, which absorb all country-level determinants of trade. This finding dramatically
reduces the scope for omitted variables such as common preferences to explain the observed relationships between social con-
nectedness and trade.
    Our analysis of the effects on trade of product-specific social connectedness between countries also allows us to rule out the
presence of a quantitatively large reverse causality from trade to our measure of connectedness. If trade did in fact cause substan-
tial social connections, the various product-specific measures of social connectedness between two countries should be systemat-
ically larger than these countries' measures of population-weighted social connectedness. For instance, in the example above, we
would expect the Piedmont region in Italy and the Attica region in Greece to be disproportionately more connected than a ran-
dom pair of regions in the two countries, as a result of the connections formed from trading non-metallic mineral products. In
contrast with this prediction, we find that the regions that are most important for the trade in a given product are equally likely
to be more or less connected than two random regions across a country pair.
    In the final part of the paper, we study the relationship between regional social connectedness and sub-national goods trade.
We use rail-freight flows between regions in the European Union as our measure of trade flows. This analysis allows us to exam-
ine the determinants of the border effect, the empirical regularity that, conditional on the distance between two regions, trade is
much larger between regions of same country (see McCallum, 1995; Anderson and Van Wincoop, 2003; Chen, 2004). Consistent
with existing estimates of the border effect, we find that, all else equal, trade within countries is seven to nine times as large as
trade between countries. This is true despite the fact that the European Union is a common market with few formal barriers to
cross-country trade. When we control for the social connections between regions, the estimated border effect drops by between
75% and 90% across various specifications. This suggests that much of the effect of borders on trade may be the result of the fact
that social connections fall at borders.
    The rest of the paper is organized as follows. Section 1 presents our new measure of international social connectedness and
explores its determinants. Section 2 describes the relationship between international trade flows and social connectedness.
Section 3 studies the mechanism through which social connectedness influences trade patterns, focusing on heterogeneities across
products and countries. In Section 4, we present results using our product-specific measures of social connectedness and explore
patterns in regional trade within Europe.

1. Measuring international social connectedness

    We construct our measure of the social connectedness between countries and European regions using de-identified adminis-
trative data from Facebook, a global online social networking service. Facebook was created in 2004, and, by the second quarter of
of 2020, had 2.7 billion monthly active users globally. Of these monthly active users, 256 million were based in the U.S. and
Canada, 410 million in Europe, 1.14 billion in the Asia-Pacific region, and 892 million in the rest of the world. With the exception
of a few countries where social media services including Facebook are banned—most notably China, Iran, and North Korea—
Facebook has a non-trivial footprint in essentially all countries around the world.
    We work with a de-identified snapshot of all active Facebook users from August 2020. For these users, we observe their coun-
try of location, as well as the set of other Facebook users that they are connected to. For users in Europe, we also observe their

  4
    Papers that study the importance of firms in trade include Melitz (2003), Bernard et al. (2003), Bernard et al. (2007), Chaney (2008), Helpman et al. (2008), Melitz
and Ottaviano (2008), Chaney (2018), and Bernard et al. (2012).

                                                                                  3
M. Bailey, A. Gupta, S. Hillenbrand et al.                                                                          Journal of International Economics 129 (2021) 103418

region of location at the NUTS2 (Nomenclature of Territorial Units for Statistics level 2 regions) level, similar to Bailey et al.
(2020c). These NUTS2 regions include between 800,000 and 3,000,000 individuals, and are defined for European Union members,
European Union candidates, and European Free Trade Association members. They are generally based on existing subnational ad-
ministrative borders. For example, in Italy the NUTS2 geographies correspond to the 21 “regions”, while in the Netherlands they
correspond to the 12 “provinces”; smaller countries in Europe, such as Latvia and Malta, are represented by a single NUTS2 region.
Location in a country or region is assigned based on users' information and activity on Facebook, including the stated city on their
Facebook profile, and device and connection information.
   To compare the intensity of social connectedness between locations with varying populations and varying Facebook usage
rates, we construct our Social Connectedness Index, SCIi,j, as the total number of connections between individuals in location i
and individuals in location j, divided by the product of the number of Facebook users in those locations, as in Eq. 1:

                      FB_Connectionsi,j
         SCIi,j ¼                                                                                                                                                      ð1Þ
                    FB_Usersi  FB_Usersj

    For both countries and regions, we rescale this number to have a minimum value of 1, and a maximum value of 1,000,000. The
Social Connectedness Index therefore measures the relative probability of a Facebook friendship link between a given Facebook user
in location i and a given user in location j. Overall, we will work with information on the pairwise social connectedness between
170 countries, for a total of 170 × 169 = 28,730 country-pair combinations. At the NUTS2 level, we observe the social connect-
edness between 332 × 331 = 109,892 pairs of European regions.5

1.1. Interpreting the social connectedness index

    Two important questions arise when interpreting SCIi,j as a proxy for potentially trade-facilitating relations between countries
or regions: whether Facebook friendships correspond to real-world friendship links of Facebook users, and whether Facebook
users are representative of the countries' or regions' populations.
    On the first issue, we believe that Facebook friendships provide a reasonable proxy for real world friendship networks. For the
United States, Duggan et al. (2015) have shown that Facebook friendship patterns correspond closely to real-world friendship net-
works. While similar studies do not exist for most other countries, we believe that there are a number of reasons to think that we
are also capturing good representations of real-world social networks of Facebook users outside of the United States. For example,
establishing a connection on Facebook requires the consent of both individuals, and there is an upper limit of 5,000 on the num-
ber of connections a person can have. As a result, networks formed on Facebook will more closely resemble real-world social net-
works than those on other online platforms, such as Twitter, where uni-directional links to non-acquaintances, such as celebrities,
are common. Consistent with this conclusion, our prior work with micro-data from Facebook has found that many economic de-
cisions, such as whether to buy a house or which phone to purchase, are influenced by related decisions of a person's Facebook
friends (Bailey et al., 2018b, 2019a, 2019b).
    On the second issue, it is likely that the representativeness of Facebook users will differ across locations. While Duggan et al.
(2016) have shown that U.S. Facebook users are quite representative of the U.S. population, this is unlikely to be the case every-
where. For example, in countries with relatively low internet penetrations, those individuals with access to the internet are likely
to be a non-representative subset of the overall populations. To the extent that having internet access and having friends abroad
are positively correlated, our measure would then overstate the international linkages of the average resident in countries with
low internet usage.6 In our analysis, we account for such heterogeneities in the average connectedness of each location by includ-
ing fixed effects for locations i and j in all specifications. This approach allows us to explore connectedness between locations
i and j, holding fixed the average propensity in each location of having Facebook friends in different places.
    In the end, while no measure of social connectedness is perfect, we believe that our Social Connectedness Index, which is based
on hundreds of billions of Facebook friendship links from 2.7 billion Facebook users, provides a valuable large-scale measure of
the geographic distribution of social networks. Indeed, it is hard to imagine an alternative measure that would allow us to mea-
sure social connections at this scale and scope. We hope that the easy accessibility of our Social Connectedness Index will facilitate
more research on the role of social connectedness in economics and across the social sciences.

1.2. Determinants of social connectedness

   We next explore a number of factors that help explain the observed patterns of social connectedness across locations. We
summarize our central findings in the main body of the paper and present a more extensive analysis in Appendix A.
   We begin by exploring a few case studies that highlight how social connectedness varies across specific countries and regions.

  5
    The publicly available Social Connectedness Index data does not include information for a number of countries, such as Afghanistan, China, Cuba, Eritrea, Iran, Iraq,
Israel, North Korea, Russia, Somalia, Sudan, Syria, Tajikistan, Turkmenistan, Venezuela, Western Sahara, and Yemen. In addition, we are missing gravity variables for a
number of countries that are included in the SCI data (e.g., Montenegro, Serbia, and Kosovo).
  6
    Differential online access is less of an issue across our European regions. Indeed, statistics from Eurostat show that in 2019, 90% of households in the European Union
had access to the internet. However, Facebook usage rates conditional on internet access can still vary in systematic ways across these regions. As a result, one might
worry that Facebook users in regions with lower Facebook penetrations are connected to other regions at rates that are not representative of the full populations.

                                                                                    4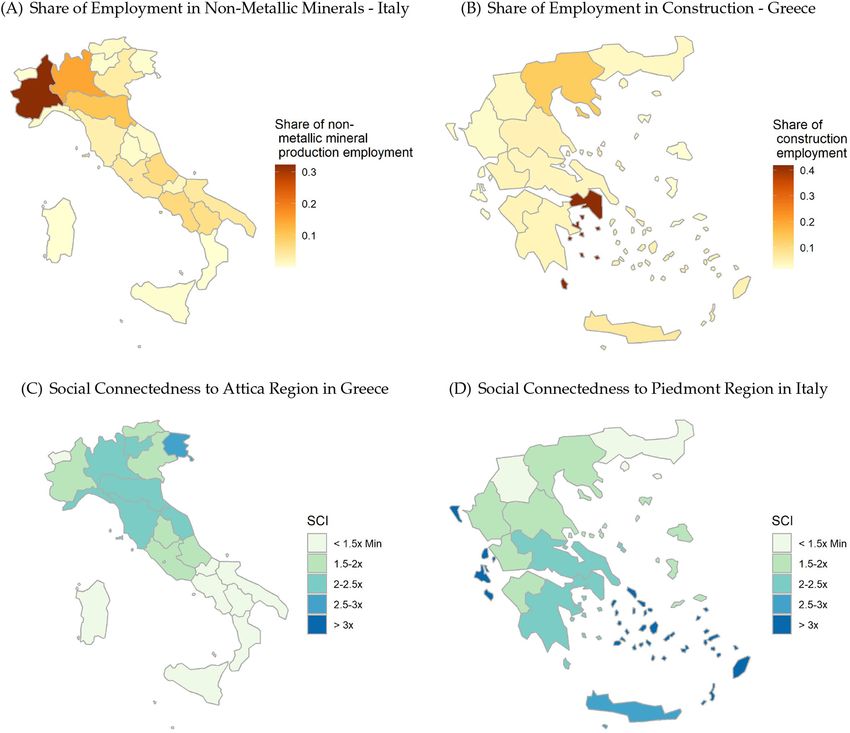
M. Bailey, A. Gupta, S. Hillenbrand et al. Journal of International Economics 129 (2021) 103418
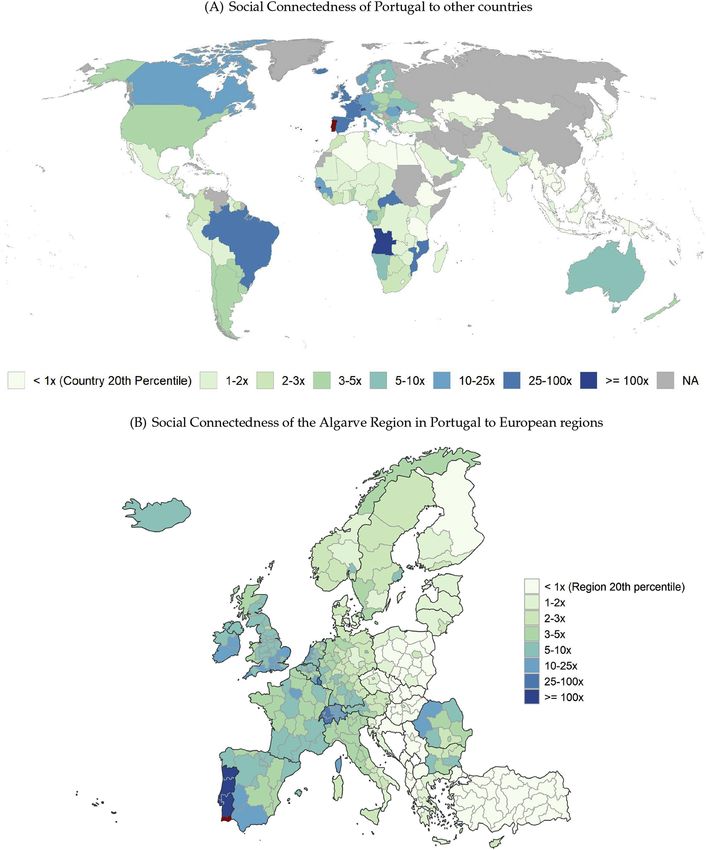
Panel A of Fig. 1 shows the social connectedness of Portugal to other countries around the world. Darker colors correspond to
higher connectedness. Portugal has the strongest links to geographically close countries in Western Europe. Portugal's interna-
tional connections also highlight the role of colonial history and language in shaping present-day social connectedness. The coun-
try is strongly connected to its former (Portuguese-speaking) colonies Brazil, Angola, Guinea-Bissau, and Mozambique. Within
Europe, Portugal is most strongly connected to Luxembourg. These connections, which are stronger than the connections to
Portugal's neighbor Spain, are likely related to the fact that 15%–20% of Luxembourg's population is of Portuguese origin, following
large-scale migration from Portugal to Luxembourg as part of a guest worker program in the 1960s. This finding suggests that past
migration movements continue to influence social connections today.
In Appendix A, we explore the determinants of international social connectedness more systematically. We find that a 10% in-
crease in the distance between two countries is associated with a 10%–15% decline in their social connectedness. Geographic dis-
tance explains about 50% of the variation in social connectedness that remains after accounting for country fixed effects.
Consistent with our findings for Portugal, international migration patterns and colonial history strongly influence the probability
of present-day friendship links across all country pairs. We also find more social connections between countries sharing a com-
mon language, as well as between countries that are similar in terms of economic development, religious beliefs, and the genetic
make-up of their populations. However, while about 70% of the variation in social connectedness across country pairs can be ex-
plained by distance, language, and other systematic factors, our Social Connectedness Index also captures a wide variety of idiosyn-
cratic forces that can shape the social connections between two countries. For example, citizens of Denmark and Australia are 75%
more connected than would be predicted purely by the observable factors described above. These strong social connections
between Denmark and Australia are likely the result of the 2004 marriage of the Danish Crown Prince Frederik to
Australian-born Mary Donaldson. This marriage led to heightened mutual interest between Danish and Australian citizens, and
has substantially increased tourism between the two countries.7 Examples such as this highlight the power of our approach to
measuring social connectedness over and above competing approaches that proxy for social connectedness using a variety of
other gravity variables.
Panel B of Fig. 1 shows the connectedness of the Algarve region in southern Portugal to other regions within Europe. The
strongest social links are to other regions in Portugal. Indeed, the Algarve region is much more strongly connected to the Norte
region in the very north of Portugal than it is to the Andalusia region, its neighbor just across the border in Spain. The Algarve's
connections to other European regions show some of the same patterns seen for Portugal as a whole, such as the strong connec-
tions to Luxembourg. However, additional nuances are visible at the regional level. At the country level, Portugal showed strong
connections to France. When exploring regional social connectedness, we find that connections from Algarve are particularly
strong to Southern France and Corsica, which has a substantial number of Portuguese immigrants. The Algarve also has strong
connections to much of Western Europe, from where it attracts many tourists each year.
The forces highlighted in Panel B of Fig. 1 also show up in more systematic analyses. Indeed, Bailey et al. (2020c) show that
social connectedness within Europe varies with patterns of migration, political borders, geographic distance, language, and other
demographics. The elasticity of social connectedness with respect to distance across European regions is −1.3, similar to compa-
rable elasticities across countries. Social connectedness drops off sharply at country borders, even after controlling for distance:
depending on the country, the probability of friendship between two individuals living in the same country is five to eighteen
times as large as the probability of friendship across two individuals living in different countries. In addition, regions that are
more similar along demographic measures such as language, religion, education, and age are more socially connected. Interest-
ingly, the relationship between political borders and connectedness can persist many decades after boundaries change. For exam-
ple, Bailey et al. (2020c) finds higher social connectedness across regions that were originally part of the Austro-Hungarian
empire, even after controlling for a host of other determinants of present-day social connectedness.
2. Country-level trade and social connectedness
We now turn to understanding the relationship between social connectedness and trade at the country level. We first docu-
ment that trade flows are increasing in social connectedness and show that these effects are larger for goods where information
frictions may be important, suggesting that social connections may facilitate trade by reducing these frictions.
We measure country-level trade flows using bilateral goods trade data from CEPII (Gaulier and Zignago, 2010). In our baseline
analysis, we explore data from 2017, though our results are robust to using trade data from earlier or later years. The raw trade
data is disaggregated at the 6-digit HS96 code level, and contains information on 4,914 product categories. For our first analysis,
we aggregate the product-level trade data into bilateral trade flows between country pairs. When merged with social connected-
ness and gravity data, we have information on 27,060 country pairs.8 To understand the relationship between social connected-
ness and trade flows, we follow the literature to estimate the following gravity regression:
h i
X i,j ¼ exp β1 log SCIi,j þ β2 log Distancei,j þ β3 Gi,j þ δi þ δj ⋅εi,j ð2Þ
7
The Australian Department of Foreign Affairs and Trade notes on its country brief on Denmark that “Australia's profile in Denmark, and vice-versa, was boosted by
the marriage in May 2004 of Australian-born Mary Donaldson to Denmark's Crown Prince Frederik” and the press reported an increase of 30% in tourism from Australia
to Denmark in 2004.
8
This corresponds to pairwise trade data from 165 countries. Relative to the analysis in Appendix A, we lose Botswana, Lesotho, Luxembourg, Namibia, and
Swaziland, for which we have data on social connectedness, but no data on trade.
5
M. Bailey, A. Gupta, S. Hillenbrand et al.                                                                     Journal of International Economics 129 (2021) 103418

Fig. 1. Social Connectedness of Portugal and Algarve Region. Note: Figure shows a heat map of the social connectedness of Portugal to other countries (Panel
A) and of the Algarve region in Portugal to other European regions (Panel B). For each location, the colors highlight connections of the focal location, given in
red. The lightest color corresponds to the 20th percentile of the connectedness across country pairs that include Portugal in Panel A and region pairs that include
Algarve in Panel B; darker colors correspond to closer connections.

                                                                                6
M. Bailey, A. Gupta, S. Hillenbrand et al.                                                                         Journal of International Economics 129 (2021) 103418

where Xi,j denotes the total value of exports from country i to country j, Gi,j captures country pair characteristics, δi and δj are ex-
porter and importer fixed effects, and εi,j is an error term. The importer and exporter fixed effects control for country-level char-
acteristics such as population, GDP, and average tariffs, all of which affect the overall level of trade; they also control for country-
specific differences in the use of Facebook that might affect our measure of social connectedness. We follow a large literature and
control for geographic distance between countries with the log of distance, but will show robustness of all results to including
non-parametric distance controls. The main variable of interest, SCIi,j, is also included in logs. This choice of functional form is
based on the evidence from the binscatter plots in Fig. 2, which show that the relationship between exports and social connect-
edness is approximately log-linear. We estimate regression 2 using Poisson Pseudo Maximum Likelihood (PPML) to account for
zero bilateral trade between many country pairs (see the discussion in Santos Silva and Tenreyro, 2006).9
    The results from estimating regression 2 are presented in Table 1. Column 1 shows results from a specification with only im-
porter and exporter fixed effects. The R2 highlights that 83.7% of the variation in bilateral trade flows is explained by these fixed
effects alone. This finding is unsurprising, since larger and richer countries will trade substantially more on average. Column 2 in-
troduces controls for the social connectedness between each country pair. The elasticity of trade with respect to social connect-
edness is an economically significant 0.65, suggesting that a 1% increase in social connectedness is associated with a 0.65%
increase in bilateral trade. Variation in social connectedness accounts for a substantial share of the cross-sectional variation in
trade flows: over half of the variation in bilateral trade flows that is not explained by the country fixed effects is explained by
social connectedness.
    In column 3, we remove the control for social connectedness, and instead include controls for the geographic distance between
countries. The elasticity of trade with respect to distance is −0.99. This magnitude is consistent with estimates in prior work (see
Head and Mayer, 2014). The increase in the R2 relative to the specification in column 1 is similar in magnitude to the increase
from including social connectedness. Column 4 adds to the specification in column 1 a number of other gravity variables that
the literature has focused on (see Anderson and Van Wincoop, 2003; Head and Mayer, 2014). Sharing a border, a colonizer, a lan-
guage, and a colonial relationship all increase bilateral trade. However, these gravity variables jointly explain a smaller share of
the cross-sectional variation in trade flows than social connectedness or distance do.
    In column 5, we control for both social connectedness and geographic distance. Due to the correlation between these two var-
iables, the elasticity of trade to social connectedness drops from 0.65 to 0.28, and the distance elasticity drops from −0.99 to
−0.70. The additional control for social connectedness increases the R2 by 0.6% relative to that in column 3, which only included
controls for distance in addition to importer and exporter fixed effects. This increase in the R2 corresponds to about 9% of the var-
iation not already explained by distance and fixed effects, and is larger than the incremental variation explained by the other
gravity variables (see column 6). The decline in the distance elasticity from adding controls for social connectedness between col-
umns 3 and 5 is substantial. This finding relates to an important literature that has argued that the estimated effect of distance on
trade is too large and time-invariant to primarily capture trading costs (see Disdier and Head, 2008; Head and Mayer, 2014). This
literature has proposed that geographic distance might instead be proxying for some other frictions such as information frictions
(e.g., Rauch, 2001; Rauch and Trindade, 2002). Since social connectedness can help overcome many of these frictions, our evi-
dence here and in the rest of this paper is highly consistent with this interpretation of the baseline magnitude of the distance
elasticity.
    In column 7, we jointly control for social connectedness, geographic distance, and other gravity variables. The results highlight
that social connectedness explains variation in bilateral trade flows beyond these other predictors. Interestingly, the estimated
elasticity of trade with respect to social connectedness remains unchanged relative to the estimates from column 5, even though
the newly added gravity variables are correlated with social connectedness. Quantitatively we find that, even after controlling for
a host of control variables that potentially proxy for various aspects of social connectedness, a doubling of social connectedness
between two countries is associated with a 28% increase in trade flows.
    The main object of interest in much of this paper is the elasticity between trade and social connectedness. To show that this
elasticity is not picking up some non-linear relationship between log-distance and log-trade flows, the specification estimated in
column 8 replaces our control for log-distance with dummy variables for each percentile of the distance distribution, allowing us
to control for geographic distance in a highly non-linear way. The estimate of the relationship between social connectedness and
trade flows is nearly identical to that in column 7.
    While the analysis presented in Table 1 only explores trade flows in 2017, in Appendix B.3 we show that the relationship be-
tween trade and the Social Connectedness Index is similar when measuring trade flows in every year since 1980. This evidence
shows that the observed relationships are not reflecting a causal effect of Facebook links per se—since Facebook as a company
was only founded in 2004—and are more consistent with our interpretation that Facebook friendship links allow us to measure
important underlying trade-facilitating relationships in a systematic way. In addition, these findings suggest that these trade-
facilitating relationships across countries are highly stable over time.

  9
    Our estimation uses the algorithm in Correia et al. (2019a, 2019b). In the Appendix, we present estimates of regression 2 in logs while dropping observations with
zero trade flows (i.e., we focus on exploring the effect of social connectedness on the intensive margin of trade). All findings are robust to this deviation from the PPML
estimation approach.

                                                                                   7
M. Bailey, A. Gupta, S. Hillenbrand et al.                                                                     Journal of International Economics 129 (2021) 103418

Fig. 2. Aggregate Goods Trade vs. Social Connectedness. Note: Figures show binscatter plots of aggregate bilateral trade and social connectedness. Panel A regresses
log(Exports) on log(SCI) without controlling for distance, while Panel B includes log(Distance) as a control. Both panels control for exporter and importer fixed
effects. Here, we focus on the intensive margin of trade, which reduces our sample to 18,393 observations.

Table 1
Gravity Regressions – Aggregate Goods Trade in 2017.

                                        Dependent variable: Aggregate Exports

                                        (1)          (2)           (3)               (4)           (5)               (6)               (7)               (8)

  log(SCI)                                           0.646***                                      0.277***                            0.280***          0.284***
                                                     (0.039)                                       (0.022)                             (0.026)           (0.024)
  log(Distance)                                                    −0.992***                       −0.695***         −0.888***         −0.614***
                                                                   (0.060)                         (0.071)           (0.055)           (0.063)
  Common Border                                                                      1.777***                        0.371***          0.367***          0.465***
                                                                                     (0.226)                         (0.114)           (0.101)           (0.094)
  Common Official Language                                                            0.151                           0.055             −0.130            −0.059
                                                                                     (0.147)                         (0.099)           (0.085)           (0.073)
  Common Colonizer                                                                   1.001***                        0.244*            0.058             0.150
                                                                                     (0.156)                         (0.146)           (0.145)           (0.113)
  Colonial Relationship                                                              0.332                           −0.259            −0.262            −0.213
                                                                                     (0.251)                         (0.375)           (0.304)           (0.292)
  Orig. and Dest. Country FE            Y            Y             Y                 Y             Y                 Y                 Y                 Y
  Distance Group Controls                                                                                                                                Y
  R2                                    0.837        0.921         0.935             0.894         0.941             0.937             0.943             0.947
  N                                     27,060       27,060        27,060            27,060        27,060            27,060            27,060            27,060

Note: Table shows results from regression 2, estimated using PPML. The dependent variable is total exports from country i to country j in 2017. Controls include
the logarithm of SCI, the logarithm of distance, a common border dummy, a common official language dummy, a dummy indicating whether the two countries had
a common colonizer post-1945, a dummy indicating whether the pair of countries was in a colonial relationship post-1945. All specifications include fixed effects
for the importer and exporter country. Distance group controls correspond to dummies for percentiles of the distance distribution. Standard errors are clustered by
exporter and importer country. The data include 165 countries and 27,060 (= 165 × 164) observations. Significance levels: *(p
M. Bailey, A. Gupta, S. Hillenbrand et al.                                                                           Journal of International Economics 129 (2021) 103418

Berkowitz et al., 2006; Levchenko, 2007; Nunn, 2007). In the absence of strong institutional enforcement of contracts, Greif (1989,
1993); Rauch (2001); Rauch and Trindade (2002); Combes et al. (2005); Ranjan and Lee (2007), and others have argued that so-
cial linkages and ethnic networks can facilitate trade by providing reputation-based punishment for contract violations. We there-
fore also explore whether the elasticity of trade to social connectedness is larger between trading partners with a weaker rule
of law.
    For these analyses, we use more disaggregated trade data, allowing us to explore heterogeneity across different products. The
unit of observation is exports of product k from country i to country j. A product corresponds to one of 96 unique 2-digit HS96
categories. We estimate the following regression:

         X i; j;k ¼ exp½β1 log SCIi; j þ β2 log SCIi; j  ET k þ β3 log SCIi; j  RLi þ β4 log SCI i; j  RL j þ β5 Gi; j;k   εi; j;k                                 ð3Þ

    ETk is the fraction of exchange traded goods in each 2-digit HS96 product category k.11 RLi and RLj are continuous measures of
the rule of law in the exporting and importing countries, as measured by the World Governance Indicators (Kaufmann et al.,
2011) as of 2017.12 As before, Gi,j,k are a set of gravity variables and fixed effects. All specifications include origin country × prod-
uct and destination country × product fixed effects, allowing us to control for differences in country-specific factor endowments.
Additionally, product-specific distance controls account for the fact that different products have different shipping costs per unit of
distance (see the discussion in Rauch, 1999).
    We present the results from estimating regression 3 in Table 2. Column 1 shows our baseline specification from column 7 of
Table 1 for product-level trade data. The estimated elasticity of trade with respect to social connectedness (as well as the unre-
ported coefficients on the other gravity variables) are very similar to our baseline specification presented in Table 1. In column
2, we interact log(SCIi,j) with the fraction of exchange-traded products in each product category. The coefficient on this interaction
is −0.18, suggesting that social connectedness matters substantially less for trade in product categories that have more exchange-
traded goods. Quantitatively, the elasticity is more than twice as large in a category with no exchange-traded goods than it is in a
category with primarily exchange-traded goods. This finding provides suggestive evidence that one of the channels through which
social connectedness facilitates trade is by decreasing information frictions, which are smaller for exchange-traded goods. In col-
umn 3, rather than using product-specific interactions with log(Distancei,j), we interact 100 dummies for quantiles of distance
with product dummies to allow for a separate non-linear effect of distance on each product's trade. The results are essentially un-
changed in this specification.
    Columns 4 and 5 interact our measures of the rule of law in the destination and origin countries with the social connectedness
across country pairs. Column 4 controls for product-specific effects of log(Distancei,j), and column 5 includes non-linear product-
specific distance controls. In both specifications, we find little variation in the elasticity of trade with respect to the rule of law in
either the origin or destination country. This suggests that the primary channel through which social connectedness as measured
by the Social Connectedness Index influences trade patterns is by mitigating information frictions, with at most a small role played
by reductions in contract enforcement frictions.13

4. Trade and subnational social connectedness in Europe

    In the previous section, we explored the relationship between social connectedness and trade across countries. Our preferred
interpretation of that evidence is that the Social Connectedness Index measures real-world social networks that help facilitate trade
by reducing information frictions. In this section, we further analyze how social connectedness influences trade patterns. To do so,
we exploit the granular nature of the Social Connectedness Index and study trade and connectedness across subnational European
regions. By focusing on Europe, we can zoom in on the patterns of social connections that influence trade in specific products and
relate them to the geographic distribution of production. We conduct two separate analyses along these lines.
    In Section 4.1, we construct product-specific measures of across-country social connectedess. These measures weight the con-
nectedness of subnational region pairs by the importance that these regions should have for predicting exports of each product.
These weights are based on where the good is produced in the exporting country and where it is used as an intermediate input in
the importing country. We show that exports of each product vary primarily with these product-specific input-output-weighted
measures of social connectedness between countries. In other words, what matters for trade in a specific good is not the average

 11
     To construct this measure, we start from trade data at the 6-digit HS96 level, and use the “conservative” classification scheme by Rauch (1999) to classify goods into
“exchange-traded” and “not exchange-traded”; the results are similar using the “liberal” classification. We then calculate the fraction of exchange-traded goods at the 2-
digit HS96 level using the total global share of trade in those goods in each 2-digit category. Across products, ETk ranges from 0 to 0.91, with a mean of 0.12, and a stan-
dard deviation of 0.25. To provide a sense of the variation, within category HS-19 (preparations of cereals, flour, starch or milk such as pastry products), 0% of goods are
exchange-traded; within category HS-27 (mineral fuels, oils, and products of their distillation), 44% are exchange-traded; and within category HS-80 (tin and articles
thereof), 90% are exchange-traded.
 12
     This measure captures “perceptions of the extent to which agents have confidence in and abide by the rules of society, and in particular the quality of contract en-
forcement, property rights, the police, and the courts, as well as the likelihood of crime and violence.” The measure ranges between −2.5 and 2.5. Across countries, it has
a mean of −0.06, and a standard deviation of 0.99. Venezuela has a score of −2.3, Mexico has a score of −0.57, the U.S. has a score of 1.64, and Finland has a score of 2.0.
 13
     In addition to the evidence presented in the main body of the paper, the Appendix explores how being in a similar “social cluster” influences trade over and above
bilateral social connections. Intuitively, sharing a similar social network could also reduce information frictions by decreasing search costs, whereby a common friend in
a third country can pass information between potential trading partners. To study this potential channel, we use a clustering algorithm to group countries into non-
overlapping clusters which each feature a high average within-cluster pairwise social connectedness. We then show that being in the same cluster increases bilateral
trade between countries, over and above their direct pairwise social connectedness as well as standard gravity variables.

                                                                                     9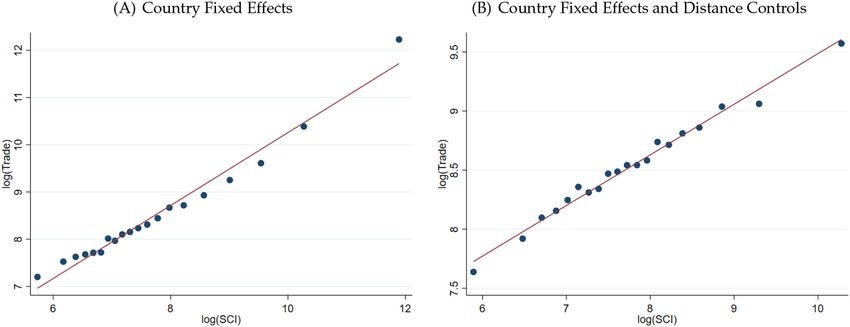
M. Bailey, A. Gupta, S. Hillenbrand et al.                                                                                             Journal of International Economics 129 (2021) 103418

Table 2
Gravity Regressions - Goods Trade Heterogeneity in 2017.

                                                                              Dependent variable: Product-Specific Exports

                                                                              (1)                    (2)                    (3)                       (4)                     (5)

  log(SCI)                                                                    0.275***               0.299***               0.304***                  0.281***                0.287***
                                                                              (0.027)                (0.028)                (0.024)                   (0.031)                 (0.025)
  log(SCI) × Share Exchange-Traded                                                                   −0.179**               −0.148**
                                                                                                     (0.080)                (0.070)
  log(SCI) × Rule of Law Destination                                                                                                                  −0.014                  −0.010
                                                                                                                                                      (0.021)                 (0.019)
  log(SCI) × Rule of Law Origin                                                                                                                       0.000                   0.005
                                                                                                                                                      (0.019)                 (0.015)
  Origin Country × Product FE                                                 Y                      Y                      Y                         Y                       Y
  Destination Country × Product FE                                            Y                      Y                      Y                         Y                       Y
  Other Gravity Controls                                                      Y                      Y                      Y                         Y                       Y
  log(Distance) × Product FE                                                  Y                      Y                                                Y
  Distance Group × Product FE                                                                                               Y                                                 Y
  R2                                                                          0.932                  0.933                  0.946                     0.932                   0.946
  N                                                                           2,597,760              2,597,760              2,597,760                 2,597,760               2,597,760
  N - Explained by FE                                                         334,186                334,186                334,186                   405,093                 405,093

Note: Table shows results from regression 3. The dependent variable is exports of product category k from country i to country j in 2017. Product-level trade data
are aggregated up to the first 2 digits of the HS96 product classification. Other gravity controls include a common border dummy, a common official language
dummy, a dummy indicating whether the two countries had a common colonizer post-1945, and a dummy indicating whether the pair of countries was in a co-
lonial relationship post-1945. We also separately control for the logarithm of distance interacted with product categories in columns 1, 2, 4 and for distance groups
(dummies for percentiles of the distance distribution) interacted with product categories in columns 3 and 5. Share Exchange-Traded refers to the proportion of
exchange-traded products—based on the conservative classification scheme in Rauch (1999)—within a product category. Rule of law is obtained from the World
Governance Indicators published by the World Bank. All specifications include fixed effects for the importer and exporter country interacted with product catego-
ries. Standard errors are clustered by exporter and importer country. The data include 165 countries and 96 product categories, which amounts to 2,597,760
observations. Observations that are fully explained by the fixed effects are dropped before the PPML estimation. Significance levels: *(p
M. Bailey, A. Gupta, S. Hillenbrand et al. Journal of International Economics 129 (2021) 103418
In other words, when previously exploring the role of SCIi,j as a determinant of trade between two countries, we implicitly im-
posed that the relative importance of the connectedness between different regions in explaining country-level trade increased
with the population shares of those regions.
In this section, we propose that, for each good, the connectedness between the regions in country i where the good is pro-
duced and the regions in country j where the good is used might be particularly important for explaining exports of that good
from country i to country j, in particular if these connections help mitigate information frictions. Our prediction that the social
connections of individuals at the location of firms should matter disproportionately for predicting trade flows builds on the in-
sights from a large literature that has documented that the vast majority of international trade is being conducted by a small
set of firms (see Bernard et al., 2012, for a survey of this literature).
We find that the relative importance of regions in the production of goods often deviates substantially from their population
weights, in particular for goods that are used as intermediate inputs in geographically clustered industries. Let us give a concrete
example. More than 80% of Italian exports of non-metallic mineral products (e.g., cement) to Greece are used as inputs in the
Greek construction sector. Panel A of Fig. 3 shows the share of Italian employment in the sector that manufactures non-
metallic mineral products in each of the country's NUTS2 regions. The largest share is in the northwestern Piedmont region,
which includes the city of Torino. Similarly, Panel B of Fig. 3 shows the share of Greek employment in the construction sector
for each of the country's NUTS2 regions. The largest employment shares are in the Attica region covering metropolitan Athens.
Based on this information, we propose that for exporting non-metallic mineral products from Italy to Greece, the connectedness
between the Piedmont region and the Attica region should be particularly important, since firms located in those regions are most
likely to be involved in any trade in this product. The bottom row of Fig. 3 shows that there is substantial variation in which re-
gions in Italy are connected to the Attica region in Greece (Panel C), and which regions in Greece are connected to the Piedmont
region in Italy (Panel D). These figures highlight that the strongest social connections are not necessarily between the regions
with firms that should matter most for the trading of non-metallic mineral products.
We next test whether it is indeed the connections of those regions with firms most likely involved in trading a particular prod-
uct that matter the most for explaining country-level trade in that product. To conduct this exercise, we construct, for each ex-
porter i × importer j × product p triplet, the input-output-weighted social connectedness of regions in countries i and j that
should be most important for predicting trade of product p. This construction involves a number of steps. First, since the trade
data is at the product level, while the employment and input-output data is at the industry level, we match products in the
trade data to industries (see Appendix C.1 for details). Accordingly, we will interchangeably refer to p as representing a product
or an industry. For each product p produced in country i, we then use the World Input-Output Tables (WIOT) described in
Timmer et al. (2015) to measure the share of that product that is used as an intermediate input in each industry p′ in country
j, IO p, p′ p, p′
i, j . We focus on uses of products as intermediate inputs, such that ∑p′IO i, j = 1, and only consider products where at
least 50% of the exports across countries in our sample are used as intermediate inputs (rather than in final consumption).
This leaves us with a set P that includes 20 products, which we list in Appendix C.1. For each product p ∈ P, we then construct
a measure of the social connectedness between countries i and j, SCIpi,j, that corresponds to the input-output-weighted average
of the social connectedness between the NUTS2 regions in these countries that are most relevant for exporting product p
from i to j:
" !#
p p,p0
SCIi,j ¼ ∑ EmpSharep,ri ∑ IOi,j ∑ EmpSharep0 ,rj SCIri ,rj ð5Þ
r i ∈RðiÞ p0 ∈P r j ∈Rð jÞ
The variable EmpSharep,ri represents the share of employment in industry p in country i that is in region ri: ∑ri∈R(i)EmpSharep,ri = 1.
These regional employment shares are constructed using data from Eurostat. We focus our analysis on 28 countries for which we have
trade data, WIOT data, and regional employment data; these countries are reported in Appendix C.1.
Similarly, we construct a product-specific measure of the input-output-weighted geographic distance between each country,
again under the maintained hypothesis that the geographic distance that should matter the most for exports in each country-
pair-product is the distance between those regions where the product would be produced and used:
" !#
p p,p0
Distancei,j ¼ ∑ EmpSharep,ri ∑ IOi,j ∑ EmpSharep0 ,rj Distanceri ,rj ð6Þ
r i ∈RðiÞ p0 ∈P rj ∈Rð jÞ
Quantitatively, most of the cross-sectional variation in SCI pi,j and Distance pi,j comes from a common component that drives the
social connectedness and geographic distance between all regions in a given country pair. For example, all regions of Germany are
p
more connected to regions in Austria than they are to regions in Finland. Indeed, regressions of SCIi,j and Distancepi,j on country i ×
2
country j fixed effects have R s above 90%. The remaining variation comes from the fact that, for some products, the producing or
using industries are geographically concentrated in regions that might be differentially connected than the average region in a
country pair. These differences provide the identifying variation in the following analyses.
11M. Bailey, A. Gupta, S. Hillenbrand et al. Journal of International Economics 129 (2021) 103418
Fig. 3. Regional Employment Shares And Social Connectedness. Note: Panel A plots the regional shares of employment in the non-metallic minerals industry across
NUTS2 regions in Italy. Panel B plots the regional shares of employment in the construction sector across NUTS2 regions in Greece. Panels C and D, respectively,
show heat maps of social connectedness from the Attica Region in Greece to Italian NUTS2 regions, and from the Piedmont Region in Italy to Greek NUTS2 regions.
p
We then explore how trade in different products correlates with the product-specific measures of social connectedness, SCI i,j,
p
and geographic distance, Distance i,j, by estimating the following regression:
h i
p p
X i,j,p ¼ exp β1 log SCI i,j þ β2 log Distancei,j þ β3 log SCIi,j þ β4 log Distancei,j þ δi,j,p ⋅εi,j,p ð7Þ
Here, Xi,j,p denotes the total value of exports of product p from country i to country j. We also include the logarithm of
population-weighted measures of social connectedness and distance as controls; these are the same covariates that we used in
Section 2. The vector δi,j,p represents various fixed effects. In all specifications we add country i × product p fixed effects as
well as country j × product p fixed effects, which controls for the average propensity of each country to export and import
each good.
Table 3 shows results from regression 7. In column 1, we control only for the population-weighted social connectedness and
distance. The estimated elasticity of trade to social connectedness is similar to that estimated in Section 2. This suggests that the
set of countries and products for which we can construct input-output-weighted social connectedness has similar trade elasticities
to the full sample of countries. In column 2, we instead control for the product-specific input-output-weighted social connected-
ness between countries i and j. The magnitudes of the trade elasticities are similar to those in column 1. As discussed above, this is
consistent with the fact that much of the regional variation in social connectedness is explained by a component that is common
for all region pairs in a country pair.
12You can also read