Feasibility of Water Quality Monitoring by Remote Sensing in the Waikato Region - University of Waikato
←
→
Page content transcription
If your browser does not render page correctly, please read the page content below
ISSN 2463-6029 (Print)
                                                                 ISSN 2350-3432 (Online)

Feasibility of Water Quality Monitoring by
  Remote Sensing in the Waikato Region

                                 2017
                         ERI report number 87
Client report prepared for Waikato Regional Council by The University of
               Waikato, Environmental Research Institute

        Moritz K. Lehmann, Lena A. Schallenberg and Mat Allan
                      Environmental Research Institute
                    University of Waikato, Private Bag 3105
                         Hamilton 3240, New Zealand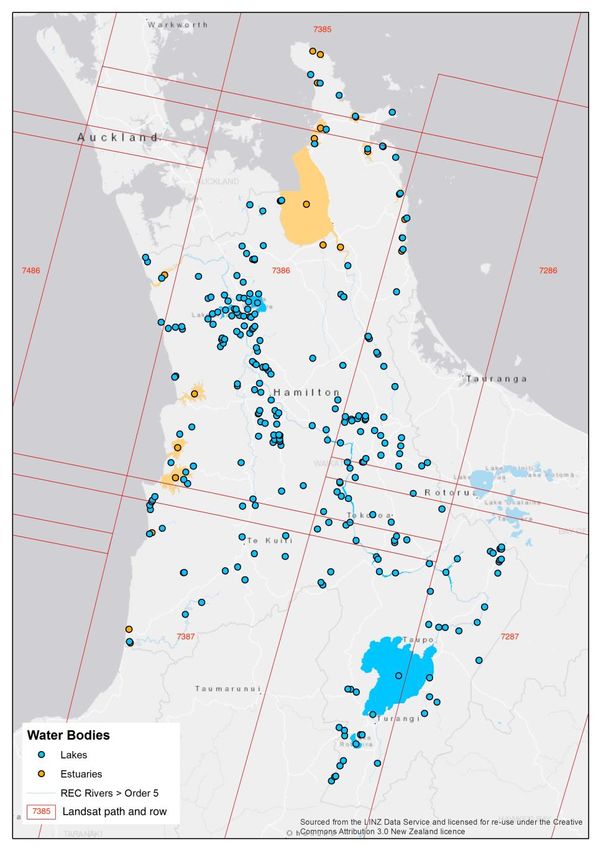
Reviewed by:                                        Approved for Release by:

Ian Hawes                                           John Tyrrell

University of Waikato                               University of Waikato

Cover image: Locations of lakes in the Waikato Region. Colour coding
indicates the average number of observations per year derived from the
Landsat 8 archive.

                                                2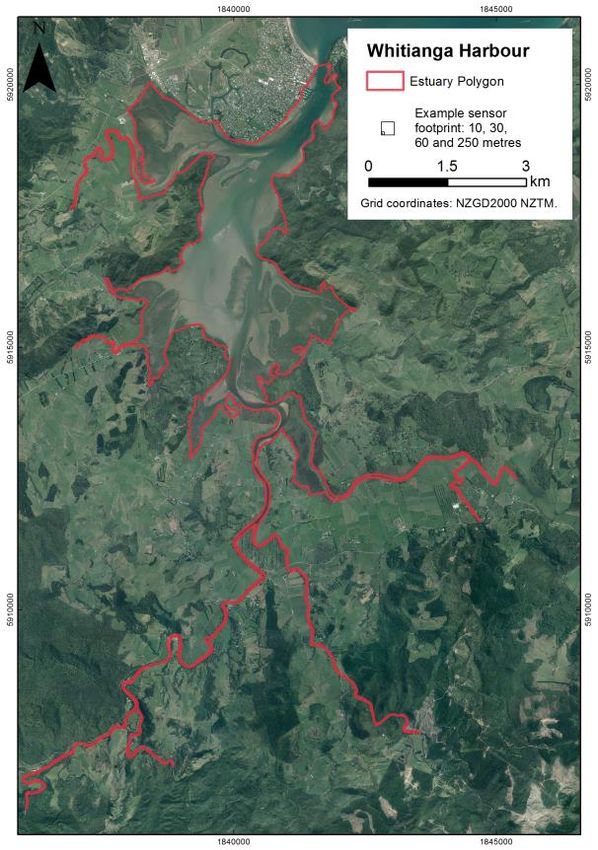
Feasibility of Water Quality Monitoring by Remote Sensing in the Waikato Region

        Executive Summary
        The Waikato Regional Council (WRC) has statutory environmental monitoring requirements,
        including commitments arising from the National Policy Statement for Freshwater Management and
        State of the Environment reporting. Lakes, large rivers and estuaries pose a challenge for water
        quality monitoring programs due to their size, number and accessibility. To meet the increasing
        demand for more comprehensive monitoring to facilitate evidence-based regional policy making,
        cost-effective monitoring tools capable of capturing multiple attributes at various temporal and
        spatial scales are desirable.

        Earth observation satellites currently collect complete imagery of New Zealand every 1 to 16 days
        and the data is freely available to download. Potentially, all water bodies which have at least a 90 by
        90 m area of open water can be resolved from space and algorithms exist to convert the data to
        parameters related to water quality. This technology potentially provides an opportunity for
        supplementary monitoring of selected water quality-related variables at a greater frequency and
        spatial resolution and coverage than is currently available for the Waikato region’s lakes, large rivers
        and estuaries. The University of Waikato was commissioned by the Waikato Regional Council to
        prepare this report to help WRC evaluate whether this opportunity is worthwhile pursuing through
        the implementation of a system for the routine monitoring of water quality using remote sensing.

        This report summarises background information and reviews literature pertinent to the use of
        remote sensing for water quality monitoring. Water quality monitoring using satellite imagery is
        principally based on the measurement of the colour of water and the derivation of attributes
        through their respective contribution to the spectral light field. Attributes which can be derived
        include chlorophyll a, suspended sediments, coloured dissolved organic matter, Secchi depth and
        turbidity. Currently, Landsat-8, Sentinel-2a and Sentinel-3a are the most suitable satellite platforms
        to provide this data. Their data products are provided at sensor-specific resolutions, i.e., the sensor
        footprint (spatial resolution), number of wave bands (spectral resolution) and frequency of
        overpasses (temporal resolution). Table E1 summarises the properties of the most relevant remote

        Table E1: Current and future satellite sensors feasible for use in inland water quality retrieval. The suitability of
        each sensor for the retrieval of individual constituents is suggested, along with the minimum water body size
        (Adapted from: Dekker & Hestir 2012).
                                           Spectral                                                                  Minimum
                Spatial        Repeat                                         Water Quality Variables
                                            Bands     Lifespan                                                        water
Satellite      Resolution       Cycle
                                          (400-1000    (years)                                                       body size
                  (m)          (days)                             Chl a    TSS     PC    CDOM       SD     TURB
                                             nm)                                                                       (ha)
                                                       1999-
Landsat 7          30            16          4                                                                           1
                                                       2004+
                   15            16         Pan*
                                                       2013-
Landsat 8                                                                                                                1
                                                       2023+
                   30            16          5

                   10            10          4
Sentinel-2                                             2015-
                                  5                                                                                     0.5
A&B                                                    2023+
                   20          (with B)      4
                                                      A: 2016-
Sentinel-3                       1-2                   2025+
                  300                        21                                                                         10
A&B                            (with B)               B: 2017 -
                                                        2025
             Highly Suitable              Suitable           Potential             Not Suitable
        Chl a: Chlorophyll a, TSS: Total suspended solids, PC: Particulate carbon, CDOM: Coloured dissolved
        organic matter, SD: Secchi depth, TURB: Turbidity.
        *Pan: one single band (panchromatic band 8, 500-680 nm)

                                                                  3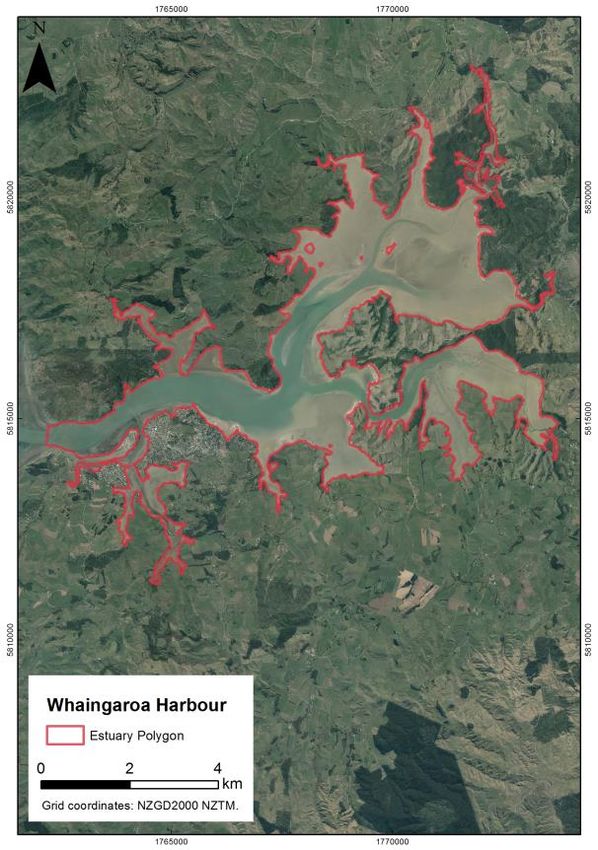
Feasibility of Water Quality Monitoring by Remote Sensing in the Waikato Region

    sensing platforms and their suitability for water quality attribute detection. Improvements in
    relevant earth observations are anticipated as Sentinel-2b (launched 7 March 2017) becomes
    operational, Sentinel-3b is to be launched (scheduled for 2017) and a hyperspectral mission is being
    planned (HyspIRI anticipated launch in 2021).

    This report also includes several regional case studies of lakes where remote sensing has been
    applied for the determination of water quality. These case studies provide quantitative insights into
    the accuracy of water quality algorithms and their applicability across the range of lakes of the
    Waikato region. Examples of remote sensing of water quality in rivers and estuaries come from the
    international scientific literature and often deal with larger systems which are easier to detect
    remotely than comparatively smaller Waikato waters. The case studies discussed in this report are
    summarised in Table E2.

    Table E2: Summary of case studies discussed in this report.

                                                                                                            Water body
Reference         Sensor           Parameter        Coefficient of determination (r2)     Location
                                                                                                            Type

                                                     0.83 (N = 13, 0.8 - 136 µg L-1)
                  Landsat 7 ETM+   Log-Chl a                                              Rotorua Lakes     Lakes
                                                     0.91 (N = 16, 0.4 – 89.1 µg L-1)

Allan (2008)      Landsat 7 ETM+   Log-Chl a           0.84 (N = 6, 9 – 135 µg L-1)
                                                                                                            Lakes
                                                                                          Waikato Lakes
                  Landsat 7
                                   TSS                0.98 (N = 15, 0 – 350 mg L-1)
                  ETM+
                  Landsat 7                                                               Rotorua Lakes,
Allan (2011)                       Log-Chl a          0.80 (N = 33, 0.8 – 136 µg L-1)                       Lakes
                  ETM+                                                                    Lake Taupo

                                   TSS                0.94 (N = 35, 0 – 962 mg L-1)

Hicks et al.                                          0.92 (N = 36, 1.25 – 399 NTU)
                                   Turbidity                                              Waikato Lakes     Lakes
(2013)

                                   Log-SD             0.67 (N = 32, 0.005 – 3.78 m)

                                                      0.73 (N = 9, 50 – 400 mg L-1)‡
Allan (2014)      MODIS            Tripton*                                               Lake Ellesmere    Lake
                                                      0.72 (N = 9, 50 – 400 mg    L-1)‡

                                                     0.68 (N = 87, 0.1 – 136 µg L-1)‡
Allan et al.
                  Landsat 7 ETM+   Chl a                                                  Rotorua Lakes     Lakes
(2015)
                                                     0.58 (N = 87, 0.1 – 136 µg L-1)‡

                  Landsat 7                                                               Tributaries to
Zhao et al.
                  Panchromatic     Log-SD             0.64 (N = 51, 0.09 – 0.90 m)‡       Lake Taihu,       Rivers
(2011 & 2014)
                  Band                                                                    China
                  MODIS, Landsat
Schwarz et al.                                                                            Canterbury
                  7ETM+,           Chl a, calcite            Not determined                                 Rivers
(2010)                                                                                    Rivers
                  SeaWiFS
                  Airborne         Log-Chl a,         0.86 (N = 21, 8 – 380 µg L-1)‡‡
Olmanson et al.                                                                           Mississippi and
                  hyperspectral    Log-TSS            0.84 (N = 21, 2 – 95 mg L-1)‡‡                        Rivers
(2013)                                                                                    Minnesota River
                  sensors          Log-Turbidity       0.86(N = 21, 2 – 50 NTU)‡‡
                                   CWQI
Akbar et al.                       categories**                                           Bow River,
                  Landsat 5 TM                             0.91 (N = 31, 2 – 4)                             Rivers
(2013)                             Turbidity                                              Canada
                                   classes

                                                           4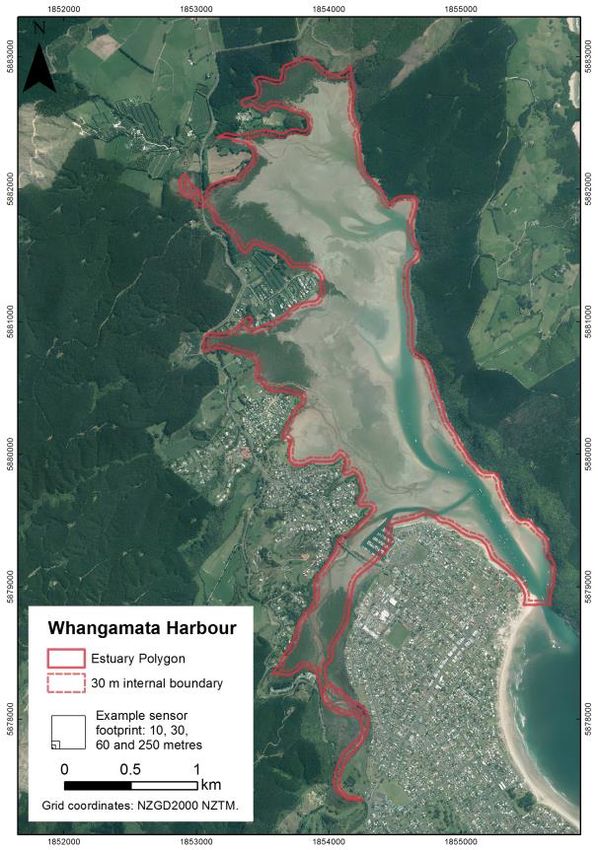
Feasibility of Water Quality Monitoring by Remote Sensing in the Waikato Region
Water body
Reference Sensor Parameter Coefficient of determination (r2) Location
Type
Neuse and Tar-
Keith et al.
MERIS Chl a 0.87 (N = 120, 1 – 122 µg L-1)‡ Pamlico Estuaries
(2014)
Estuaries, USA
Doxaran et al. MODIS Terra 0.77 (N = 59, 10 – 2200 g m-3)‡ Gironde
SPM Estuary
(2009) MODIS Aqua 0.82 (N = 59, 10 – 2200 g m-3)‡ Estuary, France
RMSE = 0.86 µg L-1 (spring,
Shen et al. N = 57, 0.01 – 3 µg L-1) Yangtze
MERIS Chl a Estuary
(2010) RMSE = 2.87 µg L-1 (summer, Estuary, China
N = 31, 1 – 31 µg L-1)
Chl a: chlorophyll a, TSS: Total suspended solids, SD: Secchi depth, SPM: Suspended particulate matter, N: number
of samples, RMSE: Root mean square error.
*Tripton includes sand, silt, clay and other inorganic material such as atmospheric dust as well as non-living organic
matter
**Canadian Water Quality Index
‡
Range of values read from graphs in the reference
‡‡
Values shown are averages calculated from Table 2 in Olmanson et al. (2013)
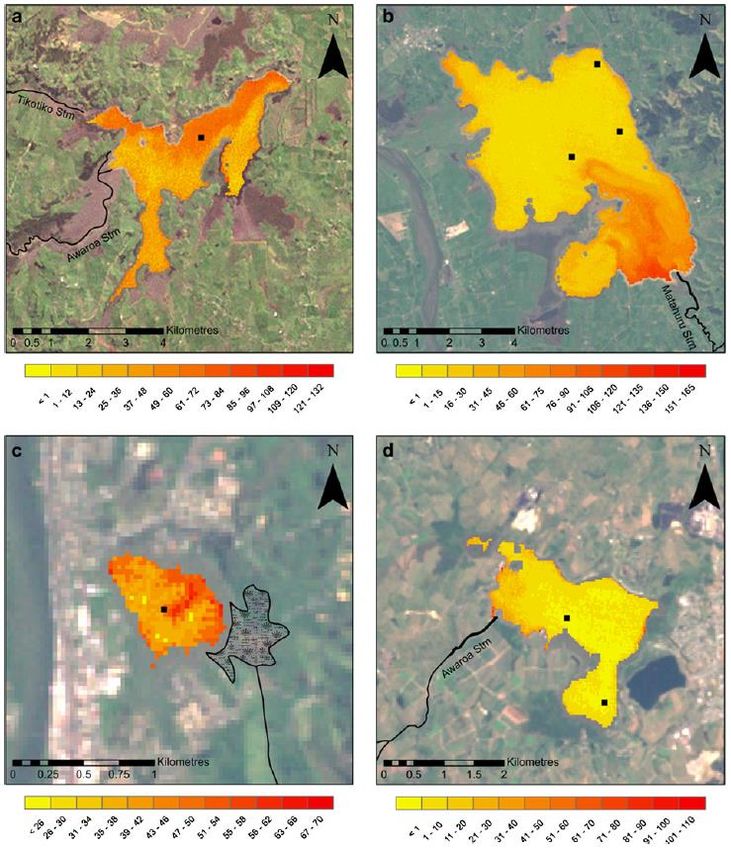
In principle, a water body is suitable for remote sensing if the surface area is large enough to include
water-only pixels and deep enough to preclude interference from bottom reflection. In practice, it
also depends on the prevalence of clouds and the frequency of overpasses of the satellite. Almost all
named lakes in the Waikato have been observed on average 25% of the time by Landsat 8, which
equates to approximately six successful retrievals per lake, per year given its 16 day return time. The
success rate appears to be largely due to cloud cover. Seasonality of visibility has not been assessed,
but the limitations imposed by cloud cover suggest that Landsat 8 imagery may be best viewed as an
adjunct to ongoing monitoring, by allowing selected variables to be monitored at more locations.
Fifty-seven percent of the lakes (137) are also large enough to yield more than three pixels,
potentially allowing spatial variability to be addressed.
A major limitation to observing rivers by remote sensing is the channel width relative to the
resolution of the sensor. After the river banks are masked to reduce contamination of the signal by
littoral effects, such as river bed reflectance and macrophytes, the visible image width is required to
be at least one pixel, e.g., 10, 30 or 60 m. Only the Waikato River exceeds 30 m of width over much
of its length and is therefore theoretically visible by Landsat sensors. The Waihou River also exceeds
30 m over some of its lower reach after buffering and both rivers exceed 60 m buffered width in
some parts of their reach. The Waipa River is only visible with 10 m resolution sensors such as that
of Sentinel-2 satellite. The lack of regional case studies means that this report cannot predict the
accuracy of remotely sensed river water quality.
There are many estuaries in the Waikato region varying across a wide range of sizes. In addition to
the constraints on visibility of lakes, estuaries are highly dynamic systems where tides and other
coastal processes modify bathymetry, water depth and water clarity over a range of temporal and
spatial scales. Visibility statistics for 23 of the larger (> 100 ha) estuaries show that on average 21%
of Landsat overpasses yield data which may be used for water quality studies, equivalent to 5 times
per year. The science of remote sensing of estuaries is less well developed than for lakes, and
limitations to the quality of the data due to factors such as bottom reflectance and wave breaking
must also be considered.
The hardware, software and human resources required to design and implement a system for the
retrieval and processing of satellite data to generate water quality reports are considered. We note
that:
Remotely sensed data is freely available;
5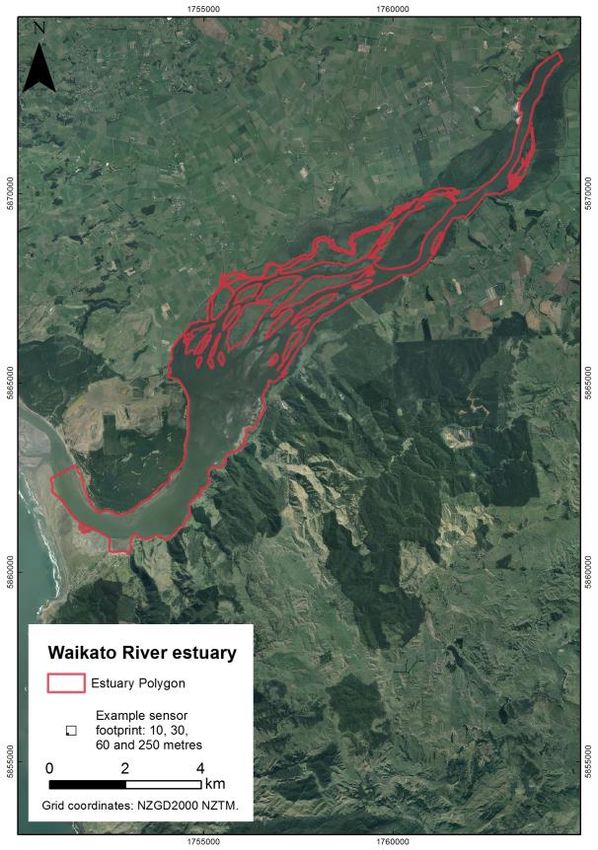
Feasibility of Water Quality Monitoring by Remote Sensing in the Waikato Region
Several free processing tools exist in the public domain;
Some commercial software is already in use at WRC;
No specialist hardware is needed; and
The requirement for advanced technical expertise is easily outsourced.
We estimate that a single hardware system and 71 days of effort by a range of technical staff is
sufficient to implement water quality monitoring by remote sensing, with 10 days of technical effort
per month to maintain and operate thereafter.
The final chapter of this report synthesizes the technical information by way of a decision support
framework, enabling managers to determine the feasibility of a remote sensing water quality
monitoring system. This decision support framework is divided into three phases:
1. Initial scoping and investigation;
2. Planning; and
3. Implementation.
Each decision in the framework allows for compromises, i.e., by reconsidering the data requirements
to improve feasibility, and suggests alternative monitoring methodologies to remote sensing. Finally,
the framework prescribes a long-term review process for formal re-evaluation of the system,
including whether it meets the operational goals and if it should be implemented. An example
pathway of the decision support framework is presented.
6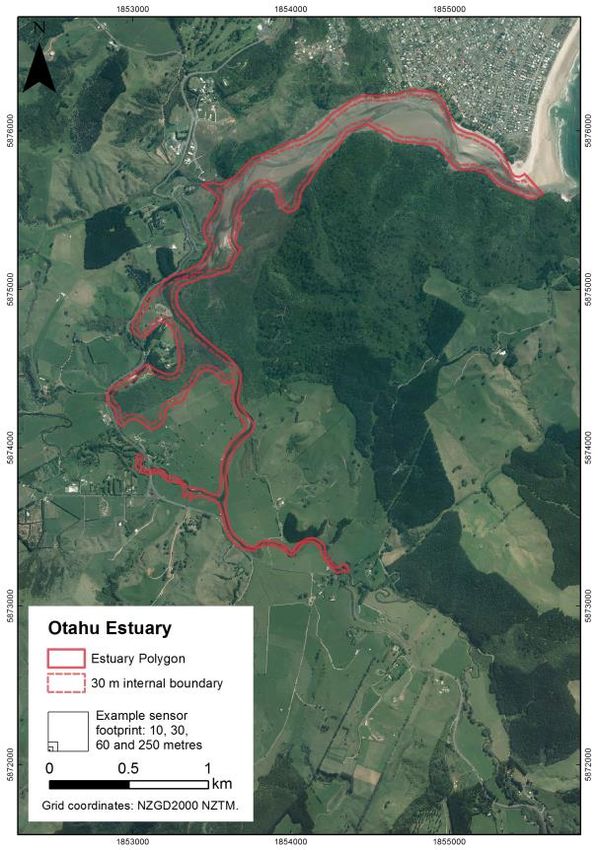
Feasibility of Water Quality Monitoring by Remote Sensing in the Waikato Region

Acknowledgements
This project was commissioned by the Waikato Regional Council and special thanks are due to Deniz
Özkundakci and Michael Pingram for valuable discussions and input. The help of Glen Stichbury,
Brendan Hicks, Julia King and David Hamilton during various stages of the project is greatly
appreciated. Some analyses presented in this report were made possible through funding by MBIE
Grant UOW 1503 (Enhancing the Health and Resilience of New Zealand Lakes).

                                                7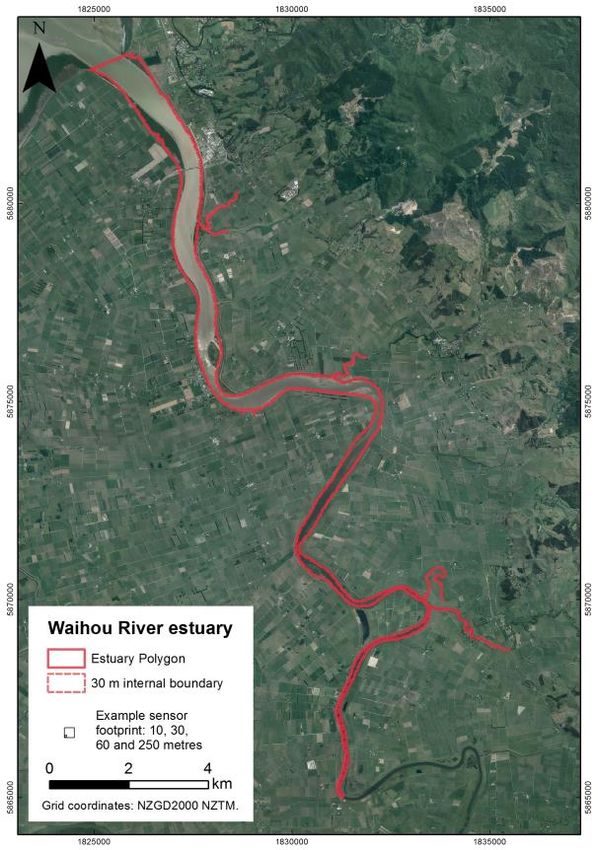
Feasibility of Water Quality Monitoring by Remote Sensing in the Waikato Region

Table of Contents
Executive Summary ........................................................................................................................ 3
Acknowledgements ........................................................................................................................ 7
Introduction .................................................................................................................................... 10
Review ............................................................................................................................................... 12
The Challenges of Water Quality Monitoring and the Remote Sensing Opportunity .......................... 12
The Fundamentals of Remote Sensing for Water Quality .................................................................... 12
The Current State of Satellite Remote Sensing of Inland Water Quality Parameters .......................... 15
  Characteristics of Current Satellite Sensors ...................................................................................... 16
  Other Sensor Platforms ..................................................................................................................... 19
Observable Water Quality Constituents ............................................................................................... 20
  Chlorophyll a and Phycocyanin ......................................................................................................... 21
  Coloured Dissolved Organic Matter (CDOM) .................................................................................... 22
  Total Suspended Solids (TSS) ............................................................................................................. 22
  Turbidity ............................................................................................................................................ 22
  Secchi Depth ...................................................................................................................................... 22
Retrieval of Water Quality Constituents ............................................................................................... 23
Retrieval Algorithms ............................................................................................................................. 24
  Empirical Algorithms ......................................................................................................................... 25
  Semi-Analytical Algorithms ............................................................................................................... 26
Case Studies .......................................................................................................................................... 27
  Lakes ................................................................................................................................................. 31
  Rivers ................................................................................................................................................. 38
  Estuaries ............................................................................................................................................ 41
Regional Context Analysis .......................................................................................................... 44
Lakes ..................................................................................................................................................... 45
Rivers..................................................................................................................................................... 48
Estuaries ................................................................................................................................................ 50
Optically Active Constituents in Waikato Waters ................................................................................. 51
Implementation Pathway ........................................................................................................... 54
Processing Work Flow ........................................................................................................................... 54
  Download Options............................................................................................................................. 56
  Processing Options ............................................................................................................................ 56
Computer System Requirements .......................................................................................................... 57
Backup and Data Retaining Options ..................................................................................................... 57
Level of Effort ........................................................................................................................................ 58
Summary ............................................................................................................................................... 59
Synthesis and Conclusion ........................................................................................................... 61
Conclusion ............................................................................................................................................. 62
References ....................................................................................................................................... 64
Appendix A: Retrieval Algorithms........................................................................................... 68
Chlorophyll a ......................................................................................................................................... 68
Total suspended solids .......................................................................................................................... 69
Secchi depth .......................................................................................................................................... 70
Turbidity ................................................................................................................................................ 70
Coloured dissolved organic matter ....................................................................................................... 70

                                                                              8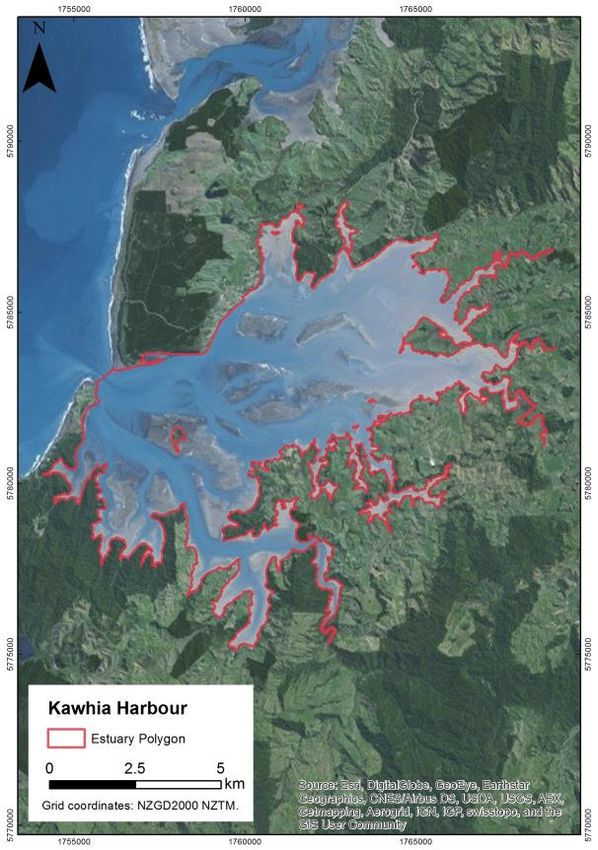
Feasibility of Water Quality Monitoring by Remote Sensing in the Waikato Region

Appendix B: Visibility Statistics for Waikato Lakes .......................................................... 71
Appendix C: Estuary Maps .......................................................................................................... 81

                                                                  9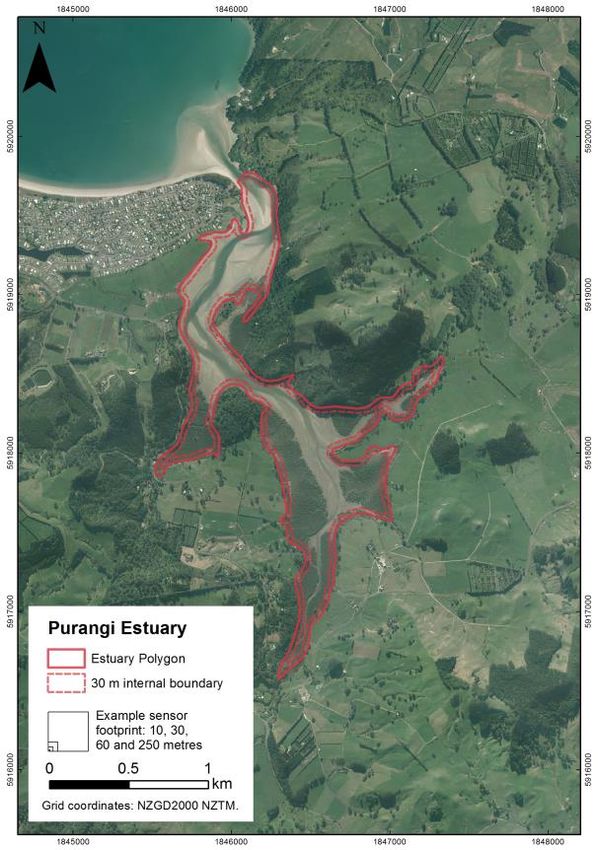
Feasibility of Water Quality Monitoring by Remote Sensing in the Waikato Region
Introduction
The Waikato Regional Council (WRC) has statutory environmental monitoring requirements,
including commitments arising from the National Policy Statement for Freshwater Management
(NPS-FM, MfE 2015) and State of the Environment (SOE) reporting. Lakes, large rivers and estuaries
pose a challenge for monitoring programs due to their size, number and accessibility. To meet an
increasing demand for more comprehensive monitoring, for example, for evidence-based regional
policy making, cost-effective tools that are capable of capturing multiple attributes at various
temporal and spatial scales are desirable.
Remote sensing by satellite-borne sensors has the potential to address part of this challenge by
autonomously collecting environmental data at synoptic space and time scales (Alikas et al. 2015).
The University of Waikato was commissioned by the Waikato Regional Council to help WRC evaluate
whether water quality monitoring using remote sensing is feasible.
The feasibility of using remote sensing for the routine monitoring of water quality of lakes, large
rivers and estuaries from a scientific and technical stand point depends on the responses to two
basic questions:
What water-quality related parameters are amenable to remote sensing?
Does remote sensing currently provide estimates of these water quality parameters to a
satisfactory accuracy?
If not, how much more research and development is required to allow retrieval to be
sufficiently accurate to meet required standards
Can satellites observe a sufficient number of water bodies often and regularly enough to be
useful?
Does the potential data return justify the cost of investment into remote sensing
technology?
Decision making in this context is a sequential one, and in this report we focus on the technical
issues related to the suitability of remote sensing to deliver data that will add to the monitoring
programmes currently in place. We then provide guidance for the implementation of a system to use
remote sensing for monitoring. It will furthermore discuss whether parameters derived from remote
sensing can fulfil the requirements of overarching national regulations, such as the Resource
Management Act (RMA) and National Policy Statement for Freshwater Management.
This report begins by summarising background information and reviewing literature pertinent to the
use of remote sensing for water quality monitoring. It outlines the current satellite and sensor
technologies, define the water quality parameters which are observable using remote sensing
platforms and reviews which sensors are most suitable for the retrieval of individual parameters
from lakes, rivers and estuaries at a regional scale. We also describe different algorithms used to
estimate water quality parameters from satellite imagery in terms of their error and validation
statistics. The review concludes with case studies of remote sensing applications to water quality
parameters in lakes, rivers and estuaries both in New Zealand and internationally if no local
applications exist, with particular attention given to studies using smaller water bodies similar to
those in the Waikato region. These case studies illustrate the levels of accuracy remote sensing
currently provides for estimates of water quality parameters. We note that our review is restricted
to remote sensing products which are freely available. A number of commercial satellite services and
companies offer operational water quality monitoring, but these are not considered here as their
retrieval algorithms are often proprietary and not publicly documented and their data products are
unlikely to be validated for New Zealand and the Waikato.
10Feasibility of Water Quality Monitoring by Remote Sensing in the Waikato Region
The section Regional Context Analysis presents the results of a spatial analysis on the size and shape
of Waikato’s lakes, rivers and estuaries to address the second question above regarding how many
water bodies can be seen from space. It also reviews the current state of knowledge of optical
variability in Waikato water bodies which is central to the performance of the retrieval algorithms.
The third section, Implementation Pathway, provides practical detail to help estimate the effort and
cost associated with the implementation and operation of a system for water quality monitoring
using freely available satellite data.
11Feasibility of Water Quality Monitoring by Remote Sensing in the Waikato Region
Review
This section describes the challenges of monitoring water quality at the regional level and outlines
where remote sensing may provide opportunities to support monitoring programs. We present not a
comprehensive literature review, but extend our previous work (e.g., Allan et al. 2015; Hicks et al.
2013) with new references and in-depth descriptions of pertinent details found by following the
chains of citations and targeted literature searches using Google Scholar.
The Challenges of Water Quality Monitoring and the Remote Sensing Opportunity
The Waikato region contains 240 standing water bodies (lakes1) larger than 1 ha in surface area
(FENZ geo-database, Leathwick 2010), approximately 1,800 km of rivers of order 5 or higher (M.
Pingram, pers. comm.) and approximately 23 estuaries larger than 100 ha in surface area (H. Jones,
pers. comm.). Conventional monitoring provides bimonthly, seasonal or annual sampling at best
from a fraction of Waikato’s surface water resources (Table 1). Sampling from such monitoring has
limitations for detecting tends in water quality and important ecological processes occurring at
weekly and monthly time scales. Remote sensing satellites have return periods of days to weeks and
can potentially yield higher frequency observations.
Table 1: Summary of current water quality monitoring programs for lakes, large rivers and estuaries by the
Waikato Regional Council.
Lakes Every two months from eight shallow lakes (going back over a decade);
Between 30 to 40 shallow lakes are sampled seasonally or annually;
Autonomous high-frequency monitoring instrumentation has been installed in
four Waikato lakes (Ngaroto, Waahi, Whangape and Waikare).
No water quality information is available for 50% of the region’s shallow lakes.
Large rivers Monthly monitoring of approximately 100 lotic systems spread across the
region (10 sites on the main stem of the Waikato);
Estuaries Coastal water quality monitoring has focused on snapshot surveys of a
number of estuaries (data is published on WRC website);
Coastal water quality monitoring programmes, including the installation of
water quality monitoring buoys, are currently under development.
In contrast to conventional sampling methods, remote sensing offers views of the surface of water
bodies theoretically at daily to weekly intervals and spatial resolutions superior to all but the most
intense boat-based sampling grids, at comparatively small cost (Allan et al. 2015; Hicks et al. 2013).
As a result, remote sensing technologies have been applied to a number of inland water quality
studies across lakes, rivers and estuaries world-wide (see Section Case Studies). Continuous
developments in satellite and sensor technologies and research into parameter retrieval algorithms
are likely to increase the use of remote sensing methods for water quality monitoring (Dekker &
Hestir 2012; Matthews 2011; Palmer et al. 2015).
The Fundamentals of Remote Sensing for Water Quality
Light travelling through a medium such as air or water can be absorbed, reflected and scattered, and
the degree to which this happens depends on the optical properties of the transmitting medium
(Figure 1)(Kirk 1994). Some parameters related to water quality have optical properties which
change the nature of the underwater light field by scattering, absorption and reflection (Mobley
1
While these standing water bodies may not be lakes by definition (pers. comm. D. Ozkundakci), the term
“lake” is used in this report to for these water bodies for convenience.
12Feasibility of Water Quality Monitoring by Remote Sensing in the Waikato Region
1994). Satellites can measure the spectral composition of the light leaving the water providing an
opportunity to back-calculate the concentrations of some water quality parameters (Seyhan &
Dekker 1986).
Figure 1: Relationship between constituents of water which attenuate light and various optical properties
(After Vant & Davies-Colley 1984).
Several instances of absorption, reflection and scattering processes have to be taken into account
when measuring light at altitude for the purpose of surface water assessment. First, light from the
sun is both absorbed and scattered by the atmosphere, reaching the water surface as a mixture of
direct sunlight and diffuse light scattered by the atmosphere (Olmanson et al. 2015). The water
surface then reflects and refracts the downwelling irradiance, allowing a portion of light to penetrate
the water column where it is further absorbed and scattered by water molecules and substances
within the water (Kirk 1994) (Figure 2). Substances that alter the underwater light field are known as
optically active constituents (OACs) and include the pigments of algal cells such as chlorophyll a (Chl
a) and phycocyanin, suspended solids (both mineral and organic) and coloured dissolved organic
matter (CDOM) which all scatter and absorb light at characteristic wavelengths (Dekker & Hestir
2012). Some of the light entering the water will be scattered and refracted such that it is directed
upwards to leave the water with a spectral signature determined by the OACs of the water. Remote
sensing platforms measure radiance reflectance, which is the ratio of water-leaving radiance over
incoming solar irradiance. The normalization of upwelling radiance to downwelling irradiance
accounts for variations in the intensity and spectral shape of the incoming solar radiation. It is
important to note that all light related quantities are calculated across a range of wavelengths, the
spectral band, which are specific to the design of the sensor.
The predominance of light at a particular wavelength is perceived by the human eye as colour. For
example, chlorophyll a absorbs light throughout the visible wavelengths, except near 665 nm, which
is the green part of the visible light spectrum; therefore, the ‘greenness’ of water can be related to
the amount of chlorophyll a. Similarly, the ‘brownness’ and ‘whiteness’ of water can be related to
13Feasibility of Water Quality Monitoring by Remote Sensing in the Waikato Region
CDOM and suspended solids, respectively, but the difficulty lies in separating the interactions and
overlaps between the spectral signatures of the OACs (Mobley 1994).
Figure 2: Light interactions through the atmosphere, water and substratum (After Dekker & Hestir, 2012).
The mixed spectral signatures received by the sensor are deconstructed using algorithms which
relate the shape of the light spectrum to individual OACs. These algorithms can be developed in a
variety of ways ranging from simple empirical relationships between in situ samples and radiance
reflectance at certain wavelengths, to spectral additive models based on radiative transfer theory.
Many algorithms have been developed and validated for individual sensors, however the majority of
these were created specifically for ocean waters (‘Case 1’ waters) where the dominant OAC is
chlorophyll a (Olmanson et al. 2015). Inland water bodies and estuaries are known as ‘complex’ or
‘Case 2’ waters where three or more constituents are normally present in a mixture (Matthews
2011). The complexity of Case 2 signatures lies in the fact that different constituents can have
reflectance or absorption peaks in the same area of the spectrum, e.g. both chlorophyll a and total
suspended solids (TSS) have a reflectance peak near 665 nm, making it difficult to distinguish one
from the other. As a result, Case 1 algorithms do not produce accurate results in Case 2 waters and,
moreover, no single Case 2 algorithm exists which works well in all Case 2 waters. A detailed review
of algorithms is given in section Retrieval Algorithms.
Due to light extinction and scattering in the aquatic medium, most of the upwelling light comes from
the surface layer of the water. Therefore, the depth to which the remotely sensed information is
attainable depends on water clarity as it cannot resolve vertical variability in OACs.
The reflectance signature measured by an optical sensor contains information on the mixture of
constituents from the surface water layer of the observed system. Such optical water quality
information can add value to water quality analyses, as changes in optical water quality can
14Feasibility of Water Quality Monitoring by Remote Sensing in the Waikato Region
represent changes in primary productivity, temperature and biogeochemical processes as well as
indicating trends such as eutrophication and sedimentation (Julian et al. 2013).
The Current State of Satellite Remote Sensing of Inland Water Quality Parameters
Remote sensing of water quality parameters is carried out using a sensor for electromagnetic
radiation in the visible range of the spectrum (approximately 400 to 750 nm) mounted on earth
orbiting satellites. Four main attributes of the sensor and their satellite platform determine the
potential of remote sensing for monitoring water quality parameters: spatial resolution, spectral
resolution, temporal resolution and swath size.
Spatial resolution refers to the pixel size of the image that is produced by a sensor, which ultimately
determines the size of the feature that can be accurately mapped using remote sensing (Dekker &
Hestir 2012). A greater number of pixels within a water body means that the spatial variability of
water quality can be determined in finer detail and the water quality maps produced will have better
resolution.
Spectral resolution involves the number of spectral bands that can be recorded by a sensor
(Olmanson et al. 2015). A spectral band is a range within full spectrum of light over which a sensor
responds with a signal. The response of a multispectral sensor typically spans ten to one hundred
nanometres. The number of sensor bands and their width are important as the spectral signature of
some water borne constituents can overlap and thus the more numerous and thinner the bands, the
better the chances are for obtaining individual water quality parameters. Hyperspectral sensors
employ imaging spectrometers which generally have hundreds to thousands of very narrow bands
and are able to discern several OACs (Dornhofer & Oppelt 2016). For example, hyperspectral sensors
have been successfully used to identify and quantify cyanobacteria using the pigment phycocyanin
(Matthews 2011; Palmer et al. 2015) and sediment grain size composition from TSS (Dekker & Hestir
2012). Currently, satellites carry multispectral sensors which usually consist of up to 10 wave bands
and many studies have successfully exploited their data to retrieve inland water quality parameters
(Dornhofer & Oppelt 2016; Matthews 2011; Odermatt et al. 2012).
Temporal resolution is the frequency with which images of the same location are taken by a sensor
(Matthews 2011). The temporal resolution of satellite sensor images depends on the specific
satellite orbit which determines the return period of the satellite to the same location. Satellites
used for earth observations have return periods ranging from one day to several weeks, with longer
return periods meaning fewer images over a given duration. The return period and time of a satellite
overpass is crucial when planning field work to collect corresponding in situ samples as these are
required as near to the time of satellite overpass as possible. Whether in-situ samples can be
usefully related to satellite observations depends on the time scale of variability in the environment,
for example, most studies suggest that an offset be no more than a few days apart. Odermatt et al.
(2010) found that images taken 5 days after in situ measurements were adequate for oligotrophic
lakes, however estuary sites required sampling to be nearer the time of the satellite overpass.
The fourth sensor attribute important in determining sensor feasibility is swath size, defined as the
extent of the sensor footprint on the ground. Many sensors sample a continuous track along the axis
of satellite movement, so the swath size is the width of the sensor footprint perpendicular to the
axis of movement. Swath size is an important property to consider in the design of routine
monitoring applications for inland water bodies, because it determines how much of a region is
covered in a single overpass. A complete image of a region may have to be composed of several
overpasses which has implications when the objective is to compare simultaneous states of water
bodies in the same region and also increases data processing requirements. Typically, sensors with
larger swath sizes are more suited for monitoring at the regional scale, but there is the related
disadvantage that greater spatial coverage comes at a lower spatial resolution, i.e., larger pixels.
15Feasibility of Water Quality Monitoring by Remote Sensing in the Waikato Region
Olmanson et al. (2015) suggest regional scale inland water quality monitoring requires freely
available imagery with a spatial resolution of 5 to 50 m2 at no less than weekly intervals and suitable
spectral bands. To date no satellite sensor meets all these requirements. Current satellite platforms
that are most suited to regional-scale water monitoring are those that provide the best balance
between spatial, spectral and temporal resolution, swath size and cost. One of the challenges with
satellite sensor platforms is their life expectancy and the fact that satellites can not be fixed easily if
problems occur. For example, communication with the Envisat-1 satellite carrying the Medium
Resolution Imaging Spectrometer (MERIS) was lost in April 2012, leaving a temporary gap in the
capability to observe inland water bodies. In acknowledgement of this, two major agencies providing
free satellite sensor imagery have established data continuity missions, releasing new satellites
equipped with sensors that replace and improve older sensors as they are decommissioned. In 2013,
NASA (United States National Aeronautics and Space Administration) released Landsat 8 to replace
Landsat 5 and 7 and its enhanced spectral resolution was expected to reduce the retrieval error of
Landsat 7 by around one-half (Roy et al. 2014). Similarly, the European Space Agency (ESA) has
recently launched Sentinel-3a, which was designed to fill the gap left by the MERIS mission,
matching the spatial resolution and improving on the spectral resolution with 6 additional spectral
bands (Alikas et al. 2015; Palmer et al. 2015).
The continual development and improvement of sensors will allow the improvement of retrieval
algorithms to new sensors as they become available (Augusto-Silva et al. 2014). For example, the
Sentinel-2B satellite was launched on 7 March 2017 and Sentinel-3b is scheduled to launch in 2017.
These platforms are the twins to the currently orbiting satellites, doubling the coverage of high-
resolution optical imaging missions for the European Union Copernicus environmental monitoring
system. To manage the transitions from previous to current and upcoming sensors, ESA formed the
Global Lakes Sentinel Service (GLaSS), a group which focuses on the integration of the new Sentinel
sensors into the current freshwater remote sensing environment. Studies produced by this group
have suggested that the output from Sentinel-2 will be similar to, yet improve upon Landsat images,
while Sentinel-3 output is expected to improve upon MERIS imagery (GLaSS 2015).
Currently the most ambitious project is the Hyperspectral Infrared Imager or HyspIRI satellite (Lee et
al. 2015). This mission was recommended in the 2007 National Research Council Decadal Survey
requested by NASA, NOAA, and USGS and is anticipated to collect hyperspectral imagery at 60 to
1000 m resolution over land and oceans. The launch is planned for 2021.
Characteristics of Current Satellite Sensors
The satellite sensors in orbit today cover a range of resolutions, return periods and spectral bands
(Table 2). It is noted that the list includes the information to date, but may be incomplete or contain
obsolete sensors at the time of reading due to the risks of space operations. For example, the highly
successful MERIS sensor is not included in this list due to its recent decommissioning, however, its
replacement Sentinel-3 Ocean and Land Colour Instrument (OLCI), are included.
16Feasibility of Water Quality Monitoring by Remote Sensing in the Waikato Region
Table 2: Current and future satellite sensors feasible for use in inland water quality retrieval. The suitability of each sensor for the retrieval of individual constituents is
suggested, along with the minimum water body size. A plus (+) in the Lifespan column indicates that satellites often operate beyond their planned life span (Adapted from:
Dekker & Hestir 2012).
Minimum
Spatial Repeat Spectral Cost Water Quality Variables
Satellite Lifespan water
Sensor Resolution Cycle Bands (400- NZD
(Operator) (years) body size
(m) (days) 1000 nm) (km2) Chl a TSS PC CDOM SD TURB
(ha)
Landsat 7
ETM+ 30 16 4 Free 1999-2004+ 1
(NASA/USGS)
15 16 Pan*
Landsat 8
LDCM Free 2013-2023+ 1
(NASA/USGS) 30 16 5
250 Daily 2
Terra and
Aqua MODIS 500 Daily 2 Free 1999-2008+ 10
(NASA)
1000 Daily 9
Suomi NPP
(NASA/NOAA/ VIIRS 750 0.5 7 Free 2011-2016
DoD)
10 4
Sentinel-2 A&B 10
MSI Free 2015-2023+ 0.5
(ESA) 5 (with B)
20 4
A: 2016-
Sentinel-3 A&B 1-2 2025+
OLCI 300 21 Free 10
(ESA) (with B) B: 2017 -
2025
Highly Suitable Suitable Potential Not Suitable
*Pan: one single band (panchromatic band 8, 500-680 nm)
Acronyms: Chl a: Chlorophyll a, TSS: Total suspended solids, PC: Particulate carbon, CDOM: Coloured dissolved organic matter, SD: Secchi depth, TURB: Turbidity, NASA:
National Aeronautics and Space Administration, USGS: United States Geological Survey, NOAA: National Oceanic and Atmospheric Administration, DoD: Department of
Defense, ESA: European Space Agency
17Feasibility of Water Quality Monitoring by Remote Sensing in the Waikato Region
Figure 3 illustrates the current and future freely available satellite sensor bands and the spatial
resolution of each. Sentinel-2 and Landsat 7 and 8 have the highest spatial resolution with pixel sizes
ranging from 10 to 30 m, while MODIS (Moderate Resolution Imaging Spectroradiometer) has the
lowest spatial resolution with pixels from 250-1000 m (Figure 3), allowing only for the retrieval of
constituents from large water bodies.
Figure 3. Existing and proposed satellite sensor platforms providing free imagery, illustrating the spatial and
spectral resolution of each.
The spatial resolution of sensors has a direct influence on the size of the water body that can be
accurately analysed, with high spatial resolution sensors able to remotely sense constituents from
smaller water bodies such as rivers and small lakes. The minimum water body sizes detectable for
major sensors have been determined in the literature and are summarised in Table 3 along with the
calculated minimum water body size based on a relationship proposed by Dekker & Hestir (2012).
Table 3: Detectable water body size limits as determined in the literature along with the minimum water body
area as calculated from four times pixel footprint as proposed by Dekker & Hestir (2012).
Calculated
Spatial resolution Minimum water
Sensor Reference minimum water
(m) body area
body area (ha)
Lakes: Olmanson et al.
1.4
4 ha (2011 & 2015)
Landsat 7 ETM+ 30
River width:
Zhao et al. (2014)
65 m
Landsat 8 OLI 30 1 ha Roy et al. (2014) 1.4
Olmanson et al.
1000 1000 ha 1600
(2011)
Olmanson et al.
MODIS 500 400 ha 400
(2011)
250 100
Sentinel-2 10, 20, 60 0.64
Sentinel-3 300 144
18Feasibility of Water Quality Monitoring by Remote Sensing in the Waikato Region
The authors suggest that water body size should be at least 3 to 4 times the size of the pixel in order
to obtain enough pure water pixels without signals from the surrounding banks and vegetation
(Dekker & Hestir 2012). For example, a sensor with 30 m spatial resolution such as Landsat 7 and 8
could resolve a body of water of 120 by 120 m (1.4 ha). The Section Regional Context Analysis
discusses the limitations of sensor footprint for the visibility of water bodies in the Waikato.
A study by Zhao et al. (2011) on the Xitiaoxi River in China found the minimum river width
retrievable by a sensor with 30 m spatial resolution was between 65 and 98 m. In addition to river
width, water depth also influences the retrieval of river spectral signatures, with the above study
finding pixels within 17 m of the river shoreline were unusable due to adjacency effects (Zhao et al.
2014).
In summary, there is currently a trade-off between the spatial and spectral resolution of sensors,
with Landsat sensors returning some of the highest spatial resolution at the expense of lower
spectral resolution and broad spectral bands. The broad bands of Landsat sensors mean that there
are smaller gaps in the spectrum and while the sensors can retrieve signatures across a wide range
of wavelengths, individual constituents cannot be easily retrieved when co-occurring in a waterway.
For example, the accurate and reliable retrieval of chlorophyll a estimates in complex waters using
Landsat 7 has proven difficult (Allan et al. 2015), with MODIS images presenting similar challenges
(Olmanson et al. 2011), however MODIS 1000 m resolution bands have sufficient spectral resolution
to enable the application of semi-analytical algorithms which simultaneously estimate chlorophyll a,
TSS and CDOM. MODIS and MERIS/Sentinel-3 have high temporal coverage, large swath widths and
a greater number of spectral bands although the spatial resolution of these sensors is low and only
applicable for large water bodies (Olmanson et al. 2011). Sentinel-2 currently has the best spatial
and spectral resolution with a small pixel size of 10-20 m2 allowing for the potential detection of
water bodies as small as 0.64 ha using nine bands across the visible spectrum (Table 3, Figure 3).
Some investigators have attempted to circumvent the resolution trade-off by data-fusion techniques
to merge images of high spectral resolution with images of high spatial resolution (Ashraf et al. 2008;
Chang et al. 2015). The results of these analyses are impressive and should be considered to improve
retrospective analyses. The requirements for such techniques for current purposes are arguably
diminishing given the recent development of sensors with both high spatial and spectral resolution.
Other Sensor Platforms
Sensors akin to those mounted on satellites can also be used in situ, from the ground or on airborne
platforms. Handheld and stationary sensors retrieve optical measurements from a water body at a
small spatial scale (millimetres to metres) which can provide very detailed optical information for a
particular site, but are inefficient to provide data outside the field of view. Tan et al. (2015)
recommend using handheld spectrometers in conjunction with in situ sampling to accurately and
conveniently measure the spectral signature of smaller rivers and streams. This would require field
visits much like current monitoring regimes, though the empirical relationship found between these
could be used to enhance algorithms developed for multispectral satellite or airborne sensors, which
are limited by spectral resolution (Tan et al. 2015).
Airborne platforms are often optimal for monitoring small water bodies as they have high spatial
resolution and can employ newer or larger hyperspectral sensors (Julian et al. 2013; Matthews 2011;
Tan et al. 2015; Torgersen et al. 2001). In addition, the sensors are flown at low altitudes reducing
the need for atmospheric correction when applying algorithms (Matthews 2011). Olmanson et al.
(2013) found that airborne hyperspectral sensors could adequately predict water quality in large
rivers, however the low-altitude flight paths again result in swath sizes too small for the complete
capture of larger water bodies. Recurring flights are difficult to schedule for regular monitoring
intervals, making it difficult to assess temporal trends. In addition, the large cost of both the sensors
19Feasibility of Water Quality Monitoring by Remote Sensing in the Waikato Region
and air time may exceed operational budgets for regional-scale routine monitoring purposes (Julian
et al. 2013; Matthews 2011; Tan et al. 2015).
Observable Water Quality Constituents
Inland waters contain mixtures of these OACs resulting in a complex spectral shape composed of the
contributions of individual constituents. Figure 4 shows how the spectral shape of pure water is
modified by the addition of OACs as determined from a bio-optical model (Rudorff et al. 2006).
Figure 4: Modelled reflectance spectra of waters containing different optically active constituents (Source:
Rudorff et al. 2006).
The result of the interaction of spectral absorption and scattering processes is shown in Figure 5
which shows a simplified eutrophic water reflectance spectrum, illustrating the peak reflectance (the
peaks) and peak absorption wavelengths (the troughs) along with the regions of the spectrum often
used to identify different constituents.
Figure 5: A simplified water reflectance signature for a eutrophic water body with circled areas indicating
signature reflectance and absorption peaks often used to detect different water quality constituents (After
Schalles & Yacobi 2000).
Figure 6 shows where regions affected by individual OACs lie along the spectrum of visible light. The
goal of a remote sensor is to measure light intensity at as many of those spectral regions as possible
20Feasibility of Water Quality Monitoring by Remote Sensing in the Waikato Region
and it can be seen in Figure 6 how the current range of sensors achieves this. One challenge is the
overlap in the constituent peaks (vertical bands in Figure 6), such as those of TSS and Chl a at 700
nm, which leads to difficulties in deciphering individual contributions to measured reflectance at
that wavelength (Gitelson et al. 2008; Olmanson et al. 2015).
Figure 6: Current and future satellite sensor systems showing the wavebands (coloured horizontal bands) of
each along with major signature peaks commonly used to isolate individual constituents (vertical bars). C:
CDOM, Ch: chlorophyll a, SD: Secchi depth and SS: TSS.
The suitability of existing and future sensors for the retrieval of individual water quality parameters
based on the spectral capabilities of each sensor is summarised in Table 2, adapted from Dekker &
Hestir (2012). The Sentinel series appears best suited for the retrieval of all inland water quality
parameters while Landsat 7 and 8 are suitable for most parameters. Landsat 7 and 8 and Sentinel-2
have the highest spatial resolution, allowing water bodies larger than 1 ha to be studied. The
following sections describe issues related to the retrieval of individual water quality components.
Chlorophyll a and Phycocyanin
The photosynthetic pigment chlorophyll a found in algae and the accessory pigment phycocyanin
found in cyanobacteria are indicative of phytoplankton and cyanobacterial biomass, respectively
(Dekker & Hestir 2012). High concentrations of chlorophyll a can signify nuisance algal blooms, high
nutrient levels and increased trophic status while high phycocyanin concentrations can indicate the
presence of often harmful or toxic cyanobacterial blooms (Dekker & Hestir 2012). Chlorophyll a
concentrations 30 µg L-1 have been retrieved using both a peak at 560 nm
and the ratio of the absorbance trough near 660 nm with the reflectance peak at 700 nm (Figure 6)
(Allan, 2008; Matthews, 2011; Odermatt et al. 2012; Olmanson et al. 2013). Inclusion of the peak at
700 nm has proven highly successful in a number of studies on lakes, rivers and estuaries (r2 > 0.8) as
CDOM absorption in this region is minimal, aiding in the distinction between these two co-occurring
constituents (Matthews 2011; Olmanson et al. 2013). It should be noted that the exact location and
width of these spectral peaks and troughs differ depending on the species of phytoplankton present
as well as their physiological state (Allan 2014) which may add an error to the retrieval of chlorophyll
concentration from reflectance.
Phycocyanin has a strong absorption peak at 620 nm, often detectable by sensors with narrow
bands. This spectral region falls within a gap in Landsat sensor wavebands (Matthews 2011;
Olmanson et al. 2015), however, successful retrieval estimates have been obtained using MERIS
21Feasibility of Water Quality Monitoring by Remote Sensing in the Waikato Region
imagery. Simis et al. (2005) and Gomez et al. (2011) both found close relationships of phycocyanin
(r2 = 0.94 – 0.97) using MERIS imagery to both in situ samples and fluorometry measurements,
respectively.
Coloured Dissolved Organic Matter (CDOM)
CDOM is comprised of coloured humic and fulvic acids which originate from the breakdown of both
allochthonous and autochthonous organic matter; it is also known as yellow-substance, gelbstoff or
gilvin, and is often visible in water as brownish or tea-like colouration (Matthews 2011; Vant 2015).
As such, CDOM concentrations can be indicative of the organic matter and aquatic carbon content of
water (Dekker & Hestir, 2012) as well as potentially providing an indication of dissolved organic
carbon (DOC) concentration, although these correlations require further development (Brezonik et
al. 2015). CDOM is often a major constituent in peat lakes (Allan 2008; Davies-Colley & Vant 1987)
and it is the main light absorbing constituent in many rivers under normal flow conditions, with
concentrations increasing after storm events which flush humics from the catchment (Julian et al.
2013). Due to the strong absorbance characteristics of CDOM, it is often difficult to derive
(Dornhofer & Oppelt 2016), however many studies have used the strong absorption peak at 440 nm
or the ratio of both sensitive bands below 600 nm and normalisation bands above 600 nm to
retrieve CDOM estimates (Matthews 2011; Odermatt et al. 2012) (Figure 6).
Total Suspended Solids (TSS)
Total suspended solids (TSS) include all particles suspended in water which do not pass through a 0.2
µm filter. According to this definition TSS is constituted of a wide variety of material, such as mineral
or inorganic particles, detritus, phytoplankton cells and animal matter. Especially in shallow lakes,
TSS can include considerable amounts of detritus and inorganic mineral particles resuspended from
the bottom. While its detailed optical characteristics depend on the absorption and scattering
properties of the various constituents (Vant 2015), scattering by the suspended mineral fraction
causes a reflection peak between 510 – 550 nm and in the infrared part (above 700 nm) of the
spectrum (Allan 2008). The reflectance peak between 510 and 550 nm is successfully used to derive
TSS when these are below 30 mg m-3, but at higher TSS concentrations, reflectance above 800 nm is
used due to superimposition by the optical properties of chlorophyll a at 550 nm (Olmanson et al.
2013).
Often in the technical literature, variables related to TSS are defined and used in remote sensing
applications, e.g., suspended sediment, suspended particles, suspended matter or non-volatile
suspended solids. This makes it difficult to compare and contrast TSS-related results in detail. In this
review, several operational definitions for TSS-related variables may be reported.
Turbidity
Turbidity is a measure of water clarity related to light absorbed and scattered by all OACs. Turbidity
is a useful measure of light availability under water and is therefore related to many ecosystem
processes (Dekker & Hestir 2012). Due to the strong influence of suspended solids on water clarity,
reflectance at 700 nm is most often used to derive turbidity from remotely sensed signals (Figure 6)
(Hicks et al. 2013).
Secchi Depth
Secchi depth (SD) is a measure of water clarity in the vertical direction. Like turbidity, it is a function
of scattering and absorption caused by all OACs. It has been successfully correlated to OACs,
especially to chlorophyll a concentrations in the open ocean and due to its relationship with water
clarity it can be related to the depth of the euphotic zone, i.e. the depth to which net positive rates
of photosynthesis occur. Remote sensing has been shown to produce very good estimates of Secchi
depth in several studies, most often using the ratio of peaks at 500 nm and 610 nm (Figure 6) (Allan
2008; Hicks et al. 2013; Olmanson et al. 2015; Zhao et al. 2011; Zhao et al. 2014).
22You can also read