The City of Kawartha Lakes Lindsay Transit Master Plan 2018 - Meetings
←
→
Page content transcription
If your browser does not render page correctly, please read the page content below
The City of Kawartha Lakes Lindsay Transit Master Plan 2018
City of Kawartha Lakes 2018 Lindsay Transit Master Plan

Client Project Team
Project Manager                 Todd Bryant, Manager, Fleet and Transit
                                Services

Project Team                    Enzo Ingribelli, Transit Supervisor

Transit Consulting Network Project Team
Principal & Project Manager Wally Beck, C.E.T

Project Team                    W.B. O’Brien, Deputy PM, Community
                                Engagement
                                Vince Mauceri, Bus Stop Infrastructure
                                Charles Fitzsimmons, Specialized Transit
                                and AODA
                                Kim Laursen, Administration and Technical
                                Support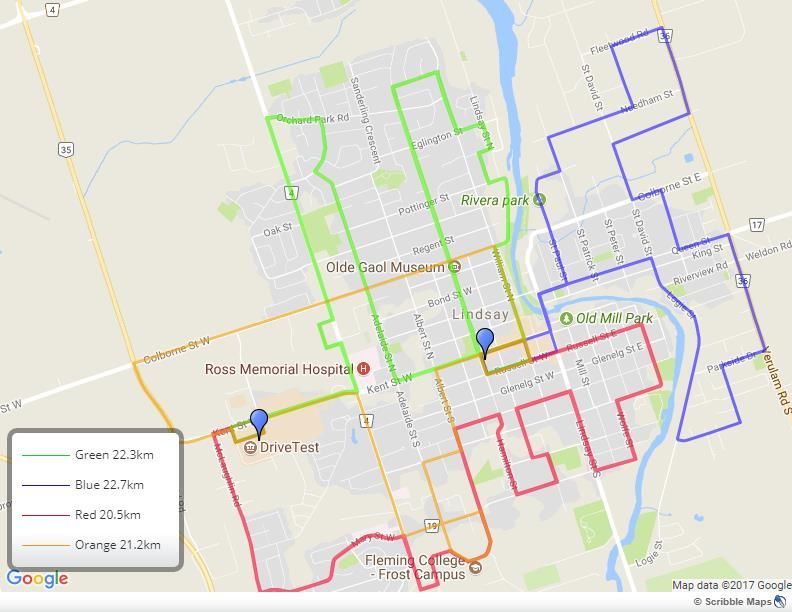
City of Kawartha Lakes 2018 Transit Master Plan

Executive Summary
The City of Kawartha Lakes retained the services of Transit Consulting Network to
develop a Transit Master Plan for the next 10 years (2018-2027). The plan is to build on
recent successes, improve service reliability and accessibility, expand transit’s reach
within the City where supported by a sound business case, and identify alternatives to
improve upon the existing routes and route network design. A ten-year transit asset
management plan was also developed to ensure sufficient rolling stock with supporting
infrastructure and technology is in place to support the proposed transit service plan.

The Transit Master Plan study was broken down into the following phases and tasks:

   ▪   Phase I: Evaluation of Existing Public Transportation Services
   ▪   Phase II: Preliminary Route and Service Concepts, Community Engagement
   ▪   Phase III: 2018-2027 Public Transportation Service and Financial Plan

Evaluation of Lindsay Transit
Lindsay Transit operates a fixed route service from 0700 hrs. to 1900 hrs. Monday
through Saturday. Lindsay Transit is a well-established service that consists of three
separate routes. Lindsay Transit also operates a Specialized Transit system called
LIMO that provides accessible door to door transportation within the Town of Lindsay to
residents that are unable to use Lindsay Transit.

There was a 22.1 % growth in total transit ridership from 2012 to 2016 while the service
area population grew by only 7.2%. For every 1% in population growth, the public
transportation demand grew by 3%. Both services have experienced an increase in
ridership, operational efficiencies and community acceptance.

Community Engagement Process
A critical and extensive community engagement process was initiated to determine
community priorities within the City of Kawartha Lakes to help guide the study. The
engagement process included:

   ▪   Questionnaire survey undertaken by Lindsay Transit staff during Spring 2017
       (199 responses received)
   ▪   Lindsay Employer Survey (32 businesses representing 868 employees)
   ▪   Bus Operator focus group
   ▪   Municipal Staff focus group
                                                                                           i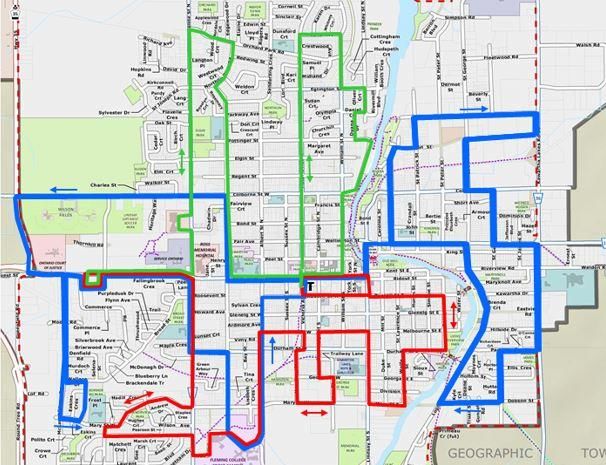
City of Kawartha Lakes 2018 Lindsay Transit Master Plan

   ▪     Business Community focus group
   ▪     Bus Ride-along/ passenger interviews (22)
   ▪     Fleming College student interviews
   ▪     Accessibility Committee
   ▪     Transit Advisory Board (TAB) focus group
   ▪     TAB Six Sigma Exercise Meeting

2018-2027 Public Transportation Service and Financial Plan
The Transit Master plan proposes for 2018-2027 a transit service plan to increase the
amount of service on an annualized basis from 15,027 revenue hours of service to
27,459 revenue hours. This plan has been separated into two parts, 2018-2022 and
2023-2027

Table 1 - 2018-2022 service developments

 Year      Description            Additional        Annual           Annual       Annual
                                    Annual       Operating Cost    Additional    Net Cost
                                   Revenue       ($70 per hour)     Revenue
                                     Hours
 2018      Modify Routes           No added            Nominal
                                    service          (added bus        NA           NA
                                     hours              stops)
 2019      Add Sunday service     936 Transit          $87,400       $11,000      $76,400
           (1000 -1600 hours)     + 312 LIMO
 2020      No change

 2021      Add Orange Route          3,936           $275,500        $41,700     $233,800
           (Monday – Sunday)
 2022      Add weekday               4,000
           evening service to                        $280,000        $42,400     $237,600
           2300 hrs.

 Total     Lindsay Transit +         9,184           $642,900        $95,100     $547,800
           LIMO

                                                                                        ii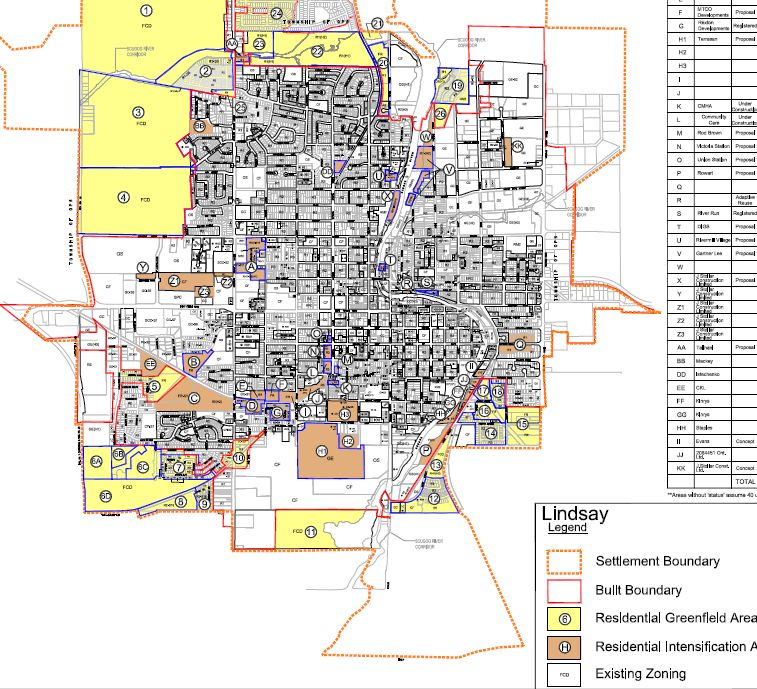
City of Kawartha Lakes 2018 Lindsay Transit Master Plan

Table 2 - 2023-2027 service developments

 Year         Description          Additional       Annual             Annual      Annual
                                     Annual      Operating Cost      Additional    Net Cost
                                    Revenue      ($70 per hour)       Revenue
                                     Hours
 2023 3 roundtrips per day            936            $65,500          $15,000       $50,000
      from Bobcaygeon to
      Lindsay, 3 days a week
 2024 Increase service                 624           $43,700          $10,000       $33,700
      between Bobcaygeon
      and Lindsay to 5 days
 2025 - Add 2 trips per               1,000          $70,000          $16,000       $54,000
      weekday between
      Bobcaygeon and
      Lindsay
 2026 Weekday Commuter                1,000          $50,000          $16,000       $34,000
      service from Lindsay to
      GO bus stop at HWY
      35/115

 2027 No change

 Total                                3,560          $229,200         $57,000      $172,200

The Transit Master Plan builds on past successes of Lindsay Transit and LIMO service
and incorporates best practices that have evolved over the years throughout Ontario
and Canada. The transit market has changed and as such, the proposed Master Plan
will take Lindsay Transit and LIMO service to the next level. The plan also includes a
community Transit plan for locations outside of Lindsay in the years 2023-2027.

The extensive community engagement process provided the study team with the
information needed to prioritize transit service improvements and investments. The first
five years of the plan focus on the current Lindsay Transit service area while the next
five years addresses expansion of Lindsay Transit and LIMO to outlying communities
such as Bobcaygeon and Fenelon Falls. The transit improvements that have been laid
out over the 2018-2027 period will take transit to a value-added level that will support
growth, existing needs and the Kawartha Lakes Strategic Plan.

                                                                                           iii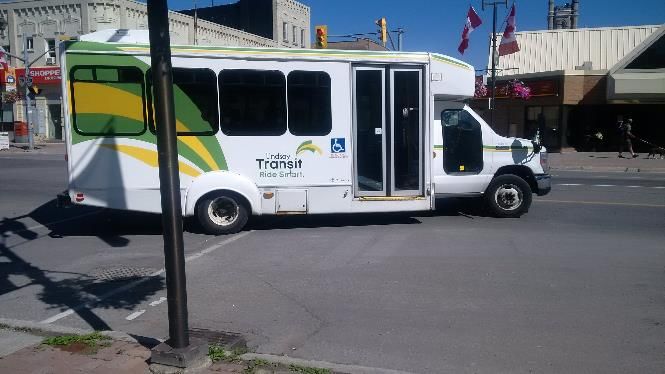
City of Kawartha Lakes 2018 Transit Master Plan

TABLE OF CONTENTS
Executive Summary ......................................................................................................... i
   Evaluation of Lindsay Transit ........................................................................................ i
   Community Engagement Process ................................................................................. i
   2018-2027 Public Transportation Service and Financial Plan .......................................ii
1. Introduction ............................................................................................................... 1
   1.1      Background ........................................................................................................ 1
   1.2      Study Scope ....................................................................................................... 1
   1.3      The Case to Support Transit Investments .......................................................... 2
   1.4      Description of Lindsay Transit Service ............................................................... 4
      1.4.1       Lindsay Transit Service Description ............................................................ 4
      1.4.2       Lindsay Transit Fleet ................................................................................... 6
      1.4.3       Other Transit Services ................................................................................. 7
   1.5      Description of LIMO Service............................................................................... 8
      1.5.1       Communities Served ................................................................................... 8
      1.5.2       Route and Service Design ........................................................................... 8
      1.5.3       LIMO Eligibility ............................................................................................. 9
   1.6      Community Care (outside of Lindsay) .............................................................. 10
      1.6.1       Community Care Transportation ................................................................ 10
      1.6.2       Service Considerations .............................................................................. 11
      1.6.3       Eligibility considerations............................................................................. 11
      1.6.4       Summary of Specialized Transit Service ................................................... 11
2. Phase I: Existing Transit Environment .................................................................... 13
   2.1      2011-2015 Lindsay Transit Report Card and Peer Review .............................. 13
      2.1.1       2011-2015 Lindsay Transit Report Card .................................................... 13
      2.1.2       2015 Lindsay Transit Peer Review ............................................................ 14
      2.1.3       Assessment of Lindsay Transit Performance ............................................ 15
      2.1.4       Lindsay Transit Financial Indicators .......................................................... 18
      2.1.5       Summary of Report Card and Peer Review............................................... 21
      2.1.6       2012-2016 Lindsay Transit and LIMO Ridership ....................................... 21
   2.2      Community Engagement .................................................................................. 21
City of Kawartha Lakes 2018 Lindsay Transit Master Plan

     2.2.1     Lindsay Transit Survey .............................................................................. 21
     2.2.2     Lindsay Employer Survey .......................................................................... 25
     2.2.3     Transit Focus Group Discussions .............................................................. 26
3. Phase II: Preliminary Route and Service Concepts ................................................ 35
  3.1     Goals and Objectives ....................................................................................... 35
  3.2     Transit Service Design Guidelines ................................................................... 37
     3.2.1     Transit Service Standards ......................................................................... 37
     3.2.2     Transit Service Level Policies .................................................................... 37
     3.2.3     Service Reliability ...................................................................................... 38
  3.3     Land Use Planning and Transit ........................................................................ 38
     3.3.1     Acceptable Transit Route Design .............................................................. 39
     3.3.2     Walk Distance to Bus Service .................................................................... 40
     3.3.3     Bus Stop Locations and Design ................................................................. 41
     3.3.4     Trade-offs .................................................................................................. 42
  3.4     Transit Ridership Growth Plan ......................................................................... 42
     3.4.1     Transit Service Expansion ......................................................................... 43
     3.4.2     Transit Fare Pricing Strategy ..................................................................... 44
     3.4.3     Transit Technology .................................................................................... 46
     3.4.4     Bus Stop Infrastructure .............................................................................. 48
     3.4.5     Branding and Marketing............................................................................. 51
     3.4.6     Travel Training ........................................................................................... 52
     3.4.7     Community Liaison .................................................................................... 53
     3.4.8     Bike Racks on Buses ................................................................................. 55
     3.4.9     Development Growth ................................................................................. 56
     3.4.10       Summary of Transit Ridership Growth Strategies .................................. 56
  3.5     Public Transportation Service Alternatives ....................................................... 57
     3.5.1     Heavy-duty Conventional Transit Fixed-route Service ............................... 57
     3.5.2     Community Bus Fixed-Route Service ........................................................ 57
     3.5.3     Specialized Transit .................................................................................... 57
     3.5.4     Fixed Flex-route Concept .......................................................................... 58
     3.5.5     Fixed-route Shared-ride Taxi ..................................................................... 59
     3.5.6     Dial-a-Ride................................................................................................. 60
     3.5.7     Summary of Service Delivery Options ....................................................... 60
4. Phase III: 2018-2027 Transit Service Plan ............................................................. 61
City of Kawartha Lakes 2018 Lindsay Transit Master Plan

  4.1      Proposed 2018-2023 Route and Service Plan ................................................. 61
     4.1.1       Proposed Three-route Plan (2018) ............................................................ 62
     4.1.2       Proposed 2019-2023 Four-route Plan ....................................................... 63
     4.1.3       Growth Management Plan ......................................................................... 64
     4.1.4       Summary of 2018-2022 Lindsay Transit Service Plan ............................... 65
  4.2      Proposed 2023-2027 Lindsay Transit and LIMO Service Plan ......................... 67
     4.2.1       Proposed 2023-2027 Lindsay Transit and LIMO Service Plan .................. 67
     4.2.2       Summary of 2018-2027 Transit Service Plan ............................................ 70
     4.2.3       Dedicated Provincial Gas Tax ................................................................... 70
     4.2.4       Grant Availability ........................................................................................ 71
     4.2.5       Transit Organization .................................................................................. 71
5. Transit Asset Management Plan ............................................................................. 74
     5.1.1       Smart Card Technology (2020) ................................................................. 74
     5.1.2       Transit Operations Centre ......................................................................... 74
     5.1.3       Fleet Replacement and Expansion Plan .................................................... 74
     5.1.4       Bus Stop Infrastructure (2018-2027) ......................................................... 76
     5.1.5       Bike Racks................................................................................................. 76
     5.1.6       Future Off-street Transit Hub ..................................................................... 76
     5.1.7       Summary of 2018-2027 Transit Asset Management Plan ......................... 77
6. Transit Master Plan Recommendation.................................................................... 79

Figure 1 - CAA 2015 Driving Costs ................................................................................. 2
Figure 2 - Lindsay Transit System ................................................................................... 4
Figure 3 - Lindsay Transit 2016 Weekly Averages .......................................................... 5
Figure 4 - Lindsay Transit Bus ........................................................................................ 6
Figure 5 - LIMO Total Monthly Passengers 2016 ............................................................ 9
Figure 6 - Lindsay Transit Report Card ......................................................................... 14
Figure 7 - Lindsay Transit 2016 Peer Review Table ..................................................... 15
Figure 8 - 2011-2015 Transit Ridership ......................................................................... 15
Figure 9 - 2011-2015 Revenue Vehicle Hours .............................................................. 15
Figure 10 – 2011-2015 Lindsay Transit Revenue Vehicle Hours per Capita ................. 16
Figure 11 - 2015 Peer Group Revenue Vehicle Hours per Capita ................................ 16
Figure 12 - 2011-2015 Passengers per Hour ................................................................ 16
Figure 13 - 2015 Peer Group Passengers per Hour ...................................................... 16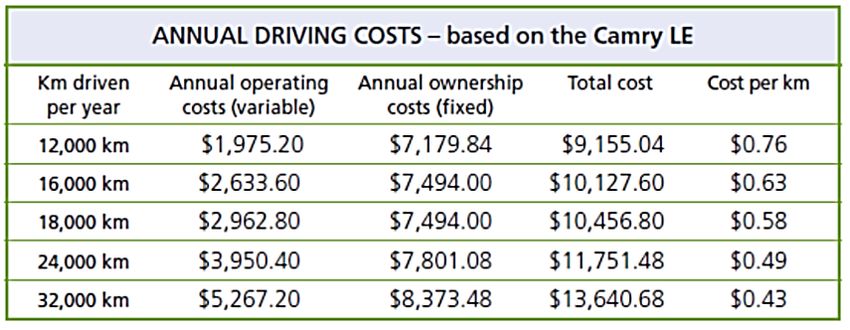
City of Kawartha Lakes 2018 Lindsay Transit Master Plan

Figure 14 –2011-2015 Lindsay Transit Revenue Passengers/Capita ........................... 17
Figure 15 – 2015 Peer Group Revenue Passengers/Capita ......................................... 17
Figure 16 - 2011-2015 Lindsay Transit Cost/Hour ........................................................ 19
Figure 17 - 2015 Peer Group Cost/Hour ....................................................................... 19
Figure 18 - 2011-2015 Lindsay Transit Average Fare ................................................... 19
Figure 19 - 2015 Peer Group Average Fare .................................................................. 19
Figure 20 - 2011-2015 Lindsay Transit Net Investment/Capita ..................................... 20
Figure 21 - 2015 Peer Group Net Investment/Capita .................................................... 20
Figure 22 - 2012-2016 Lindsay and LIMO Ridership ..................................................... 21
Figure 23 - Transit Customer Usage ............................................................................. 22
Figure 24 - Usage Frequency and Timing ..................................................................... 22
Figure 25 - Length of Years using Lindsay Transit ........................................................ 23
Figure 26 - Main Destinations ....................................................................................... 23
Figure 27 - What would entice you to use Transit more often? ..................................... 24
Figure 28 - What would entice you to use Lindsay Transit? .......................................... 24
Figure 29 - How many vehicles are there in your household?....................................... 24
Figure 30 – Type of Business ...................................................................................... 245
Figure 31 – TAB Six Sigma Table ................................................................................. 24
Figure 32 - Current Fares Table .................................................................................... 44
Figure 33 - Smart Card/Farebox Photo ......................................................................... 47
Figure 34 - Posted Schedules at Bus Stops .................................................................. 50
Figure 35 - Annual Planning and Budget Process Flow Chart ...................................... 54
Figure 36 - Bus with Bike Rack ..................................................................................... 55
Figure 37 - Proposed Three-route Plan (2018) Map...................................................... 62
Figure 38 - Proposed Four-route Plan Map ................................................................... 63
Figure 39 - Urban Settlement Area ............................................................................... 64
City of Kawartha Lakes 2018 Transit Master Plan

1.              Introduction

1.1             Background
The City of Kawartha Lakes completed a Transit Master Plan in April of 2008. The City
of Kawartha Lakes retained the services of Transit Consulting Network to develop a
Transit Master Plan for the next 10 years (2018-2027). The plan is to build on recent
successes, improve service reliability and accessibility, expand transit’s reach within the
City where supported by a sound business case, and identify alternatives to improve
upon the existing routes and route network design. A ten-year transit asset
management plan will also need to be in place to ensure sufficient rolling stock with
supporting infrastructure and technology in place to support the proposed transit service
plan.

1.2             Study Scope
The Transit Master Plan study was broken down into the following phases and tasks:
     ▪   Phase I: Evaluation of Existing Public Transportation Services
           o To provide the City with an in-depth understanding of both fixed-route
               transit and specialized transit operations from a logistics and community-
               wide perspective
     ▪   Phase II: Preliminary Route and Service Concepts
           o Development of a Policy Framework for both fixed-route transit and
               specialized transit that is in line with the City’s strategic direction and the
               community’s transit priorities
           o Develop route and service concepts based on the policy framework,
               development and best practices that would be carried forward to Phase III
     ▪   Phase III: Public Transportation Service and Financial Plan
           o Development of draft service and financial plan
           o Development of Transit Asset Management Plan
           o Review with Project Steering Committee
            o Review with public
            o Present Transit Master Plan to Council

The ultimate goal and challenge of the study was to make adjustments to Lindsay
Transit that will maintain an ability to meet the community needs and comply with
existing and impending AODA requirements, while operating effectively within available

                                                                                   1|Page
Transit Consulting Network - January 2018
City of Kawartha Lakes 2018 Lindsay Transit Master Plan
resources, and not over-committing the City of Kawartha Lakes financially. The study
was designed to find solid evidence on which to base recommendations that will lower
the cost and/or improve the quality of transit and mobility services, while ensuring full
and timely compliance with AODA IASR (Integrated Accessibility Standards Regulations
of Ontario) requirements.
1.3 The Case to Support Transit Investments
Communities are finding that residents who are faced with the loss of personal mobility
or are unable to afford a car, are increasingly inclined or obliged to move to
communities where affordable public transportation exists. Likewise, employers
consider the availability of public transportation when making business location
decisions. A major factor that makes possible a good quality of life is the availability of
affordable public transportation since it enables those without access to a private car to
access goods, services, jobs, and maximizes social connectedness, which is now
considered a health-related benefit.
The market for transit – students, the working poor, people with disabilities, senior
citizens, people on social
assistance, and those that
simply want to do without that
2nd or 3rd car are all segments
of the population whose needs
should not be ignored. People
are also choosing transit for Figure 1: CAA 2015 Driving Costs
environmental reasons,
Figure 1 - CAA 2015 Driving Costs
affordability and as a quick practical option. The viability of policies to maintain the
elderly in their homes instead of in long-term care, access to health care, social
services, and essential maintenance such as shopping and banking all depend on
personal mobility. Community leaders seeking to reverse or stabilize a potential decline
in population must consider access to transportation as a key issue affecting the vitality
and the financial health of their community.
Another key factor that can be considered to support the availability of affordable public
transit is the positive financial impact transit can have on a community. For example, the
ability to reduce car ownership can have a profound effect on a household’s finances
and quality of life. Figure 1: CAA 2015 Driving Costs provides the true cost of car
ownership using a Camry LE.
2|PageCity of Kawartha Lakes 2018 Lindsay Transit Master Plan
For auto owners that drive 16,000 kilometres per year, the total annual cost reported to
own and operate a vehicle is $10,127 per year. Arbitrarily applying a factor of 75% to be
conservative, this would still equate to $7,600 per year or $630 per month compared to
a Lindsay Transit monthly bus pass at $52.50 for seniors and $63 for adults, saving
residents $583 per month. The savings would likely be spent on local goods and
services, improving the quality of life of residents and supporting local businesses.
For those residents that earn little income and are forced to own a vehicle in order to get
to and from work, car ownership becomes a financial burden. For example, a person
working part-time 24 hours per week with a net income of $12 per hour must work 13
hours per week to own and operate a vehicle to get to and from work; this consumes
over 50% of their earnings. A major car repair expense can be devastating. Those on
low fixed incomes or under-employed face even more challenges. Fortunately, the City
of Kawartha Lakes has a record of financially supporting fixed-route transit.
The modern understanding of public transportation is to see it as a Family of Services
rather than being limited to the usual fixed route bus service (Lindsay Transit) and
specialized transit such as LIMO. Each member of the Family of Services has different
strengths and cost levels. Taken together, they support each other to provide, overall,
an excellent range of mobility choices as an alternative to the private car.
3|PageCity of Kawartha Lakes 2018 Lindsay Transit Master Plan
1.4 Description of Lindsay Transit Service
The City of Kawartha Lakes (and the former Town of Lindsay) has provided a public
transit service, known as
Lindsay Transit, within the
Lindsay urban area since
the 1970’s. Following the
amalgamation of the former
municipalities to form the
current City of Kawartha
Lakes, the municipal
funding for the transit
service within Lindsay has
been provided through an
area rating property tax that
applies only to properties
within the former Town of
Lindsay boundaries. The
City also provides a
dedicated transit service
known as LIMO for persons Figure 2 - Lindsay Transit System
with disabilities within the
Lindsay urban area.
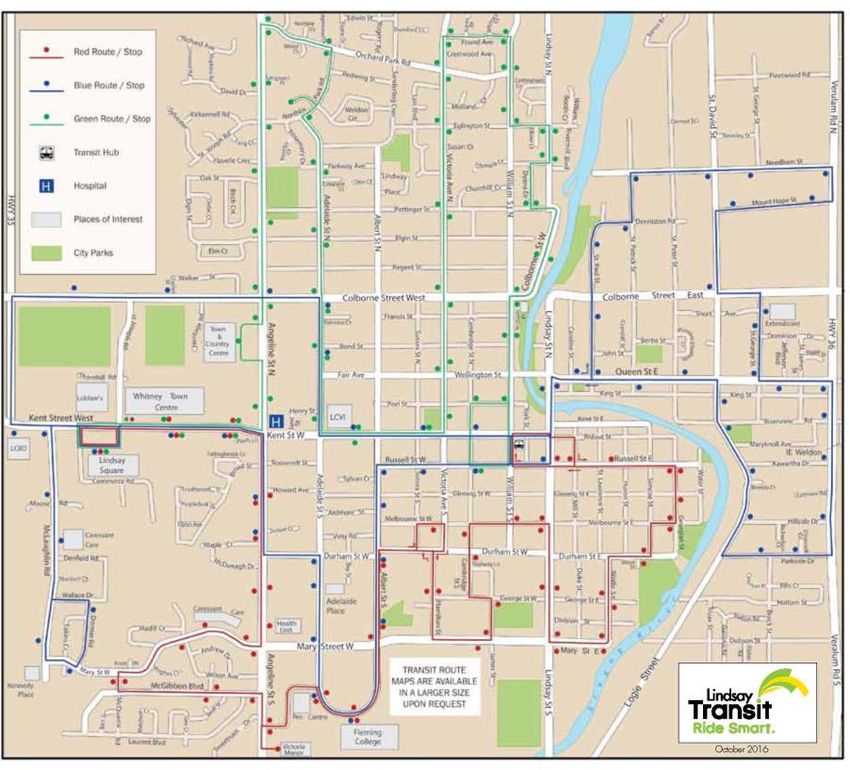
Lindsay Transit is a well-established service that consists of three separate routes as
shown in the figure above. The three routes (Green Route, Red Route and Blue Route)
connect at an on-street transit terminal in the central business district (CBD) of Lindsay
and provide service to the different parts of the community. The service is well utilized
with approximately 100,000 passenger trips carried annually.
1.4.1 Lindsay Transit Service Description
The Lindsay Transit service operates from 07:00 AM to .19:00 PM, Monday through
Saturday. Operating hours, routes and schedule can be found on the Lindsay Transit
website at https://www.kawarthalakes.ca/en/living-here/lindsay-transit.aspx.The Green,
Red and Blue routes are designed to meet at the downtown transit hub every hour, on
the hour with a timed transfer that accommodates transfers between the three routes.
The areas served by each route are as follows:
4|PageCity of Kawartha Lakes 2018 Lindsay Transit Master Plan
▪ The Green Route provides a two-way service along a route that serves the area
of Lindsay north of Kent Street. The outer terminus of the route is at Lindsay
Square, a large commercial mall near the west side of Lindsay and it also
provides service to the hospital and the Town and Country Centre mall.
▪ The Red Route provides a two-way service along a route that serves the area of
Lindsay south of Kent Street, including Fleming College and the hospital. It also
terminates at Lindsay Square at the same time as the Green Route.
▪ The Blue Route consists of two
one-way loops, one serving the
east side of Lindsay and the other
loop serving the west side of
Lindsay. This route provides
service to Fleming College, the
hospital and Lindsay Square.
As can be seen from detailed data
collected by Lindsay Transit staff, there
was an average of 1,969 passengers
Figure 3 - Lindsay Transit 2016 Weekly Averages
carried weekly. Monthly averages
deviated from -13.8% to +16.1%. Variations exist due to weather conditions and, in part,
the lack of service on statutory holidays.
In September 2017, the downtown transit hub was relocated from William Street to
Victoria Avenue, just south of Kent Street. This new location has designated stops for
each of the routes with a shelter and benches providing weather protection. This
location also has an increased length of curb space for stopped buses providing
improved manoeuvrability for the buses entering and leaving stops and increased safety
of patrons.
The three routes have designated on-street stops at regular intervals with bus stop
marker signs at all stops indicating the route using that stop. Most bus stops have pads
connecting from the curb to sidewalk and many busy stops also have bus shelters
provided. At Lindsay Square the three routes operate into the mall property to a bus
stop adjacent to the building front. The Green Route currently operates into the Town
and Country Centre property to a bus stop adjacent to the building and the Red Route
5|PageCity of Kawartha Lakes 2018 Lindsay Transit Master Plan
currently operates into the Victoria Manor to an internal bus stop that enables buses to
turn around.
On-board observations, coupled with bus operator discussions revealed the following
with respect to the reliability of each of the routes:
▪ Green Route has minimal recovery time, which results in buses being late on
most trips
▪ Red Route buses are sometimes late
▪ Blue Route buses are rarely late
▪ Traffic delays, circuitous routing and route deviations onto private properties (e.g.
seniors’ residences) were cited as the primary cause of late buses
The minimal recovery time built into the bus schedules needs to be increased to
approximately five minutes per trip to allow for timely transfers between buses. This can
be addressed through a route re-design that limits deviations while still maintaining
reasonable walk distances to bus stops.
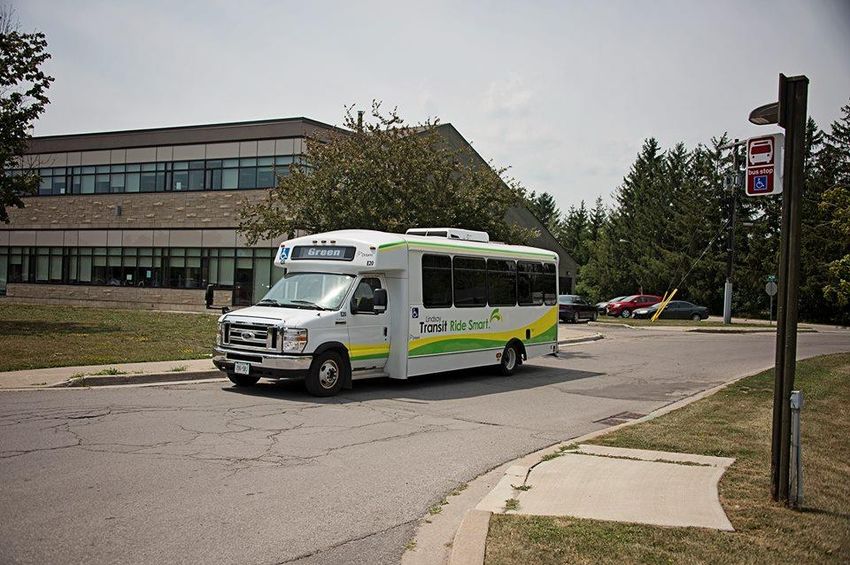
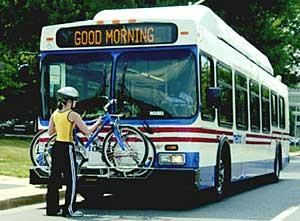
1.4.2 Lindsay Transit Fleet
The Lindsay Transit bus fleet consists of
Ford Model 4500 low-floor buses with
wheelchair ramps to accommodate people
with mobility devices. These buses
accommodate up to 20 seated passengers
plus standees and two rear-facing
wheelchair positions. These buses are
capable of accommodating the peak Figure 4 - Lindsay Transit Bus
passenger demand and manoeuvre well on
the local streets in Lindsay. Fleet Services reported that the service life of these buses
can be as high as 10 years since the improvements to the maintenance program has
proven effective. Fares are collected with mechanical fare boxes mounted near the
Operator position.
The 11-bus Transit and LIMO fleet is allocated as follows:
▪ 2 undergoing preventative maintenance and other repairs
▪ 1 bus allocated as an operating spare (a mandatory requirement to maintain
service in case of in-service breakdowns)
6|PageCity of Kawartha Lakes 2018 Lindsay Transit Master Plan
▪ 3 buses utilized daily (1 red, 1 green and 1blue)
▪ 1 bus set aside for charter services
▪ 4 buses allocated to LIMO service (up to 3 in-service plus one spare)
Since the Lindsay Transit and LIMO buses are identical, buses can be used in both
services, which have proven to maximize fleet flexibility and reliability.
1.4.3 Other Transit Services
There are several inter-municipal transit services that operate within or through the City
of Kawartha Lakes, as follows:
▪ GO Transit has two inter-regional bus routes operating through the municipality:
o GO Route 81 operates along Highway 12 between Whitby GO Station and
Beaverton four trips in each direction on weekdays and weekends. This
route is located approximately 28 kilometres west of Lindsay and just
outside of Kawartha Lakes boundaries.
o GO Route 88 Operates along Highway 115 between Trent University in
Peterborough and the Oshawa GO Station with service approximately
every two hours in each direction on weekdays and weekends. This route
stops at the Highway 35 and Highway 115 Park and Ride facility about 35
kilometres south of Lindsay, approximately 1.5km outside of Kawartha
Lakes boundaries.
▪ Can-Ar Coach Service provides daily bus service between Haliburton and
Toronto (Union Station Bus Terminal) with several stops within Lindsay as well
as Fenelon Falls. It operates an inbound trip in the morning and an outbound trip
in the afternoon on weekdays and Saturdays with a different trip schedule on
Sundays.
▪ Fleming College operates a shuttle bus service between the Sutherland campus
(Peterborough) and the Frost campus (Lindsay) with a morning and afternoon
round trip on weekdays, Saturdays and Sundays. This service is funded by the
Frost campus students through a fee added to the regular tuition fee and is not
open to the public at the present time. Frost campus students ride free on this
service with a stickered student ID card and other Fleming College students and
staff can ride the service by purchasing a pass.
7|PageCity of Kawartha Lakes 2018 Lindsay Transit Master Plan
1.5 Description of LIMO Service
Lindsay Mobility Specialized Transit or LIMO as it is known to its customers and
residents, is the division of Lindsay Transit that provides demand-response specialized
transit service. Similar to Lindsay Transit, LIMO operates from 7:00am – 7:00pm on
weekdays and Saturdays. There is no service on Sundays or statutory holidays. Hours
of operation, application form, and fares can be found on the LIMO Transit website at
https://www.kawarthalakes.ca/en/living-here/accessible-and-specialized-transit.aspx
LIMO is directly operated by the City, using up to three low-floor buses similar to the
vehicles operated by Lindsay Transit on its three bus routes. LIMO drivers are part-time
employees, as are Lindsay Transit drivers. LIMO staff provide trip booking, scheduling
and dispatch services. Vehicles are owned and maintained by the City at the transit
facility located at the Public Works Garage on Little Britain Rd.
Approximately 75 % of LIMO passenger trips are regular ‘subscription’ bookings, and 20
% are ‘casual’ trips booked at least 2 hours before the requested trip time. An
estimated 5% per cent are ‘on-demand’ trips booked on the day of service.
Unaccommodated requests for trips are less than 1 per cent of all trips, which indicates
that service capacity is adequate to meet the demand for service.
1.5.1 Communities Served
LIMO serves residents within the Town of Lindsay boundaries, as does Lindsay Transit
with identical transit fares. Specialized demand-responsive transit service beyond the
Lindsay city limits is provided by City of Kawartha Lakes Community Care.
1.5.2 Route and Service Design
LIMO is operated as a completely in-house municipal service. This service design
provides maximum control over service quality and reliability, since the City hires, trains,
and manages the performance of all personnel. It was observed by the consulting team
that LIMO vehicles are in a high state of repair and cleanliness. Drivers are well-trained
and provide excellent, friendly service.
The City of Kawartha Lakes uses essentially the same type of vehicle for both
conventional and specialized transit – 24 to 26-foot low floor, ramp-equipped accessible
vehicles. This approach simplifies vehicle maintenance and spare parts inventory, and
8|PageCity of Kawartha Lakes 2018 Lindsay Transit Master Plan
provides operational flexibility, since LIMO and Transit vehicles can be easily adapted to
fill equipment needs of the other service.
LIMO is presently in the process of installing a state-of-the-art specialized transit
scheduling software product with a view to improving scheduling productivity and
reducing the level of effort necessary to produce statistical reports on LIMO service.
As is commonly the case with specialized transit services, LIMO trips must be booked in
advance by a registered passenger. LIMO trips are mainly regular subscription trips
(75%). Trips booked before the day of travel account for 20%, while 5% of trips are
delivered on the same day they are requested.
LIMO’s subscription trip percentage, at 75%, is significantly higher than other services in
its population peer group, which average about 50%. Although the high ratio of
subscription trips relieves LIMO passengers and LIMO Dispatch of the need to book
repeating trips individually, which saves time and effort, the disadvantage is that
relatively little service is available to accommodate requests for casual trips. However,
since LIMO reports that less than 1% of trip requests are not accommodated, this does
not appear to be a problem. This was confirmed by customers/participants in this study.
There was an average of
1,135 LIMO passengers
carried each month in
2016. Monthly averages
deviated from -14.5% to
+16.9% with the highest
months of use being, as
expected, during the
inclement winter and
spring months.
Variations exist due to
weather conditions and, Figure 5 - LIMO Total Monthly Passengers 2016
in part, the lack of
service on statutory holidays.
1.5.3 LIMO Eligibility
Passengers must meet LIMO eligibility criteria and be registered to use the service.
Eligibility criteria include being unable to board or use a conventional transit bus.
9|PageCity of Kawartha Lakes 2018 Lindsay Transit Master Plan
Currently there are approximately 350 registered passengers, of which about half are
considered active (having used the service within the past year). Of the active
passengers, other than personal care attendants, one third use a wheelchair or scooter,
and two thirds are ambulatory.
1.6 Community Care (outside of Lindsay)
1.6.1 Community Care Transportation
Specialized Transit service outside Lindsay is provided by Community Care City of
Kawartha Lakes (CCCKL), which is a health and community support agency. CCCKL is
financially assisted by the Local Health Integration Network, and by its own fundraising
initiatives. It provides volunteer-based rides, professionally-driven specialized transit,
and non-emergency patient transfers. Community Care Transportation’s mandate is to
provide service to older adults and people with special needs, including those with
physical disabilities.
There is also a working partnership between the City and CCCKL as customers are
regularly referred between services and the City provides links on its website to
Community Cares services. (www.ccckl.ca/services/transportation/)
CCCKL provides service seven days per week from 6:00 am to 10 pm., using a fleet of
professionally-operated wheelchair-accessible vans, supplemented by volunteer drivers
who operate their personal vehicles. Eligibility criteria are ‘older adults and people with
special needs’. There is no restriction on trip purpose. A per kilometre or flat rate is
charged per ride depending on the pickup and destination locations. Travel must be
booked at least 12 hours in advance.
CCCKL has comparatively low operating costs. The MTO Specialized Transit Fact Book
for 2010 (the most recent published data)1, lists Total Expenses Per Passenger as
$13.07, which was 25% below the provincial average for its population group of less
than 50,000 population. Its revenue to cost ratio was 27%, versus 21% for its population
group. Relatively low operating costs are likely the result of the low-cost structure of a
registered charity, the use of some volunteer drivers, and the absence of a collective
bargaining unit for paid drivers.
10 | P a g eCity of Kawartha Lakes 2018 Lindsay Transit Master Plan
1.6.2 Service Considerations
If Lindsay Transit decide to offer public transit to areas outside of Lindsay, it is the
consultants’ understanding, based on Ontario Regulation 191/11, section 45 (2), cited
below, that it would not be required to offer LIMO service beyond Lindsay. Community
Care Transportation (CCCKL) is already providing specialized transit in those areas.2
However, Lindsay Transit may have to enter into an agreement with CCCKL to
harmonize fares between the two services. Lindsay Transit should seek guidance on
this from the Ontario Accessibility Directorate.
Since Lindsay Transit vehicles are fully accessible, any service it provides beyond the
town limits would provide an additional travel option for people with disabilities, available
without prior reservation. This would be a positive development.
1.6.3 Eligibility considerations
AODA regulations require that, as of January 1, 2017, eligibility criteria for specialized
transit consider the range of disabilities, including cognitive disability. If and when
Lindsay Transit offers conventional transit beyond Lindsay, it would have to ensure that
CCT eligibility includes people with cognitive and other non-physical disabilities.
O. Reg 191/11 Integrated Accessibility Standards 45. (1) states” “… A conventional
transportation service provider that does not provide specialized transportation services
shall ensure that any person with a disability… is provided with an alternative accessible
method of transportation. (2) Subsection (1) does not apply where specialized
transportation services are provided by a specialized transportation service provider in
the same jurisdiction where the conventional transportation service provider provides
transportation services. O. Reg. 191/11, s. 45 (2).”
1.6.4 Summary of Specialized Transit Service
LIMO does a very good job of complementing the Lindsay Transit service within the
Lindsay urban area while communities outside Lindsay and within the City of Kawartha
Lakes are provided with specialized transit through Community Care. While Lindsay
11 | P a g eCity of Kawartha Lakes 2018 Lindsay Transit Master Plan
Transit use has grown over the last several years, LIMO has grown at a quicker pace
(80% from 2011 to 2015). It is expected that this will continue as the population ages.
It is worth noting that if Lindsay Transit’s fixed route service is expanded to serve residents
outside of Lindsay in the future, demand-responsive specialized transit service will also
need to be expanded to accommodate identical service hours under AODA legislation.
As the average age of the population continues to increase and residential and
commercial development continues to grow, it can be surmised that additional resources
(fleet and staffing) will be required.
12 | P a g eCity of Kawartha Lakes 2018 Lindsay Transit Master Plan
2. Phase I: Existing Transit Environment
A comprehensive review of existing Lindsay Transit and LIMO services was undertaken
by Transit Consulting Network to assess service operating performance and to
understand community-wide expectations and priorities to improve the services offered
today. The data analyzed and feedback received was instrumental in providing an
updated policy framework to guide the development of a transit service plan over the
next 10 years.
2.1 2011-2015 Lindsay Transit Report Card and Peer
Review
2.1.1 2011-2015 Lindsay Transit Report Card
The Canadian Urban Transit Association (CUTA) has kept records of individual transit
systems and their performance across Canada since the late 1970’s when transit
systems began reporting data annually. The data is summarized in annual editions of
the Canadian Urban Transit Fact Book. This mature database has evolved over the
years, is consistent, and is designed for industry professionals.
The data was analyzed for two purposes:
▪ To measure how Lindsay Transit performance has changed over a 5-year 2011-
2015 period
▪ To compare key 2015 Lindsay Transit performance metrics in relation to its peer
group
In summary, Lindsay Transit’s performance has shown improvement over the 2011-
2015 period in terms of transit ridership growth, which has resulted in Lindsay Transit
being more efficient than the peer group average.
13 | P a g eCity of Kawartha Lakes 2018 Lindsay Transit Master Plan
Figure 6: 2011-2015 Lindsay Transit Performance Data quantifies the change in
performance over the five-year period.
Figure 6 - Lindsay Transit Report Card
2.1.2 2015 Lindsay Transit Peer Review
Comparisons were made of the various operating, service performance and financial
data with eight other Ontario transit systems serving similar sized communities. Caution
must be exercised when comparing peer review statistics since the peer review only
provides a high-level assessment of transit service levels and costs in other comparable
jurisdictions. The data requires careful interpretation based on industry experience as
well as knowledge of the different transit systems.
The criteria guiding the selection of peer review jurisdictions for comparison purposes
with the City of Lindsay were Ontario municipalities with a transit service population
below 40,000 and similar community characteristics. It should be noted that transit
system performance across Ontario can vary significantly due to factors such as:
▪ Local labour costs
▪ Municipally operated versus contracted services
▪ Climate and topography
▪ Local bus fare policies
▪ High school student transportation policies (yellow school bus versus public
transit)
▪ Local financial commitment to transit
▪ Proximity to the GTA
Ten (10) Ontario municipal jurisdictions were selected and the 2015 data is illustrated in
Table 3 below. Since transit operating environments can vary significantly, direct
comparisons between one jurisdiction and another should not be made.
14 | P a g eCity of Kawartha Lakes 2018 Lindsay Transit Master Plan
Figure 7 - Lindsay Transit 2016 Peer Review Table
2.1.3 Assessment of Lindsay Transit Performance
2.1.3.1 Transit Ridership and Service Hours
As can be seen in Figures 8 and 9, transit use grew by an impressive 21.3% from 2011
to 2015, which can largely be attributed to the 33.8% increase in the amount of service
provided during the same period.
Figure 8 - 2011-2015 Transit Ridership Figure 9 - 2011-2015 Revenue Vehicle
Hours
To quantify the relative amount of service provided by Lindsay Transit, the Service
Hours per Capita measure has been developed in the industry. This is simply the
number of annual hours of revenue service divided by the service area population.
These have been summarized in Figures 10 and 11.
15 | P a g eCity of Kawartha Lakes 2018 Lindsay Transit Master Plan
Figure 110 – 2011-2015 Lindsay Figure 101 - 2015 Peer Group Revenue
Transit Revenue Vehicle Hours per Vehicle Hours per Capita
Capita
Lindsay Transit provided 0.74 hours of service
per capita in 2015, 27.6% more than in 2011. The significant jump from 2014 to 2015
can be explained by a reduction of the service area population when a pilot project to
serve outlying communities was eliminated. This is an indication that the City of
Kawartha Lakes places a higher emphasis on public transportation, which bodes well
for its economic competitiveness and the quality of life in the community. In the future,
and as population grows, it is not unreasonable to plan for 1.0 or more revenue hours
per capita to better meet resident and business needs. This could be achieved with
Sunday service and later evening service to establish transit as a preferred mode of
choice.
2.1.3.2 Lindsay Transit Efficiency
Transit systems across Canada use the Revenue Passengers per Hour of Service
statistic as one measure to quantify transit efficiency and to help determine when to
increase or modify service. Figures 12 and 13 illustrate Lindsay Transit’s efficiency from
2011 to 2015 and in comparison, to its peer group, respectively.
Figure 12 - 2011-2015 Passengers per Figure 13 - 2015 Peer Group Passengers per
Hour Hour
16 | P a g eCity of Kawartha Lakes 2018 Lindsay Transit Master Plan
The slight reduction in service efficiency of 9.3% from 2011 to 2015 can be attributed to
the service expansion in 2013. Although 23% below the average of the peer group in
2015, this can be attributed to more service hours being provided than other transit
systems (i.e. 0.74 service hours per capita versus 0.4 service hours of the peer group
average). Ultimately, there are transit ridership growth strategies that can be
implemented to increase transit efficiency, which is a continuous improvement initiative.
Transit ridership growth will occur in response to service increases; however, it takes
time to improve transit efficiency. For example, if service hours are increased to
accommodate more work shifts, households may opt to eventually eliminate the need
for that 2nd or 3rd car.
2.1.3.3 Lindsay Transit Service Effectiveness
A key measure of a transit system’s effectiveness is how many trips are taken annually
based on the population served in a given year, which is expressed in the industry as
Revenue Passengers per Capita. This is calculated using the total passengers carried
in a given year divided by the population reported. If transit ridership growth exceeds
population growth then service is deemed to be more effective and as such, transit
becomes a more integral component of urban travel.
Figure 14 –2011-2015 Lindsay Transit Figure 15 – 2015 Peer Group Revenue
Revenue Passengers/Capita Passengers/Capita
Figure 14 clearly shows that Lindsay Transit’s effectiveness has improved by a very
significant
15.3% from 3.93 trips per capita in 2011 to 4.53 trips per capita in 2015. It also exceeds
the Ontario peer group average of 3.2 passengers per capita in 2015 by an impressive
41.6%. This is, of course, largely attributed to the fact that the City of Kawartha Lakes
provides more service hours on a per capita basis.
17 | P a g eCity of Kawartha Lakes 2018 Lindsay Transit Master Plan
2.1.4 Lindsay Transit Financial Indicators
A key metric that transit systems use to track financial performance is the direct cost per
hour of service. This can vary significantly between transit systems due to differences in
operating environments. A more important comparison would be to look at individual
transit system performance over time to identify trends while a peer group comparison
provides an opportunity to determine whether or not a transit system is in line with the
norm.
Figure 16 – 2011-2015 Lindsay Transit Figure 17 - 2015 Peer Group Cost/Hour
Cost/Hour
Figure 16 illustrates that Lindsay Transit’s $81.87 hourly cost in 2011 increased by
27.3% when compared to 2015 and is 64% higher than the average of the peer group
transit systems. This can be attributed to a number of factors:
▪ LIMO and Conventional transit costs are combined which has inflated
conventional bus costs by 33%. These costs should be separated moving
forward to give an accurate costing per hour for each service
▪ Air bags associated with the wheelchair ramp unexpectedly require replacement
every 2 years year (5 out of 10 buses each year had air bags replaced)
▪ Higher level of suspension repair work due to road surface conditions in some
areas
▪ All maintenance is undertaken in-house and is closely monitored to ensure
vehicle breakdowns are minimized and buses are cleaned thoroughly
▪ Bus life is extended from a recommended 5-year life cycle to 10 years, which
requires transmission rebuilds after 5 years (Note: capital budget reduced
accordingly)
▪ MTO audits were implemented for 5 years beginning in 2012, which necessitated
a more stringent maintenance program than would normally be required
18 | P a g eCity of Kawartha Lakes 2018 Lindsay Transit Master Plan
Transit system wage rates, operating environments, topography, etc. can vary
significantly across Ontario and as such, the hourly cost of service should not be
compared directly with any individual transit system.
To address the higher maintenance cost issue, future bus purchases will eliminate the
need for air bags and the MTO audits will be completed in 2017. On the positive side,
Transit Consulting Network investigated the 2015 cost for fuel. In 2015, municipalities
with less than a 50,000-service area population spent, on average, $14.38 per vehicle
hour on fuel (predominantly diesel) while Lindsay Transit’s gas engines consumed only
$6.46 per hour in fuel ($7.90 less per hour). It is also noted that the operating cost per
vehicle hour has been reduced by about 6% in 2015 compared to the costs in 2014.
Figure 168 - 2011-2015 Lindsay Figure 19: 2015 Peer Group Average Fare
Transit Average Fare
The average fare calculation is the total number of passengers paying a fare upon
boarding divided by the total revenue received. The higher the concession fare
discounts offered for tickets and passes and discounts offered to various groups such
as seniors, the lower the average fare will be. To off-set the 27.3% increase in hourly
transit costs in 2015 versus 2011, the average fare paid by Lindsay Transit passengers
increased by a nominal 10%. Although the average fare paid by Lindsay Transit
passengers is 30% higher than the peer group average in 2015, the higher fare could
be justified since all of the peer group transit systems had fewer hours of service on a
per capita basis. It is worth noting that there has been no increase in bus fares from
2011 to 2015. Although unpopular, fare increases or changes to fare pricing policies
(discussed later in this report) are better justified when service is expanded.
19 | P a g eCity of Kawartha Lakes 2018 Lindsay Transit Master Plan
A municipality’s commitment to transit is reflected by the quality of the transit service
(i.e. service reliability) and the quantity of the transit service provided (i.e.. hours of
service per capita), which is dictated by the financial resources made available. The Net
Investment per Capita is a high-level measure of the local municipal investment in
transit that is calculated by dividing the total municipal contribution through taxes by the
population served by transit.
Figure 20 – 2011-2015 Lindsay Transit Net Figure 21 - 2015 Peer Group Net Investment Per
Investment Per Capita Capita
As shown in Figure 20 there have been variations over the 2011-2015 period in terms of
the City of Kawartha Lakes municipal contribution (net investment) per capita. When
service expanded in 2013, the net cost per capita decreased from $40.65 per capita in
2012 to $23.94 per capita in 2013 since the number of residents being served had
increased. The number of people reported as being served in 2015 then decreased to
20,354, which explains the jump in the net investment per capita to $34.92 in 2015.
Going forward, the population served in 2016 is now in line with the number of residents
served in 2015.
As expected, given the higher hourly cost discussed earlier, combined with relatively
higher levels of service, the City of Kawartha Lakes contributed 2.6 times per capita
than the average value of the peer group. This is not expected to be the case in the
longer term since many municipalities such as the Town of Fort Erie and Town of
Wasaga Beach in the Kawartha Lakes peer group have taken initiatives to expand
service. In the opinion of Transit Consulting Network, many municipalities are playing
catch-up in order to better meet resident and business needs in an effort to grow their
tax base.
20 | P a g eCity of Kawartha Lakes 2018 Lindsay Transit Master Plan
2.1.5 Summary of Report Card and Peer Review
Based on the Report Card and Peer Review findings, Lindsay Transit has made
significant progress from 2011 to 2015 with the key metric being that Lindsay Transit
has become more effective at meeting community needs since the City has invested
accordingly and needs to continue to invest in Transit. Although the statistics reflect well
on the performance of Lindsay Transit, they do not necessarily mean things should not
change. At the staff level, efforts are underway to reduce maintenance costs, grow
transit ridership and meet the changing needs of the public and to do so in a fiscally
responsible manner.
2.1.6 2012-2016 Lindsay Transit and LIMO Ridership
A separate review of the 5-year Lindsay Transit and LIMO ridership was undertaken for
the more recent 2012-2016 period to help identify a trend in overall public transportation
demand.
Figure 22 - 2012 - 2016 Lindsay and LIMO Ridership
There was a 22.1 % growth in total transit demand from 2012 and 2016 while the
service area population grew by only 7.2% based on population reported by the City to
the MTO for dedicated transit gas tax funding submission. For every 1% in population
growth, the public transportation demand grew by 3%. This clearly signals that transit is
far more effective; however, the notable statistic is that LIMO demand increased from
9% of the total demand to 13%. Since the cost per passenger to transport a specialized
transit customer is far more than a Lindsay Transit customer, it will be prudent to ensure
Lindsay Transit is a mode of choice for eligible LIMO registrants.
2.2 Community Engagement
2.2.1 Lindsay Transit Survey
Prior to initiating the Transit Master Plan study, the City of Kawartha Lakes had
undertaken a community 16-question survey in the spring of 2017 that was completed
21 | P a g eYou can also read