The Influence of Water Scarcity and Drought on the Lindis River, Central Otago - Jessie Loft
←
→
Page content transcription
If your browser does not render page correctly, please read the page content below
The Influence of Water Scarcity and Drought
 on the Lindis River, Central Otago.

 Jessie Loft
 Thesis completed in partial fulfillment of the Master of Science Degree
Abstract
Water scarce situations are a critical issue in water resource management. Water scarcity can be exacerbated
by drier than usual conditions (such as drought), and separating the effects of water scarcity and drought
can be difficult. This study investigates the relative importance of water scarcity and drought on the
availability of water in the Lindis River (Central Otago, New Zealand). The Lindis catchment is a tributary
of the Clutha River and frequently becomes disconnected in the summer months. To determine the extent
to which these extreme low flows are driven by abstractions versus the naturally dry conditions that occur
in summer, a two-step hydrological modelling procedure was employed. First, the HBV-Light hydrological
model was developed for the upper Lindis. This model is then applied to the lower Lindis, to provide an
indication of what ‘natural’ flow should be in the lower catchment. Comparison of the modelled (natural)
river flow record with the observed (anthropogenic + natural) river flow record suggested that summer river
flow in the lower Lindis is substantially lower than it would be in the absence of human abstraction.
Anomaly analysis indicates that the ‘natural’ Lindis River would not disconnect from the Clutha River from
January-March, and would only have rare short disconnection events in December and April, in comparison
to their frequent occurrence in reality. As such, the results of this study have the potential to provide vital
information for the on-going management of flow in this catchment.

 ii
Acknowledgements

I would like to express my gratitude to my supervisors, Dr. Daniel Kingston and Dr. Sarah Mager, whose
expertise, understanding, and especially patience, encouraged me and steered me in the right the direction.
I doubt that I will ever be able to convey my appreciation fully, and this accomplishment would not have
been possible without them. Thank you to you both.

A very special recognition goes out to my family and friends for their motivation and encouragement that
pushed me through the process of completing this thesis and my studies. I must acknowledge their
support through the many times I vented because of frustration, without this I would not have finished.

In conclusion, I recognize that this research would not have been possible without the data supplied from
the Otago Regional Council and the support of the Geography Department at the University of Otago.

 Jessie Loft

 iii
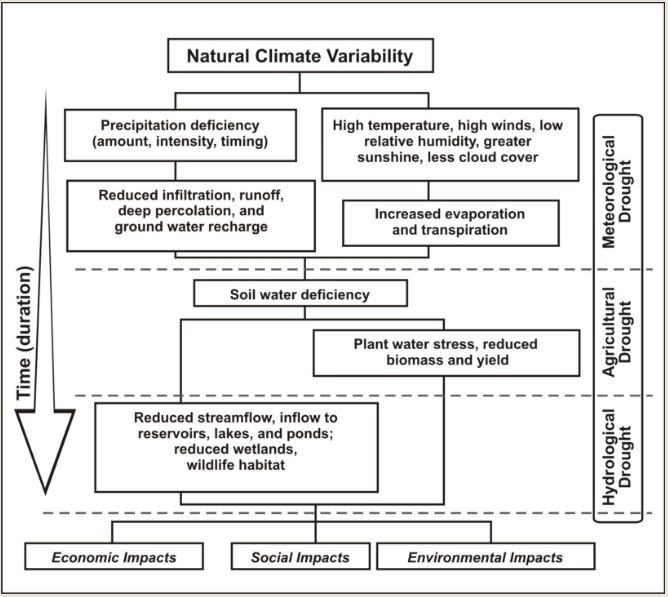
Table of Contents
Table of Contents ----------------------------------------------------------------------------------------------------------- iv
1 Introduction ---------------------------------------------------------------------------------------------------------- 1
 1.1 The Lindis Catchment ------------------------------------------------------------------------------------------------- 1
 1.2 Research Aims ---------------------------------------------------------------------------------------------------------- 2
2 Theoretical Review: Meteorological and Anthropogenic Influences on Water Availability -------- 4
 2.1 Introduction ------------------------------------------------------------------------------------------------------------- 4
 2.2 Global context ---------------------------------------------------------------------------------------------------------- 4
 2.2.1 Water Availability and Consumption -------------------------------------------------------------------- 5
 2.3 Drought ------------------------------------------------------------------------------------------------------------------ 6
 2.3.1 Drought Detection, Prediction and Impacts------------------------------------------------------------ 8
 2.4 Human Influence on Water Availability -------------------------------------------------------------------------- 9
 2.5 Drought and Water Scarcity---------------------------------------------------------------------------------------- 11
 2.6 Water Availability in New Zealand ------------------------------------------------------------------------------- 13
 2.7 Key Research Challenges-------------------------------------------------------------------------------------------- 16
 2.8 Summary ---------------------------------------------------------------------------------------------------------------- 17
3 Study Area and Methods -----------------------------------------------------------------------------------------18
 3.1 Study Area -------------------------------------------------------------------------------------------------------------- 18
 3.1.1 Regional Setting ---------------------------------------------------------------------------------------------- 18
 3.1.2 Characteristics of the Study Area ------------------------------------------------------------------------ 21
 3.1.3 Climate and Hydrology ------------------------------------------------------------------------------------- 22
 3.1.4 Management of the Lindis River ------------------------------------------------------------------------- 24
 3.1.5 Importance of the Study Area ---------------------------------------------------------------------------- 25
 3.2 Methods ---------------------------------------------------------------------------------------------------------------- 27
 3.2.1 The Input Data and Data Sites ---------------------------------------------------------------------------- 28
 3.2.2 Evaporation Data -------------------------------------------------------------------------------------------- 29
 3.3 The HBV Model -------------------------------------------------------------------------------------------------------- 30
 3.3.1 Lindis and Ardgour Calibration and Validation ------------------------------------------------------- 32
 3.4 Identification of Low Flow ------------------------------------------------------------------------------------------ 36
 3.5 Summary ---------------------------------------------------------------------------------------------------------------- 38
4 Results ---------------------------------------------------------------------------------------------------------------39
 4.1 Introduction ------------------------------------------------------------------------------------------------------------ 39
 4.2 Model Performance -------------------------------------------------------------------------------------------------- 39

 iv
4.2.1 Lindis Peak ----------------------------------------------------------------------------------------------------- 39
 4.2.2 Ardgour Road ------------------------------------------------------------------------------------------------- 42
 4.3 Low Flow Analysis ---------------------------------------------------------------------------------------------------- 48
 4.4 Meteorological Conditions Associated with Low Flow ------------------------------------------------------ 56
 4.5 Summary ---------------------------------------------------------------------------------------------------------------- 61
5 Discussion-----------------------------------------------------------------------------------------------------------63
 5.1 Introduction ------------------------------------------------------------------------------------------------------------ 63
 5.2 Low Flow ---------------------------------------------------------------------------------------------------------------- 63
 5.2.1 Lindis Peak Evaluation -------------------------------------------------------------------------------------- 63
 5.2.2 Ardour Rd Summer vs. Winter---------------------------------------------------------------------------- 64
 5.3 Characterization of Low Flow -------------------------------------------------------------------------------------- 65
 5.4 Implications of Low Flow ------------------------------------------------------------------------------------------- 68
 5.4.1 Negative effects on the Lindis River --------------------------------------------------------------------- 68
 5.4.2 Developments for Lindis River ---------------------------------------------------------------------------- 69
 5.5 Summary ---------------------------------------------------------------------------------------------------------------- 72
6 Conclusion ----------------------------------------------------------------------------------------------------------74
7 Reference List ------------------------------------------------------------------------------------------------------77
8 Appendix A ---------------------------------------------------------------------------------------------------------86

 v
List of Tables
Table 3.1: Flow statistics for the Lindis River at the Lindis Peak and Ardgour monitoring sites. (Both sets
of statistics were created from the Technical Data in the Otago Regional Council website
http://www.orc.govt.nz/Utils/Search/?whole=true&query=lindis). ------------------------------------------------- 26
Table 4.1: Model performance criteria and five performance intervals used to categories the goodness of a
given model (Taken from Henriksen et al., 2003). ---------------------------------------------------------------------- 40
Table 4.2: The Nash Sutcliffe, Log-Nash Sutcliffe and Root Mean Square Error values for Lindis Peak
monthly data (Created from runoff data the Otago Regional Council website Technical Data and runoff
output from the HBV light Hydrological Model). ----------------------------------------------------------------------- 40
Table 4.3: Mean monthly average runoff for Winter and Summer (in red) daily data (Created from runoff
data the Otago Regional Council website Technical Data). ----------------------------------------------------------- 44
Table 4.4: Low Flow Event Dates. ------------------------------------------------------------------------------------------ 48
Table 4.5: Precipitation cumulative average vs. Monthly Total Average for Low Flow Events (Created from
NIWA Cliflo website meteorological data at Wanaka Airport). ----------------------------------------------------- 60
Table 4.6: Departure from Mean Monthly Temperature (°C) for Low Flow Events (Created from NIWA
Cliflo website meteorological data at Wanaka Airport). --------------------------------------------------------------- 60
Table 5.1: The resulting cause of the low flow events on Ardgour Rd from 2007-2014. ---------------------- 67

 vi
Table of Figures
Figure 2.1: Drought propagation and the resulting impacts of meteorological, agricultural and hydrological
drought (Source: Wilhite et al., 1996). -------------------------------------------------------------------------------------- 7
Figure 2.2: Drought propagation in the Anthropocene. Shows how integrated human influences are in the
drought system. (Taken from Van Loon et al., 2016). ------------------------------------------------------------------ 13
Figure 2.3: Regional variations in the use of allocated water for 2010 (Taken from: MfE, 2010). ---------- 15
Figure 2.4: Changes in regional weekly allocation (Mm3/week) between 1999, 2006 and 2010 (Taken from
MfE, 2010). ----------------------------------------------------------------------------------------------------------------------- 16
Figure 3.1: Land Use Cover of the Lindis valley and the location of the river (Taken from ArcGIS Land
use Cover) ------------------------------------------------------------------------------------------------------------------------- 19
Figure 3.2: The Lindis River location within Central Otago with the meteorological, Wanaka weather
station and runoff sites Ardgour Rd and Lindis Peak (Taken from ArcGIS Land use Cover) ---------------- 20
Figure 3.3: Digital Elevation Model of the Lindis valley in m (Taken from ArcGIS Land use Cover) ---- 21
Figure 3.4: Comparison of Ardgour and Lindis River seven day mean annual low flow (Created from runoff
data the Otago Regional Council website Technical Data). ----------------------------------------------------------- 22
Figure 3.5: Precipitation isohyet developed for the Lindis River (Source ArcGIS Land use Cover). ------ 23
Figure 3.6: Meteorological Data from 1993- 2014 for the Lindis Basin area (Created from data taken from
Wanaka airport meteorological data in NIWAs Cliflo website) ----------------------------------------------------- 23
Figure 3.7: Monthly river flow for Lindis Peak and Ardgour Rd gauging stations (Created from Ardgour
and Lindis flow recorded data Technical Data in the Otago Regional Council website
http://www.orc.govt.nz/Utils/Search/?whole=true&query=lindis). ------------------------------------------------- 26
Figure 3.8: Conceptual model of research methodology --------------------------------------------------------------- 27
Figure 3.9: HBV- Light hydrological model (Adapted from Dariane and Javadianzadeh, 2016). ----------- 31
Figure 3.10: Illustration of threshold levels; a) fixed threshold b) monthly varying threshold c) daily varying
threshold. (Source: Hisdal et al., 2000).------------------------------------------------------------------------------------ 36
Figure 4.1: The calibration (A) and validation (B) Lindis Peak flow duration curves for the monthly data.
(Created from runoff data the Otago Regional Council website Technical Data). ------------------------------ 39
Figure 4.2: Lindis Peak Monthly Discharge from 1993 to 2010 showing observed runoff relative to the
HBV-light simulated flow (Created from runoff data the Otago Regional Council website Technical Data
 --------------------------------------------------------------------------------------------------------------------------------------- 41
Figure 4.4: Ardgour Rd Calibrated and Validated Mean monthly Means for Observed and Simulated Data
(Created from runoff data the Otago Regional Council website Technical Data). ------------------------------ 43
Figure 4.5: Winter Ardgour Rd Daily runoff for 2007 to 2013 showing the Simulated HBV light runoff
against the Observed Data. Dashed lines are placed along the breaks in the time series. (Created from runoff
data the Otago Regional Council website Technical Data). ----------------------------------------------------------- 46
Figure 4.6: Daily Simulated HBV- light runoff and Observed Summer runoff compared for 2007 to 2014.
Dashed lines are placed along the breaks in the time series. (Created from runoff data the Otago Regional
Council website Technical Data). ------------------------------------------------------------------------------------------- 47
Figure 4.7: The flow connection value placed on simulated and observed flow at Ardgour Rd (runoff Y axis
changed to 3 mm), showing times of low flow 2007 to 2014 according to the 0.0821 mm d-1 threshold. - 50
Figure 4.8: HBV light Simulated runoff and Observed runoff for the disconnected events (a-i) (Created
from runoff data the Otago Regional Council website Technical Data).------------------------------------------- 53
Figure 4.9: The runoff which could be used for consumption for the surrounding area (Created from runoff
data supplied from Otago Regional Council Technical Data). ------------------------------------------------------- 55

 vii
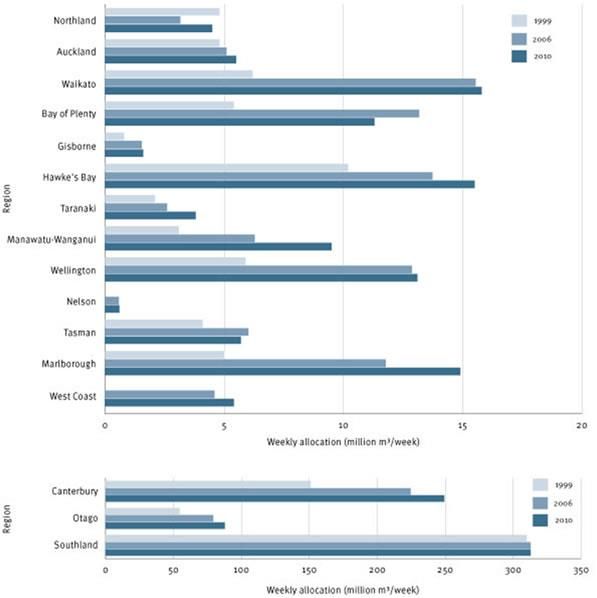
Figure 4.10: Daily Discharge and Precipitation data for individual Low flow Events to show the relationship
between meteorological and precipitation data (A-H). Event C has two low flows placed together (Created
from runoff data the Otago Regional Council website Technical Data and meteorological Data from
Wanaka Airport NIWAs Cliflo website). ---------------------------------------------------------------------------------- 59

 viii
1 Introduction
Many environmental, economic and social factors influence how we use our land and, in turn,
different land uses (human activities or economic functions that occur on land) can affect the
environment, economy and society in different ways (MfE, 2010). Half of New Zealand’s land area
is covered with low and high producing grasslands, majority used for agriculture, and in some cases,
uses irrigation to sustain growth (MfE, 2010). Intensification of agriculture is an on-going and
accelerating process that threatens the sustainable management of fresh water (Moller, 2008). Over
the past 20 years irrigation in New Zealand has doubled, and there are predictions that it could double
again in the next 20 years (Davie, 2009). The issue of water scarcity in New Zealand (unheard of 20
years ago) has led to many investigations on the viability of water storage to supplement rivers during
the dry summer period (Davie, 2009).

Droughts are caused by variation in weather, typically leading to a lack of precipitation to a region,
while water scarcity is initiated by water demand when there is insufficient water available in the
area to balance out water use. Water scarcity is not natural but instead due to management and land
use practices (Mehta, 2003). Water scarcity and drought are often linked together physically and
publically. People perceive both phenomena as the same due to their similar effects, and physically
both events subside when there is an adequate increase of available water (Mehta, 2003). The similar
effects of water scarcity and drought hampers the implementation of policies and measures to deal
with the drivers and pressures of the two phenomena (Schmidt and Benitez, 2013).

There is a lack of scientific knowledge on distinguishing between water scarcity and drought as both
of their effects are relatively similar (Schmidt and Benitez-Sanz, 2013). It is important to quantify,
and separate, the effects of water scarcity and drought as without the separation it is impossible to
identify the dominant factors for runoff changes (Zeng et al., 2014). Management plans can be put
into place for water scarcity, however, droughts can only be adapted to (Van loon and Van Lanen,
2013). If human activities are the major driving factor, current hydroclimatic data could continue to
be used for water use planning, and policymakers could then focus on water resource management
and projection (Bao et al., 2012). However, if meteorological climate variability is the dominant
factor it is essential to study future projections on water resources so management plans can be put
into place (Bao et al., 2012).

1.1 The Lindis Catchment

The Lindis River is located in the Central Otago Region, New Zealand. Historically the Central Otago
area was affected by natural and human-induced fires, which reduced the natural forest that populated

 1
the area, so when Europeans arrived in New Zealand, tussock grasslands covered two-thirds of Otago
(Department of Conservation, 2006). It varies in elevation from 220 masl in the lower catchment to
1,925 masl in the headwaters. The surrounding environment is dominated by high plain sheep
farming and other agriculture practices including beef farming, deer farming and viticulture in the
lower Lindis, and in recent years an increase in lifestyle blocks and residential uses.

The upper Lindis River receives a substantial amount of precipitation, around 800-1500 mm per year
(ORC, 2010). In contrast, the lower Lindis River is one of the driest areas in New Zealand and
receives as little as 300 mm per year. The catchment is also affected by extremely dry periods due to
heavy water extraction from the Lindis River. Flow becomes so diminished that the river cannot run
into the Clutha/Mata-Au River, particularly in the summer months. This low flow adversely affects
in-stream ecology as well as irrigation takes.

The Lindis River is locally important due to the need for the freshwater to support the wellbeing of
the community and the livelihood of the agricultural sector surrounding the area. Given the high
value and use of the Lindis River, as well as its ecosystem service (trout spawning and fish passage),
it is essential that future management is directed to sustainable flow. A particular challenge to
understanding the sustainable allocation of the Lindis River runoff is disentangling the causes of
natural low flow conditions as a consequence of the climatic/hydrologic conditions, and those that
are exacerbated by anthropogenic water takes.

The frequent low flow events are causing high trout motility rates (around 70%). This is due to the
lack of effective water cover for the trout species and resulting predation (Trotter, 2016). The Lindis
River is used as a haven for trout from the Clutha River and a major spawning and rearing system
which is important for trout population (Trotter, 2016). The Otago Regional Council have proposed
a minimum flow of 900 l s-1 , however, this level is seen to be problematic as it will not provide
adequate habitat for fish or fish passage (Rekker, 2016). Cawthron Institute using RHYHABSIM
model showed that habitat suitability for low flow in a midsized river need to have a water depth of
>600 l s-1 for fish passage (Hayes et al., 2016). The amount of surface water lost to ground water
downstream of Ardgour Rd flow monitor has been estimated to vary between 400-500 l s-1 (Rekker,
2016). This means there needs to be a minimum of 1000 l s-1 monitored at Ardgour Rd for a
functioning ecosystem, a flow connection between Lindis River and Clutha/ Mata- Au River, and
this is still the bare minimum (Rekker, 2016).

1.2 Research Aims

The study aims to investigate the relative importance of water scarcity and droughts on the
availability of water in the Lindis River, Central Otago. The aims of the study are to establish:

 2
1. What extent are low flow periods in the Lindis River associated with meteorological
 conditions?
 2. How much extra water could there be in the absence of abstraction?
 3. Whether drought, or water scarcity is the main contributor to the lack of water in the Lindis
 River?
 4. How much runoff can be used for consumption?

To determine the largest influence on low flow a ‘naturalized’ runoff situation is created, which then
is compared to the observed runoff so low flow times can be determined as anthropogenically or
climatically influenced. A hydrological model is a conceptual representation of real world processes
and can be used to understand hydrological processes by simulating dicharge. The hydrological
model HBV-Light is used to simulate a natural river flow for the lower River catchment by first
simulating river flow for the upper ‘untouched’ river catchment. This is so the natural flow can be
compared to the observed flow to determine times which are affected by human influence in the
lower river. A bare minimum flow connection (1000 l s-1) between the lower Lindis and the
Clutha/Mata-Au River is used as the threshold to finds times of low flow. These low flow times are
either due to water scarcity or drought, and will be further investigated by looking at meteorological
data.

 3
2 Theoretical Review: Meteorological and
 Anthropogenic Influences on Water Availability
2.1 Introduction

This chapter will cover the broad background of water scarcity, drought, water availability and
consumption in a global context (Section 2.2). In Section 2.3 drought definitions, causes,
implications and management will be introduced, while Section 2.4 introduces the concept of water
scarcity and how humans influence the hydrological cycle. Section 2.5 explains the links and
differences between water scarcity and drought. Section 2.6 introduces water availability and the
hydrological cycle in New Zealand. The key research challenges will be described in Section 2.7,
and finally, Section 2.8 will summarize the chapter.

2.2 Global context

At the global scale the hydrological cycle is strongly connected to atmospheric circulation, which is
driven by the unequal heating of the Earth’s surface and atmosphere (Oki, 2011). The hydrological
cycle is a dynamic system of rain, runoff and evaporation with enormous temporal and spatial
variations, as well as variations in water quality that completely govern its value to people and
ecosystems (Rijsberman, 2006). Precipitation is the principle source of water supply for most regions
on earth, so if there is a change in amount or space this can have drastic effects for the environment
and communities. There is an on-going need to understand and predict extreme events, especially
due to the increasing influence that anthropogenic activities have on earth systems (in this study the
focus is on stream flow).

The hydrological system, the ecological system, the social system and the climate system are all
interlinked, and understanding these relationships is fundamental to the management and mitigation
of low flow (Van Loon et al., 2016). Water systems have natural inflows and outflows and water
availability varies and changes in time and space, as do anthropogenic influences on these water
systems, leading to what some have called the ‘hydrosocial’ cycle (Van Loon et al., 2016). In a
constantly changing world where there is increasing water use for intensified agriculture, industry
and increasing population there is a need to quantify the dominant effects on river flow so the
ecological stability can be in a healthy state (Ahn and Merwade, 2014).

Water is a very complex resource, not only does it occur in three states (liquid, solid, vapour) it is
also a precious and necessary resource for all living organisms. Running water is essential to

 4
humankind and has become magnets for human settlement, resulting in very few river catchments
that are not anthropogenically modified in some way (Malmqvist and Rundle, 2002). Water is a
renewable resource (although finite), however with constant human influence and resulting
contamination it is generating into a restricted resource. For example humans have had to create
desalination plants to tackle the growing need for water, when realistically there is more need to
protect the water which we have rather than ‘create’ more.

2.2.1 Water Availability and Consumption
2.2.1.1 Human Influence

Globally humans use over 50% of all renewable freshwater (although there could be an additional
amount by capturing flood waters and increasing water storage) and there is a concern that future
water supplies will limit agricultural and industrial production due to the projected growth in
consumptive use (Srinivasan et al., 2012). Humans have been able to manage water by developing
infrastructure (dams) and other methods so the dependency on nature for water is not that large
(especially in large cities) (Srinivasan et al., 2012). Rivers are not large storage areas compared to
other reserves, however, due to their recycling speed they have become an important renewable and
sustainable resource for human use and the surrounding environment (Oki, 2011).

The increase in population worldwide has resulted in a significant increase in water demand over the
past decades due to expanded irrigation areas and economic development (De Graaf et al., 2014). As
a result, an increasing number of rivers run dry for substantial periods of the year before reaching
the sea (De Graaf et al., 2014). Regions with frequent water stress usually exploit groundwater as
an additional resource to meet water demands. In many regions groundwater abstractions often
exceed the groundwater recharge, causing groundwater depletion, resulting in negative effects on
rivers which are groundwater fed (De Graaf et al., 2014). The amount of pressure on natural systems
due to human influence will result in profoundly negative ecological effects at local and regional
scales, possibly irreversible (Malmqvist and Rundle, 2002).

2.2.1.2 Climate Influence

Stream flow is controlled by various natural factors, such as precipitation, temperature and catchment
characteristics (Tran and O’Neill, 2013). Water availability varies depending on its state in the
hydrological cycle (e.g. solid, liquid, gas), across time and space, as well as biophysical factors e.g.
climate, season and temperature (Mehta, 2003). Observed warming over the past several decades
globally has been linked to changes in the large-scale hydrological cycle e.g. changing spatial and
inter-decadal precipitation patterns, flood and drought intensity and extremes (reduced snow cover
and melting of ice) and changes in soil moisture and runoff (Bates et al., 2008). Climate model
 5
simulation have predicted wet areas to get wetter and dry areas get dryer for the 21st century (Bates
et al., 2008).

The ability of hydrological systems to adjust to extreme climate events and to respond without stress
and damage declines as conditions become more extreme (Salinger and Griffiths, 2001). For
example, drought impacts the agricultural sector by reducing the number of days available for
irrigation and plant growth (Salinger and Griffiths, 2001). There is more than 25% of agricultural
crops globally which grow in water-stressed areas (Taft, 2015), and the entire crop can be in jeopardy
when there is a water stress condition during critical growth as it decreases the crops yield (Singh et
al., 2014). In all probability the worst situation with regard to water management is a drought in the
low-flow season in an arid climate that additionally suffers from water scarcity (Van Loon, 2015).

Drought materialises when an area has established a reduction in normal precipitation which then
begins the positive feedback mechanism of the drought cycle (Mishra and Singh, 2010). This cycle
occurs due to the moisture depletion from the upper soil layers which decreases evapotranspiration
rates, it lessens the atmospheric relative humidity and results in less probable rainfall for locally-
generated rainfall, as there is less relative humidity to reach saturation point (Mishra and Singh,
2010). Only disturbances which carry enough moisture into the dry region will be able to provide
rainfall (Mishra and Singh, 2010).

2.3 Drought

The region and the purpose of the study has to be taken into account when coming up with drought
definitions e.g. meteorological climates and water availability varies between regions, so drought
characteristics will also vary. Drought to the farmer means a shortage of moisture in the root zone to
grow crops (Panu and Sharma, 2002). To the hydrologist, it suggests below average water levels in
streams, lakes, and reservoirs. (Panu and Sharma, 2002). To the economist, it means a negative
effect on the economy (Panu and Sharma, 2002). Droughts can occur in all climatic zones e.g. high
and low rainfall areas, and is initiated by a reduction in the amount of precipitation compared to the
normal amount for an extended period of time (Mishra and Singh, 2010). Although there are many
types of drought with different characteristics and, therefore, different definitions, there is a need to
investigate as each type affects certain sectors (Hisdal et al., 2000).

In comparison to drought there is typically more information on the different drivers and
modifications that cause the development of a flood and its interactions between natural and human
processes (Van Loon et al., 2016). There is a need to distinguish drought conditions for each region,
as each region has different characteristics e.g. climate, precipitation, evaporation, if the factors that

 6
initiate onset can be distinguished it may be possible to manage and mitigate the negative effects.
The time for drought recovery is dependent on its intensity, the more intense the drought the longer
the area affected will take to recover (DeChant and Moradkhani, 2015).

Meteorological drought is caused by a lack of precipitation over a region for a period of time, which
then propagates into an agricultural drought, which refers to a period with declining soil moisture,
as there is no surface water resources; resulting in crop failure (Mishra and Singh, 2010).
Hydrological drought is the last stage of drought propagation and relates to a period with inadequate
surface and subsurface water resources for a hydrological system (Mishra and Singh, 2010). Figure
2.1 explains drought propagation and the different types of droughts consequences. A meteorological
drought is dependent on large scale atmospheric drivers which usually covers a large area, while a
hydrological drought is more dependent on local catchment characteristics (Van Loon, 2015).

Figure 2.1: Drought propagation and the resulting impacts of meteorological, agricultural and hydrological
drought (Source: Wilhite et al., 1996).

 7
Consequences of a hydrological drought may include reducing water supply for drinking water,
irrigation, industrial needs and hydropower production, causing death of fish and hampering fish
passage (Fleig et al., 2006). Hydrological drought affects many sectors and people making it a major
threat due to the range it can negatively affect (Van Loon, 2015). For this study drought is defined
as hydrological drought, which is a temporary natural phenomenon due to lower than average
precipitation values leading to a lower than average amount of runoff (Schmidt and Benitez-Sanz,
2013. Paulo and Pereira, 2006. Van Huijgevoort et al., 2012. Dai, 2011).

2.3.1 Drought Detection, Prediction and Impacts

Droughts are slow to initialize and often only recognized once already established, which is why they
are called the ‘creeping disaster’, they affect large areas and are of long duration (Paulo et al., 2005).
The impact of a drought is potentially disastrous for the affected region and trying to forecast a
drought is extremely difficult; both the beginning and end, without careful monitoring of the potential
development (Paulo et al., 2005). Low flow occurrence is also very hard to predict as it is very
changeable, as water shortage depends on factors that change seasonally, for instance precipitation,
temperature, evapotranspiration, snow cover, and yearly (e.g. series of dry and wet years)
(Tomaszewski, 2014).

Hydrological droughts affect various people and sectors on a large scale, water is needed for all
aspects of life and, therefore, there is a need to mitigate the effects and inform the public and water
managers of strategies that can assist in these situations (Van Loon, 2015). To do this understanding
historical droughts in the catchment of interest and the impacts during these periods is important for
planning and management (Mishra and Singh, 2010). The duration and extent of drought has
significant impacts on the local economy, society and environment and due to this increasing
research is being undertaken to investigate and predict droughts, monitoring, risk assessment and
understanding the characteristics (Van Loon and Van Lanen, 2012).

Worldwide, from the 1960s to the 1980s economic damages attributed to natural disasters tripled
(US$40 billion to US$120 billion) (Wilhite, 2000). Natural disaster economic losses between 1992
and 1996 in the United States averaged US$54.2 billion per week (Wilhite, 2000). Drought
economic, social, and environmental costs and losses are growing dramatically, although it is
difficult to quantify due to the lack of reliable historical estimates of losses (Wilhite, 2000). In 1975
drought losses due to average annual crops in the Great Plains region of the United States were
roughly US$700 million (Wilhite, 2000).

 8
Understanding drought propagation (meteorological drought into soil moisture and hydrological
drought) is essential for adequate water resources management, because drought forecasting and
understanding of an upcoming meteorological drought can be proactively managed to mitigate
resources to protect agricultural and water sources (Van Lanen, 2013). While short term durations
(months) is important for agriculture, long term durations (season or years) is important for water
supply management, water resources planning, and hydrological studies (Dogan et al., 2012).

Drought is hard to anticipate and even harder to predict its ending which is why it has attracted the
interest of numerous researches and scientists (Tigkas et al., 2012). Meteorological drought is
determined in terms of rainfall deficits, however, in the short term the amount of rainfall occurring
is a poor indicator of agricultural and hydrological drought as it does not take into account initial
ground conditions or seasonal evaporation variations (Tate and Gustard, 2000). Definitions including
a fixed number of dry days in sequence have been largely superseded by methods describing
departures from the mean e.g. the threshold level (Tate and Gustard, 2000). Furthermore, indices
based on precipitation alone cannot capture all relevant propagation processes (Van Loon, 2015).

The Palmer Drought Severity Index (PDSI) was developed by Palmer in 1965, and has been used in
various countries. The PDSI includes precipitation, temperature and soil moisture in a water balance
model (Palmer, 1965). The underlying process is related to the accumulated weighted differences
between actual precipitation and the precipitation requirement, and takes into account the current
weather, soil conditions and the normal climate of the area (Tate and Gustard, 2000). The
Standardized Precipitation Index (SPI) is one metric used because it requires fewer data
requirements, can be used for any time period, and easy to understand (Mckee et al., 1993). It can
calculate a precipitation deficit for an area, therefore, it is able to detect a drought condition (Mckee
et al., 1993).

2.4 Human Influence on Water Availability

Runoff is a natural phenomenon but due to catchment processes and anthropogenic factors
(irrigation, water diverting, and dams) runoff amounts and pathways have been modified in many
instances (Chen et al., 2013). These developments in controlling surface and groundwater by way
of diverting surface water, and groundwater pumping have often been undertaken without conserving
the natural resource (Paulo and Pereira, 2006). For example between 1960 and 2000 global water
withdrawal increased 17% per decade (Wada et al., 2011). Although there is an abundance of
freshwater at the global scale it is difficult to determine if this is enough for the population and
environment, e.g. if water is scarce in the physical sense (a supply problem) or it should be used and
conserved better (a demand problem) (Rijsberman, 2006).

 9
Physical water scarcity is defined as a temporary water imbalance caused by consumption being
significantly higher than the natural renewable availability of surface and ground water (Van Loon,
2015. Mehta, 2003. Haddadin, 2001. Pereira et al., 2002. Schmidt and Benitez-Sanz, 2013). It is
brought on by the increased demand of water resources by society. This water imbalance can be
further aggravated by water pollution due to human influences and drought periods. It results in the
altered carrying capacity of the ecosystem due to the disturbed and reduced land use, reduced
reservoir capacity, a lack of freshwater resources for the environment and society and can result in
the death of water species and ecosystems. Throughout this study water scarcity is equivalent to
physical water scarcity as no economic water scarcity analysis is undertaken.

Society’s answer to low flow in the short term is often to extract more water and implement small
water saving measures e.g. one shower a day, no garden watering, while in the long term
infrastructure is created to increase water storage, policies and regulations of water use are can also
be implemented (Van Loon et al., 2016). Human decisions on water sources for water security at the
local scale are causing environment stress at the global scale (Vörösmarty et al., 2013).
Anthropogenic influences on water sources are causing water to become scarce, not only in arid and
drought prone areas but also in areas where there is an abundance of rainfall (Paulo and Pereira,
2006).

Water scarcity can be characterized by the Water Exploitation Index (WEI), which calculates the
annual ratio of total freshwater abstraction to the total renewable resource (Van Lanen, 2013). It
indicates on a spectrum if a water resource is under water stress to severe water stress, which reflects
unsustainable use of the water resource (Van Lanen, 2013). National estimates, however, do not
reflect the extent and severity of water scarcity at the river basin scale (Van Lanen, 2013). This is
because there is a need to look at the local scale rather than looking at the country wide estimates,
each river catchment is unique and, therefore, each catchment needs to be treated as an individual,
as each catchment reacts to stress differently.

There is also a need to understand the causes for water scarcity so measures can be undertaken to
deal with the main problem and mitigation can be commenced so there is enough water left for all
sectors (Paulo and Pereira, 2006). A region may be abundant with water storage at present, however,
with the changing climate and human influences there is a need for water managers to start managing
water now for the future (Young, 2014). Irrigation practices significantly influence the climate and
hydrology patterns not only at local scales but also at regional scales (Kustu et al., 2010).

 10
2.5 Drought and Water Scarcity

Droughts and water scarcity both significantly affect the environment (terrestrial and freshwater
ecosystems, air, soils), the economy (agriculture and water uses), and society (public water supplies,
welfare, recreational activities, cultural and aesthetic values) (Schmidt and Benitez-Sanz, 2013).
Water scarcity and drought exist whenever and wherever the links in the water cycle are broken or
destabilized, therefore, upsetting the balance of water (Bandyopadhyay, 1987).

Land change alters the hydrological processes due to anthropogenic influence and modifies
evaporation, infiltration, surface runoff and storage of water (Van Loon et al., 2016). This
anthropogenic activity is not taken into account for drought development and shows that human
activities and meteorological conditions are disconnected (Van Loon et al., 2016). There is a interlink
between meteorological and human effects and in order to manage low flows there is a need to
understand that human influence is as important as natural climate variability. Human activities have
impacted almost all parts of the globe, so much so that hydrological and human systems are now
fundamentally combined.

Climate change is expected to change precipitation patterns, and at present, climate variability
changes the spatial and temporal distribution of water resources, which is aggravated by human
activities (Lansigan, 2009). Low precipitation and the consequence of low flow can have severe
effects on the environment with species and ecology suffering, furthermore the lack of water in the
river, can cause a disconnected river which can lead to fish species being stranded or schools being
disjointed (Hisdal et al., 2000). Low flow affects water and food security, the sustainability of
agricultural production systems, livelihoods and environment (Lansigan, 2009). The naturalization
of water scarcity leads to negative association and continued human activities e.g. the water table
might continue to decline if the decrease in ground water storage is attributed to climate change
rather than to uncontrolled extraction (Mehta, 2003).

The problem with distinguishing between drought and water scarcity is the effects are so similar, and
is not helped by water managers, the public, and the media using these terms as the same mechanism
(Schmidt and Benitez-Sanz, 2013). To indicate whether there is water stress, managers rely on
variables such as; climate, precipitation, runoff, population density, and aquifer characteristics, land
use and biodiversity, suggesting that a water crisis is driven by geospatial factors (Srinivasan et al.,
2012). Therefore, scarcity is made out to be a natural factor and ignores the anthropogenic impacts
on water sources (Mehta, 2003).

The definitions of water scarcity and drought are often perceived to be the same; they are a constant
threat for most places, both cause below then normal river flow, both subside if there is an increase

 11
in water to feed water flow. Perception and awareness of water scarcity is important, as the perception
of water scarcity can be problematic as it is the recognition of water availability, whereas, awareness
deals with the actual impact of water availability (Tang et al., 2013). Each person’s surroundings
also influence the perception and awareness of a crisis, for example farmers in semi-arid China’s
Guanzhong plain do not perceive water as scarce, although they are aware of the water shortages,
and, therefore, choose to blame this lack of water on climate rather than overuse (Tang et al., 2013).

Globally, increased water abstractions and changes in meteorological conditions have also physically
affected the water regime. Two case studies in highly irrigated and drought prone areas of China and
Spain have been able to differentiate between water scarcity and drought so the main impact on low
flow can be determined. Chen et al., (2013) investigated changes in annual runoff during the period
of 1960–2009 in the Kaidu River Basin, China. They were able to distinguish between drought and
water scarcity; before 1993 there was little human influence in the catchment so this was used as the
naturalized (drought-affected) period while after 1993 was used as the human-induced period
(drought and water scarcity). Van Loon and Van Lanen. (2013) proposed a system to separate
drought and water scarcity effects on the hydrological system in the Upper-Guadiana Basin, Spain;
an observation-modelling framework was used to separate natural (drought) and human (water
scarcity) effects on the hydrological system.

Runoff in the Kaidu River Basin is principally controlled by climate variability rather than human
activities. It was found climate variability was the main factor that decreased runoff with a
contribution of 90.5%, while human activities only accounted for 9.5%. Anomaly analysis was
employed in Spain which found the impact of groundwater abstraction on the hydrological system
was, on average, four times as high as the impact of drought. Therefore, human influence was the
main control on low flow compared to climate. Although in today’s society human activities
influence most of the earth’s systems, climate variability is a major control on water availability by
controlling precipitation and evaporation. The problem arises that different users emphasize different
characteristics of a drought e.g. the farmer emphasizes on how much water can be used for irrigation,
while environmentalists focus on the healthy flow of the river.

Humans have dominated the earth system and through land use change, fresh water abstraction and
increased carbon dioxide release have changed the environment and its ability to adapt. This study
is a clear example of water scarcity and drought on water availability in the Lindis Rver, which
reflects an imbalance between water demand and water supply. Drought is influenced by humans as
they impact water sources with abstraction, irrigation, and dams. Human activities also cause
feedbacks of earths systems being altered and, therefore, a change in precipitation in time and space
(climate change). Management of drought is inefficient because there is a gap in knowledge between
the relationship between people and drought and its feedbacks. Figure 2.2 shows how human

 12
activities have influenced the propagation of drought and that splitting the two influences apart will
cause more confusion as they are interrelated. Although drought may be a mixture of human and
climate feedbacks, water scarcity is principally due to human activities.

 Figure 2.2: Drought propagation in the Anthropocene. Shows how integrated human influences are in the
 drought system. (Taken from Van Loon et al., 2016).

2.6 Water Availability in New Zealand

New Zealand's location in the general atmospheric circulation determines its general temperature and
precipitation characteristics, however, its orography plays a dominant role, and due to high
topography it forces precipitation patterns through the country, so there is no general relationship
between temperature and precipitation trends (Salinger, 1979). New Zealand’s complex orography
gives distinctive regional climatic responses to variations in atmospheric circulation e.g. ‘El Niño-
Southern Oscillation' (Salinger and Porteous, 2014).

El Niño and La Niña are opposite phases of the ‘El Niño-Southern Oscillation' (ENSO). They disrupt
normal patterns of wind and rainfall (NIWA, 2016). In New Zealand La Niña have different impacts
with more North–Easterly winds bringing moist, rainy conditions to the North–East of the North
Island, and reduced rainfall to the South and South–West of the South Island (NIWA, 2016). During
an El Niño event there is stronger or more frequent winds from the West in summer, leading to an
elevated risk of drier-than-normal conditions in East coast areas and more rain than normal in the
West (NIWA, 2016). Therefore, some areas, such as central Otago and South Canterbury, can
experience drought in both El Niño and La Niña (NIWA, 2016).

Geography and water resources are quite dissimilar throughout the country, for example, the average
annual rainfall in the South Island is 346 mm per annum on the leeward side of the Southern Alps,

 13
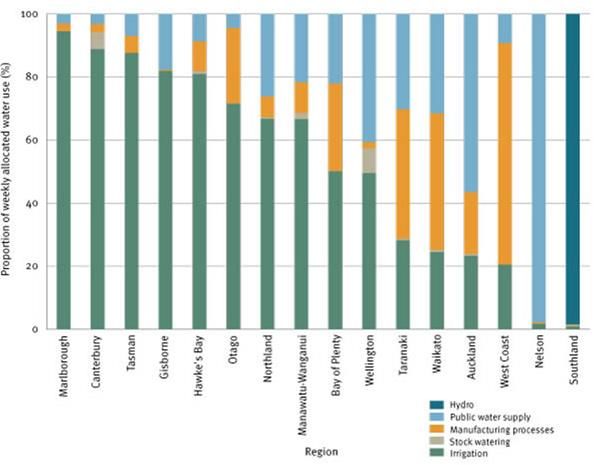
while on the windward side there is in excess of 6000 mm per annum (Davie, 2009). Drought tends
to be regional due to the catchment characteristics and its reaction to climate patterns (Salinger and
Porteous, 2014), (particularly on the East Coast of the North Island, and in Marlborough, Canterbury
and Central Otago), and these are predicted to increase due to climate change (MAF, 2009).

There has been a changing climate of increased drying and high latitude moistening over the Southern
mid-latitude through the last half century (Fyfe et al., 2012). Temperature and rainfall in New
Zealand is localized, however, there is an increasing trend of temperature in most regions as well as
a decrease of rainfall (Zonderland-Thomassen et al., 2014). This has resulted from increased
anthropogenic emissions rather than the natural climate variability in the Southern mid-latitude
region (Fyfe et al., 2012). Therefore, human activities have caused a change in climate in this latitude
which will result in changing precipitation patterns.

New Zealand has relatively low annual water stress levels, however, during summer New Zealand
farmers experience limited water availability due to low rainfall combined with anthropogenic
influences (e.g. reduced stream flows, reduced groundwater levels, water restrictions or lack of
irrigation water availability) (Zonderland-Thomassen et al., 2014). Agriculture is responsible for
about 75% of water usage in New Zealand (irrigation or livestock) (Davie, 2009). This reflects the
economy of dairy production along with beef cattle and sheep farming (primary production of New
Zealand agriculture) with horticulture (including wine) forestry, tourism (secondary production)
(Davie, 2009). The value of livestock, cropping and dairy farming for New Zealand’s economic
activity has increased from nearly 2.7 billion in 1991 to 5 billion in 2007 (MfE, 2010). Agriculture
is a major water user and there is a prominent relationship between livestock, water use and the
subsequent water contamination (Figure 2.3).

 14
Figure 2.3: Regional variations in the use of allocated water for 2010 (Taken from: MfE, 2010).

In New Zealand the freshwater demand environmental indicator reports on the volumes of water
allocated to human use through resource consents, which is known as total consumptive water
allocation (MfE, 2010). In 2010 the total amount of consumptive water allocation in New Zealand
was 27 billion cubic meters (MfE, 2010). In 2010 the majority of consumptive weekly allocation for
irrigation was 46% (Figure 2.2) (MfE, 2010). Most of the allocated water for consumption in
Canterbury and Otago is for irrigation, with Canterbury, Southland and Otago regions account for
86% weekly (MfE, 2010). Water use has nearly doubled since 1999 and increased by 10% in the last
4 years (Figure 2.4) (MfE, 2010). This increase can be explained by the demand for irrigation, as the
amount of land irrigated by consented water takes has increased by 82% between 1999 and 2010
(MfE, 2010).

 15
Figure 2.4: Changes in regional weekly allocation (Mm3/week) between 1999, 2006 and 2010 (Taken from
MfE, 2010).

2.7 Key Research Challenges

There is a need to understand the relationships that natural and anthropogenic influences have on the
flow regime and the associated affects this has on the ecosystem. It is difficult to determine in times
of low flow what are the effects of natural and/or anthropogenic flow responses and, therefore, a
need to determine the signs of either an anthropogenically-led low flow or a natural low flow.
Frameworks developed for this purpose could be applied to other regions to help water resource
managers make better decisions for sustainable water use.

There is a gap in current knowledge in New Zealand determining the effects of human activities and
natural influences on low flow. Stream flow is affected by many natural factors and human activities
that diminish water resources. Human activities directly affect the hydrological cycle and potentially
cause projections for future water availability to be vulnerable. This study will contribute to the
understanding of determining between a natural hazard versus anthropogenic activities by
developing a framework to separate the two factors. Distinguishing between water scarcity and
drought is a complex task, however, there is a need to bridge the gap of knowledge in how to
determine between the two effects and how each influences low flow.

The case study, the Lindis River catchment in Otago becomes so diminished in the summer that it
frequently runs dry. The Otago Regional council has proposed a minimum flow of 900 l s-1 ,
however, around 400 l s-1 to 500 l s-1 is lost to ground water in the lower river and there needs to be
>600 l s-1 for fish passage (Rekker, 2016. ORC, 2016). Therefore, there is a need for this study to
 16
determine how frequent the Lower Lindis River has experienced low flow times to determine if water
scarcity or drought is the main influence, therefore, allowing the right management plans to be put
into place.

2.8 Summary

Drought and water scarcity are similar in their effects causing a lack of water. People often attribute
water scarcity to drought, this is due to the fact that people use water during times of drought and
many have no way of replenishing it. However, drought and water scarcity are two different
phenomena that need to be understood for water management. Like the physical processes of
drought, human influences of abstraction and mismanagement of water sources is unceasing, so there
is a need to look at how the two interact with each other.

Separating between climate-induced and human-induced low flow is a major scientific challenge
(Van Loon, et al. 2016). However, if the causes of low flow is determined for a region then
management can focus on adaption to climate induced drought or human induced activities. Attention
needs to be paid to the complex interrelations of these two occurrences as both influence low flow,
there is a need to understand the relative importance of both processes so the right strategies can be
put into place so water sources are managed sustainably (Van Lanen, 2013).

Decision makers balance the need of abstractors and the environment while scientists research the
relationship between river flow and the health of the environment (Acreman, 2005). However,
sometimes the need of the abstractors comes before the environment, which obstructs the health of
the aquatic ecosystems. Rijsberman (2006), believed that there is a need to focus on the improvement
of water sources rather than seeking new systems and supplies as a response to water scarcity.
Therefore, there is a need to determine if water is being mismanaged or the availability of the
resource does not meet the need of the environment and society. Thus creating enough water for all
sectors, for example New Zealand is an agriculturally dominated country and, therefore, river flow
is not only used for livestock watering but also irrigation demand.

 17
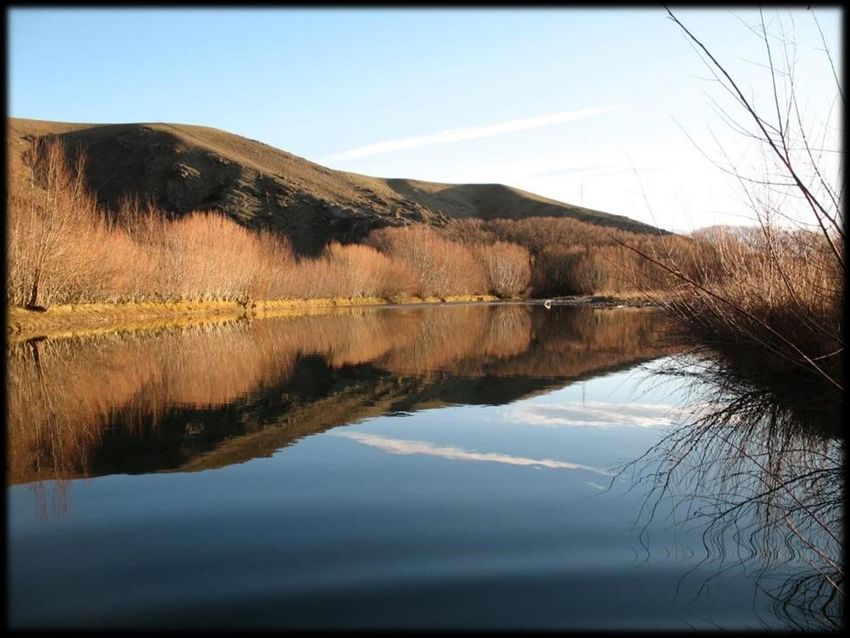
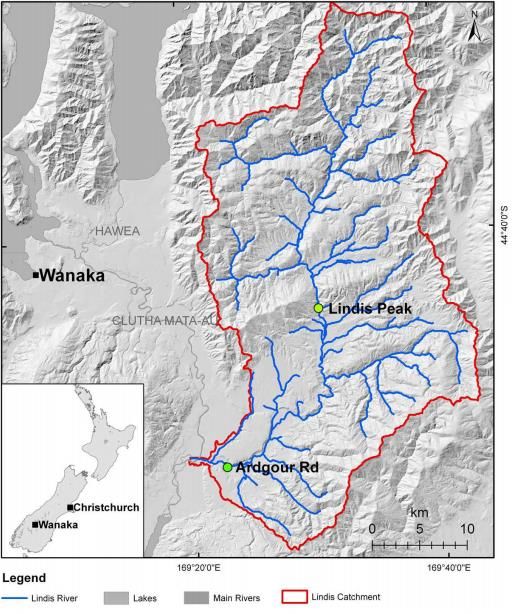
3 Study Area and Methods
3.1 Study Area
3.1.1 Regional Setting

The Central Otago region is gravel-filled and deeply terraced (Cumberland, 1944) with Otago Schist
underlying most of the region (ORC, 2014). The Lindis Pass is the back-country link between Otago
and Canterbury and leads from the Clutha to Waitaki, from the basins of Otago to the Mackenzie
country. This is a wide area enclosed by greywacke mountain walls, with its "fill' consisting of
assorted glacial and fluvial materials (Cumberland, 1944). Soils are sandy and loam-based, with areas
of low to moderate fertility, which range from brown-grey earths in the driest zone (less than 500
mm of rainfall) to yellow-grey earths in the lower mountain slopes, to high-country yellow/brown
earths above 700 m (ORC, 2014). The increasing elevation is associated with decreasing fertility,
and increasing acidity and leaching (ORC, 2014). The daily and seasonal ranges of temperature are
quite extreme for the New Zealand atmosphere with dry winds being frequent, and evaporation is
high, so that the efficiency of the precipitation can be low (Cumberland, 1944).

In lowland Central Otago the short tussock grassland flora includes a small number of native annual
plant species (Walker et al., 1999). Following European settlement in the 1850s, numerous exotic
plants became naturalised in lowland Central Otago including many annual species (Walker et al.,
1999). Annual plants, the seasonally variable climate, and rapid landscape colour changes suggest
that the vegetation of lowland Central Otago undergoes marked seasonal changes (Walker et al.,
1999).

The utilization of tussock grasslands in the semi-arid and sub-humid tussock grasslands of Central
Otago by European sheep farmers began during the 1850s (Mather, 1982). The pre-European
vegetation was steppe grassland with low tussock-grass and the basin plains were treeless
(Cumberland, 1944). Extensive grazing of fine woollen sheep in the region and the destructive
features of burning, overgrazing, and rabbits caused plant destruction (Cumberland, 1944). At
present Grassland and scrub cover most of the area, low tussock and high producing grassland
dominates the lowland basins, while in the highlands tussock and low producing grassland dominant,
the very driest regions have a scab weed vegetation with native and exotic grasses and weeds
scattered throughout (Figure 3.1) (McGlone et al., 1995).

 18
You can also read