WORLD MIGRATION REPORT 2018: IOM Publications
←
→
Page content transcription
If your browser does not render page correctly, please read the page content below
WORLD MIGRATION REPORT 2018:
         CHAPTER 2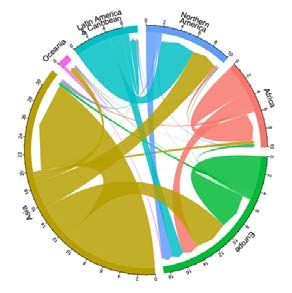
The opinions expressed in the report are those of the authors and do not necessarily reflect the views of the
International Organization for Migration (IOM). The designations employed and the presentation of material
throughout the report do not imply the expression of any opinion whatsoever on the part of IOM concerning the
legal status of any country, territory, city or area, or of its authorities, or concerning its frontiers or boundaries.
All reasonable efforts have been made to ensure the accuracy of the data referred to in this report, including
through data verification. We regret, however, any data errors that may remain. Unless otherwise stated, this report
does not refer to data or events after June 2017.
IOM is committed to the principle that humane and orderly migration benefits migrants and society. As an
intergovernmental organization, IOM acts with its partners in the international community to: assist in meeting
the operational challenges of migration; advance understanding of migration issues; encourage social and economic
development through migration; and uphold the human dignity and well-being of migrants.
Publisher: International Organization for Migration
17 route des Morillons
P.O. Box 17
1211 Geneva 19
Switzerland
Tel.: +41 22 717 9111
Fax: +41 22 798 6150
E-mail: hq@iom.int
Website: www.iom.int
Suggested citation: IOM (2017) ‘Migration and migrants: A global overview’, in IOM (2017) World Migration Report
2018, IOM: Geneva.
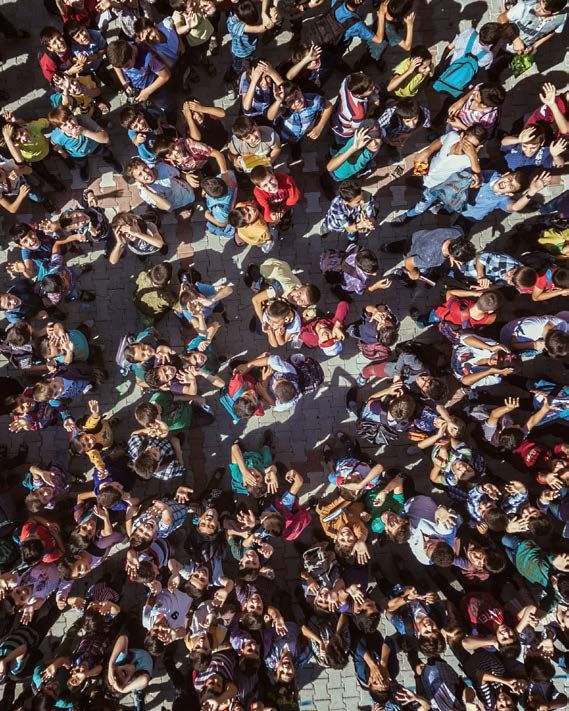
Cover photo: Syrian refugee children get ready for class in Turkey. Many of these children are originally from Aleppo
and escaped the ongoing civil war. Today, the children attend class at the Syrian Social Gathering, a
multi-service centre supported by IOM. The centre provides services to all Syrian refugees, such as free
legal advice for women, adult education in the evenings, and psychosocial care for those who have
undergone traumatic experiences in the Syrian Arab Republic. © IOM (Photo: Muse Mohammed)
© 2017 International Organization for Migration (IOM)
All rights reserved. No part of this publication may be reproduced, stored in a retrieval system, or transmitted in
any form or by any means, electronic, mechanical, photocopying, recording, or otherwise without the prior written
permission of the publisher.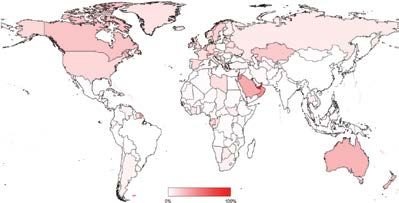
WORLD MIGRATION REPORT 2018                                                                                    1

2                 MIGRATION AND MIGRANTS:
                  A GLOBAL OVERVIEW

Introduction
Human migration is an age-old phenomenon that stretches back to the earliest periods of human history. In
the modern era, emigration and immigration continue to provide States, societies and migrants with many
opportunities. At the same time, migration has emerged in the last few years as a critical political and policy
challenge in matters such as integration, displacement, safe migration and border management. In 2015, there
were an estimated 244 million international migrants globally (3.3% of the world’s population) — an increase
from an estimated 155 million people in 2000 (2.8% of the world’s population).1 Internal migration is even more
prevalent, with the most recent global estimate indicating that more than 740 million people had migrated
within their own country of birth.2

It is important to understand international migration and its various manifestations in order to effectively
address evolving migration dynamics, while at the same time adequately accounting for the diverse and varied
needs of migrants. International movement is becoming more feasible, partly thanks to the digital revolution,
distance-shrinking technology and reductions in travel costs.3 Factors underpinning migration are numerous,
relating to economic prosperity, inequality, demography, violence and conflict, and environmental change.
While the overwhelming majority of people migrate internationally for reasons related to work, family and
study, many people leave their homes and countries for other compelling reasons, such as conflict, persecution
and disaster. Overall, displaced populations such as refugees and internally displaced persons (IDPs) comprise
a relatively small percentage of all migrants; however, they often capture and demand collective attention and
action as they frequently find themselves in highly vulnerable situations. These are the people who are often
most in need of assistance.

This chapter, with its focus on key global migration data and trends, seeks to assist migration policymakers,
practitioners and researchers in making better sense of the bigger picture of migration, by providing an overview
of information on migration and migrants. The chapter draws upon sources of data compiled by the United
Nations Department of Economic and Social Affairs (UN DESA), the Organisation for Economic Co-operation and
Development (OECD), the International Labour Organization (ILO), the World Bank, the United Nations High
Commissioner for Refugees (UNHCR), the Internal Displacement Monitoring Centre (IDMC), the United Nations
Office on Drugs and Crime (UNODC) and the International Organization for Migration (IOM). The chapter provides
an overview of global data and trends on international migrants (stocks) and international migration (flows). It
also provides a discussion of particular migrant groups – namely, migrant workers, refugees, asylum seekers and
IDPs – as well as of remittances. In addition, the chapter highlights the growing body of programmatic IOM data,
particularly on missing migrants, assisted voluntary returns and reintegration, migrant health, resettlement,

1   UN DESA, 2015a.
2   UNDP, 2009.
3   See, for example, chapter 6 of this report on transnational connectivity.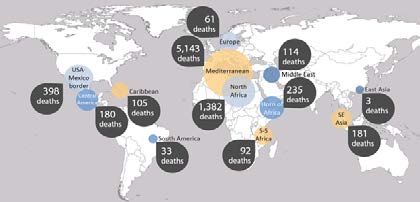
2                                                                                        Migration and migrants: A global overview

displacement tracking, diaspora mapping and human trafficking. While these data are generally not global
or representative, they can provide insights into changes that have occurred in relevant programming and
operations globally. As the United Nation’s new migration agency, with activities relevant to all the themes
discussed in this chapter, IOM has the capacity to provide further insights on migration and its various dynamics,
including the diverse needs of migrants.

This chapter also highlights the challenges in achieving comparability and uniformity in data collection that
make a comprehensive analysis of global migration trends difficult. Recent and ongoing efforts to collect and
improve data have led to an expansion in available migration data. However, issues of fragmentation, and lack
of uniformity and comparability, remain key challenges in developing a truly global picture of all key aspects of
migration.4 Similarly, defining migration and migrants is complex, as discussed in the text box below.

Defining migration, migrant and other key terms

Outside of general definitions of migration and migrant, such as those found in dictionaries, there exist
various specific definitions of key migration-related terms, including in legal, administrative, research and
statistical spheres.a  There is no universally agreed definition of migration or migrant, however, several
definitions are widely accepted and have been developed in different settings, such as those set out in
UN DESA’s 1998 Recommendations on Statistics of International Migration.b

Technical definitions, concepts and categories of migrants and migration are necessarily informed by
geographic, legal, political, methodological, temporal and other factors. For example, there are numerous
ways in which migration events can be defined, including in relation to place of birth, citizenship, place of
residence and duration of stay.c  This is important when it comes to quantifying and analysing the effects
of migration and migrants (however defined). We encourage readers to refer to primary sources cited in
the chapter for information on specific definitions and categorizations underlying the data. A summary of
key technical definitions of migration-related terms is provided in appendix A.

Readers may also find the IOM Glossary on Migration to be a useful reference. The glossary is available
at the IOM online bookstore: www.publications.iom.int/.

a See, for example, Poulain and Perrin, 2001.
b   UN DESA, 1998.
c See, for example, de Beer et al., 2010.

4   In general, explanatory notes, caveats, limitations and methodologies on specific sources of data can be extensive and are
    therefore not included in this chapter. However, sources have been clearly identified so that readers can refer to them.
WORLD MIGRATION REPORT 2018 3
International migrants: numbers and trends
UN DESA produces estimates of the number of international migrants globally. The following discussion draws
on its estimates, which are based on data provided by States.5
The United Nations Recommendations on Statistics of International Migration defines an international migrant as
any person who has changed his or her country of usual residence, distinguishing between “short-term migrants”
(those who have changed their country of usual residence for at least three months, but less than one year) and
“long-term migrants” (those who have done so for at least one year). However, not all countries use this definition
in practice.6 Some countries use different criteria to identify international migrants by, for example, applying
different minimum durations of residence. Differences in concepts and definitions, as well as data collection
methodologies between countries, hinder full comparability of national statistics on international migrants.
Overall, the estimated number of international migrants has increased over the past four-and-a-half decades. The total
estimated 244 million people living in a country other than their country of birth in 2015 is almost 100 million more
than in 1990 (when it was 153 million), and over three times the estimated number in 1970 (84 million; see table 1).7
While the proportion of international migrants globally has increased over this period, it is evident that the vast majority
of people continue to live in the country in which they were born. Most international migrants in 2015 (around 72%)
were of working age (20 to 64 years of age), with a slight decrease in migrants aged less than 20 between 2000 and 2015
(17% to 15%), and a constant share (around 12%) of international migrants aged 65 years or more since 2000.
Table 1. International migrants, 1970–2015
Migrants as a %
Year Number of migrants
of world’s population
1970 84,460,125 2.3%
1975 90,368,010 2.2%
1980 101,983,149 2.3%
1985 113,206,691 2.3%
1990 152,563,212 2.9%
1995 160,801,752 2.8%
2000 172,703,309 2.8%
2005 191,269,100 2.9%
2010 221,714,243 3.2%
2015 243,700,236 3.3%
Source: UN DESA, 2008 and 2015a.
Note: The number of entities (such as States, territories and administrative regions) for which data were made available in the 2015
UN DESA Revision of International Migrant Stock was 213. In 1970, the number of entities was 135.
5 Data are also provided to UN DESA by territories and administrative units. For a summary on UN DESA stock data sources,
methodology and caveats, please see UN DESA, 2015b.
6 UN DESA, 1998.
7 UN DESA, 2008.4 Migration and migrants: A global overview
Snapshot of International Migrants
The international migrant population globally has increased in size but remained relatively stable
as a proportion of the world's population
The proportion of international migrants varies significantly around the world
Note: Names and boundaries indicated on this map do not imply official endorsement or acceptance by IOM.WORLD MIGRATION REPORT 2018 5
244 million international migrants in 2015 out of a global population of 7.3 billion:
1 in every 30 people
52% of international migrants are male, 48% are female
2.7% 70–74 3.6% 6.8% 6.8%
3.4% 65–69 4.1%
4.5% 60–64 5.2%
5.7% 55–59 6.2%
7% 50–54 7.1%
8.3% 45–49 7.9%
9.7% 40–44 8.8%
10.8% 35–39 9.5%
11.2% 30–34 9.9%
10.2% 25–29 9.2%
7% 20–24 6.6%
4.7% 15–19 4.6%
3.9% 10–14 3.9%
3.5% 5–9 3.6%
2.9% 2.9% 0–4 3%
Most international migrants (72%) are of working age (20–64) years
* Age groups above 75 years omitted (male 4.5%, female 6.8%).
Note: Snapshot based on infographics by IOM’s Migration Research Division and Global Migration Data Analysis Centre (IOM,
2017d), which draw on UN DESA data (UN DESA, 2015a).6 Migration and migrants: A global overview
Europe and Asia hosted around 75 million migrants each in 2015 – 62 per cent of the total global international
migrant stock combined (see figure 1). These regions were followed by North America, with 54 million
international migrants in 2015 or 22 per cent of the global migrant stock, Africa at 9 per cent, Latin America
and the Caribbean at 4 per cent, and Oceania at 3 per cent. When compared with the size of the population
in each region, shares of international migrants in 2015 were highest in Oceania, North America and Europe,
where international migrants represented, respectively, 21 per cent, 15 per cent and 10 per cent of the total
population.8 In comparison, the share of international migrants is relatively small in Asia and Africa (1.7% each)
and Latin America (1.5%). However, Asia is the region where growth in the resident migrant population between
2000 and 2015 was most remarkable, at over 50 per cent (around 25 million people, in absolute terms).9
Figure 1. International migrants, by major region of residence, 2000 to 2015 (millions)
Source: UN DESA, 2015a. Datasets available from www.un.org/en/development/desa/population/migration/data/
estimates2/estimates15.shtml (accessed 22 June 2017).
The United States of America has been the main country of destination for international migrants since 1970.10
Since then, the number of foreign-born people residing in the country has almost quadrupled — from less
than 12 million in 1970, to 46.6 million in 2015. Germany has been the second top country of destination per
UN DESA estimates since as early as 2005, with over 12 million international migrants residing in the country
in 2015. Prior to 2005, the Russian Federation had been the second largest host country of international
migrants for roughly 15 years, since the fall of the Union of Soviet Socialist Republics in 1991. A list of the top
20 destination countries of international migrants is provided in the left-hand column of figure 2 below.
8 UN DESA, 2015a.
9 Ibid.
10 UN DESA, 2008; UN DESA, 2015a.WORLD MIGRATION REPORT 2018 7
The list of largest migrant source countries is shown in the right-hand panel in figure 2. Nearly half of all
international migrants worldwide in 2015 were born in Asia,11 primarily originating from India (the largest
country of origin), China, and other South Asian countries such as Afghanistan, Bangladesh and Pakistan.
Mexico was the second largest country of origin, followed by a number of European countries that have sizable
numbers of emigrants.
Figure 2. Top 20 destinations (left) and origins (right) of international migrants in 2015 (millions)
Source: UN DESA, 2015a. Datasets for the 2015 Revision available at www.un.org/en/development/desa/population/migration/data/
estimates2/estimates15.shtml.
11 UN DESA, 2016.8 Migration and migrants: A global overview In regard to the distribution of international migrants by countries’ income group,12 about two thirds of international migrants resided in high-income economies in 2015 – around 157 million. This compares with 77 million foreign-born who resided in middle-income countries (about one third of the total migrant stock) and almost 9 million in low-income countries in the same year. UN DESA estimates of foreign-born populations do not reflect immigration status or policy categories (such as students, highly skilled migrants, or refugees). Capturing such attributes is inherently difficult for several key reasons. First, a person’s immigration status can be fluid and change quickly, arising from circumstances and legal-policy settings. For example, many international migrants who may be described as ‘‘undocumented’ or “irregular” enter countries on valid visas and then stay in contravention of one or more visa conditions. In fact, there are many paths to irregularity, such as crossing borders without authorization, unlawfully overstaying a visa period, working in contravention of visa conditions, being born into irregularity, or remaining after a negative decision on an asylum application has been made.13 Second, countries have different immigration policy settings and different ways of collecting data on migrants, which makes it difficult to establish a harmonized approach to capturing irregular migrant stocks globally. The pace of change in the migration policy arena also poses an extra dimension of complexity, as people may slip into and out of “irregularity”. Various analysts use different methods to produce intermittent estimates of irregular migrant populations. Table 2 shows a few existing estimates of irregular migrant populations in selected countries and regions. However, these should be treated with caution, as the estimation exercise can often be imprecise (for example, there are variations in the estimates of irregular migrant populations in the European Union and the United States). This is partly a reflection of the problematic nature of quantifying irregular migrant populations, given the often clandestine nature of irregularity, the difficulty in accessing administrative data on immigration status, and the fact that a migrant’s status can change.14 Migration flows are discussed in the following section. Diaspora populations or transnational communities? The term diaspora is used in academic and policy circles to refer to people (and often their descendants) from a specific country who are living abroad. However, there is no single agreed-upon definition of the term. In fact, it has been suggested that the term transnational communities may better describe the reality of contemporary migration experiences, where migrants may establish and maintain connections with people in their home communities or migrants in other countries. Indeed, IOM uses the terms diaspora and transnational communities interchangeably (IOM, 2017c). See appendix B for a further discussion on the term diaspora and the difficulties in quantifying global diaspora populations, as well as IOM’s work in this area. 12 Per World Bank Country Income Group Classifications, in World Bank Country and Lending Groups. Available from http://datahelpdesk. worldbank.org/knowledgebase/articles/906519-world-bank-country-and-lending-groups (World Bank, n.d.a). 13 Gordon et al., 2009. 14 Koser, 2010.
WORLD MIGRATION REPORT 2018                                                                                                  9

         Table 2. Estimates of irregular migrant populations in selected countries and regions

               Country/region                   Year              Estimated population (stock)                Source

           Australia                            2011                                58,400                       (a)
                                                2008                       1.9–3.8 million                       (b)
           European Union
                                                2008                              8 million                      (c)
           Germany                              2014                   180,000–520,000                           (d)
           Greece                               2011                               390,000                       (e)
           Israel                               2015                               150,000                       (f)
           Italy                                2008                   279,000–461,000                           (b)
           Russian Federation*                  2011                           5–6 million                       (g)
           South Africa                         2010                           3–6 million                       (h)
           Spain                                2008                               354,000                       (i)
           United Kingdom                       2007                   417,000–863,000                           (j)
                                                2014                          11.1 million                       (k)
           United States
                                                2016                          11.3 million                       (k)

        * Estimate refers to irregular migrant workers.

         Source: (a) ANAO, 2013; (b) Clandestino Research Project, 2009a; (c) Frontex, 2010; (d) Clandestino Research
                 Project, 2015; (e) Clandestino Research Project, 2012; (f) Fleischman et al., 2015; (g) OECD, 2012a;
                 (h) South African Police Service, 2010; (i) Clandestino Research Project, 2009b; (j) Gordon et al., 2009;
                 (k) Krogstad, Passel and Cohn, 2017.

International migration flows: definitions, numbers and gaps
While data on migrant stocks are widely available, data on global migration movements (flows) are much
more limited. Available UN DESA estimates on global migrant stocks are extensive and global in scope;
however, the database of migration flows only encompasses 45 countries.15 Capturing data on migration
flows is challenging for several reasons. First, while international migration flows are generally accepted as
covering inflows and outflows into and from countries, there has been a greater focus on recording inflows. For
example, while countries such as Australia and the United States count cross-border movements, many others
only count entries and not departures.16 Additionally, migration flow data in some countries are derived from
administrative events related to immigration status (for example, issuance/renewal/withdrawal of a residence

15 Laczko, 2017.
16 Koser, 2010.
10 Migration and migrants: A global overview permit) and are thus used as a proxy for migration flows. Furthermore, migratory movements are often hard to separate from non-migratory travel, such as tourism or business. Tracking migratory movements also requires considerable resources, infrastructure and IT/knowledge systems. This poses particular challenges for developing countries, where the ability to collect, administer, analyse and report data on mobility, migration and other areas is often limited. Finally, many countries’ physical geographies pose tremendous challenges for collecting data on migration flows. Entry and border management, for example, is particularly challenging in some regions because of archipelagic and isolated borders, and it is further complicated by traditions of informal migration for work.17 Migration flows There are currently two main international datasets on international migration flows, both of which are derived from national statistics: UN DESA’s International Migration Flows dataset and OECD’s International Migration Database.18 Since 2005, UN DESA has compiled data on the flows of international migrants to and from selected countries, based on nationally available statistics. The latest revision (2015) comprises data from 45 countries that collect this information (only 43 on emigration flows), up from 29 countries in 2008 and 15 countries in 2005.19 Progress in extending the dataset is encouraging; however, the ability to conduct trend analysis is limited.20 Researchers and analysts have made numerous attempts to better understand global or regional migration flows by using changes in migrant stock data as a proxy for flow data. Guy Abel and Nikola Sander recently undertook a sophisticated approach to this issue by analysing changes in international migrant stocks to estimate migration flows, visualizing data using circular plots.21 Figure 3 provides an update to this work by presenting estimated migration flows between 2010 and 2015.22 17 Gallagher and McAuliffe, 2016. 18 Other projects have made contributions to the monitoring of migration flows at a regional (non-global) level. Of note, the Migration Modelling for Statistical Analyses (MIMOSA) project (commissioned by Eurostat) measured migration flows (immigration and emigration) as well as population stocks in Europe (de Beer, van der Erf and Raymer, 2009; Raymer et al., 2011). The Integrated Modelling of European Migration (IMEM) project (Raymer et al., 2013) notably presents bilateral migrant flow data disaggregated by age and gender, but is also limited to countries in Europe. 19 For UN DESA migrant flow data, as well as for the specific countries included, please see UN DESA, 2015c. 20 For a summary of UN DESA migrant flow data sources, methodology and caveats, please see UN DESA, 2015d. 21 Abel and Sander, 2014. 22 Prepared by Guy Abel in 2017.
WORLD MIGRATION REPORT 2018                                                                                                       11

                            Figure 3. Estimated regional migration flows, 2010–2015

             Source: UN DESA, 2015a. Datasets for the 2015 revision of International migration flows to and from
                     selected countries available from www.un.org/en/development/desa/population/migration/data/
                     empirical2/migrationflows.shtml.
             Note:   The direction of the flow is indicated by the arrowhead. The size of the flow is determined by the
                     width of the arrow at its base. Numbers on the outer section axis, used to read the size of migration
                     flows, are in millions. So, for example, between 2010 and 2015, there was an increase of around 4
                     million people in Northern America who were born in Asia.

The OECD data on migration flows have been collected since 2000, which allows for limited trend analysis, as
shown in figure 4 (though data are not standardized, as explained in the note under the figure).23 The data
estimates suggest that permanent migration inflows to OECD countries increased from 3.85 million in 2000 to
7.13 million in 2015, with a temporary lull occurring around the time of the global financial crisis (figure 4).
Germany was the main OECD destination country in 2015, with over 2 million new international migrants (more
than double the levels registered in 2000) arriving that year, followed by the United States (just over 1 million)
and the United Kingdom (about 480,000 new migrants).24

23 This subsection is based on data from the OECD International Migration Database, available from OECD, 2015. For additional data on
   migrant flows and other migrant data in OECD countries, please see OECD, n.d.a.
24 These are the top OECD countries for permanent inflows of foreign nationals for which data were made available in 2015.
12 Migration and migrants: A global overview
Figure 4. Inflows of foreign nationals into OECD countries, permanent migration,
2000–2015 (millions)
Source: OECD, 2015.
Note 1: Data are not standardized and therefore differ from statistics on permanent migration inflows into selected
countries contained in OECD’s International Migration Outlook 2016 (OECD, 2016a and 2016b).
Note 2: The 35 countries typically included in OECD statistics are the following: Australia, Austria, Belgium, Canada, Chile, Czech
Republic, Denmark, Estonia, Finland, France, Germany, Greece, Hungary, Iceland, Ireland, Israel, Italy, Japan, Republic
of Korea, Latvia, Luxembourg, Mexico, the Netherlands, New Zealand, Norway, Poland, Portugal, Slovakia, Slovenia,
Spain, Sweden, Switzerland, Turkey, United Kingdom and United States. In some years, data for particular countries
are not made available: data were made available for 31 countries in 2000, and 33 countries in 2015. Notably, data for
Greece have not been reported since 2012 and data for Turkey have not been reported since 2010.
Disaggregation of migration flow data by sex and age
Data on age and sex profiles of international migration flows are not available from UN DESA or OECD.
A methodology for sex disaggregation of bilateral migration flows using UN DESA stock data is presented
in Abel, Samir and Sander.d Raymer et al.e provide bilateral migration flow estimates by sex and age,
but only for European countries. Finally, Nawrotzki and Jiangf estimated bilateral net migration flows
disaggregated by age and sex for the year 2000; the information is contained in the publicly available
Community Demographic Model International Migration (CDM-IM) dataset. Statistics on bilateral
migration flows are also available from the Determinants of International Migration (DEMIG) Country-
to-Country database, which contains bilateral migration flow data for up to 34 countries over the period
1946–2011. The database also provides gender breakdowns, where available.
d Abel, Samir and Sander, 2013.
e Raymer et al., 2013.
f Nawrotzki and Jiang, 2015.
Typically, migration flow data of the sort described above encompass people who have migrated (or are residing)
regularly on a visa or entry permit. Most such data do not capture irregular migration flows, which involve
“movement that takes place outside the regulatory norms of the sending, transit and receiving country”.25
25 IOM, 2017a.WORLD MIGRATION REPORT 2018 13
It is important here to distinguish irregular migration (flows) from irregular migrants (stocks), as they are
interlinked, but conceptually and practically distinct, although the two terms are often incorrectly used
interchangeably.26 As mentioned earlier in this chapter, a person may, for example, enter a country regularly
on a valid visa (thereby not engaging in irregular entry) and then overstay or contravene a visa condition, for
example, and thus become irregular. Estimates of irregular migrants (stocks) were discussed in the previous
section. For further discussion on irregular migration flows, see appendix C.
Human trafficking and migrant smuggling
Trafficking in persons often involves movements within countries or across international borders. In
different contexts, migrants (including workers, refugees, asylum seekers and IDPs) can become victims of
human trafficking. Due to the clandestine and underreported nature of this activity, however, systematic
data collection is problematic and global estimates of human trafficking are limited. For information on
available data, as well as on IOM’s work in this area, see appendix D.
Global-level data on migrant smuggling on routes traversing land, air and sea are unavailable. Tragedies
involving smuggled migrants are often a key glimpse into the potential scale and vulnerabilities associated
with such movements. In recent years, in recognition of the need for a better understanding of migrant
smuggling dynamics, efforts have been made to review existing data and research (see, for example,
McAuliffe and Laczko, 2016).
See appendix A for definitions of the terms trafficking in persons and smuggling of migrants.
Migrant fatalities and IOM’s Missing Migrants Project
In the wake of the tragic events of October 2013, in which an estimated 368 migrants died in the sinking
of two boats near the Italian island of Lampedusa, IOM began collecting and compiling information
on migrants who perish or go missing on migratory routes worldwide, within its Missing Migrants Project
(MMP). Information on migrant fatalities is collected daily and made available on the Missing Migrants
Project’s online database, managed by IOM’s Global Migration Data Analysis Centre (GMDAC). MMP also
provides analysis of issues and data on migrant deaths. Data sources include official records of coast
guards and medical examiners, media stories, reports from non-governmental organizations (NGOs)
and United Nations agencies, and interviews with migrants. Data collection challenges are significant.
For instance, the majority of deaths are among migrants travelling irregularly, which often occurs at
sea, or in remote areas (chosen with the aim of evading detection), meaning bodies are not found.
Few official sources collect and make data on migrant deaths publicly available. Relying on migrant
testimonies and media sources may also be problematic due to inaccuracies and incomplete coverage.
26 McAuliffe, 2017.14 Migration and migrants: A global overview
According to IOM’s MMP, 7,927 migrants worldwide died or went missing in 2016, 26 per cent
more than the number of deaths and missing migrants recorded in 2015 (6,281). The number
of deaths and missing migrants recorded in the Mediterranean Sea increased by 36 per cent
in 2016, from 3,785 in 2015 to 5,143 in 2016. The Mediterranean accounted for more than
60 per cent of migrant deaths and missing migrants recorded by MMP in both years. Nearly 1,400 deaths
and missing migrants were recorded in North Africa in 2016, mostly due to the harsh natural environment,
violence and abuse, dangerous transportation conditions, and sickness and starvation. Figures for other
regions are highlighted below.
Recorded migrant deaths and missing migrants worldwide, 2016
Source: IOM, n.d.i.
Note: Figures correspond to deaths that occurred during the process of migration. All numbers reflect only those incidents about
which IOM is aware. An unknown number of deaths remain unreported and therefore, these data comprise minimum
estimates. Figures include both bodies found and migrants who are missing and presumed dead. Names and boundaries
indicated on this map do not imply official endorsement or acceptance by IOM.
For more on MMP, see https://missingmigrants.iom.int/about. New data sources are constantly added
and efforts are ongoing to improve data collection globally. For a discussion of the challenges of collecting
data on migrant deaths, please see http://missingmigrants.iom.int/methodology.WORLD MIGRATION REPORT 2018 15
IOM’s Assisted Voluntary Return and Reintegration Programmes
IOM has implemented assisted voluntary return and reintegration (AVRR) programmes since 1979.
IOM’s AVRR support to migrants comprises a range of activities, and typically includes: the provision of
pre-departure counselling, the purchase of flight tickets, administrative and travel assistance and, where
possible, the provision of reintegration assistance.
On average, between 2005 and 2014, IOM assisted 34,000 migrants per year through AVRR. In line with
the rise in the volume of migration in recent years, the number of returns has significantly increased.
In 2016, AVRR support was provided to 98,403 migrants returning from 110 host or transit countries to
161 countries or territories of origin. This amounts to a 41 per cent increase compared with 2015 (69,540).
Of the 98,403 AVRR beneficiaries in 2016, approximately 32 per cent were women and 27 per cent were
children. Over 3 per cent of these returnees were victims of trafficking, unaccompanied migrant children,
or migrants with health-related needs. Approximately 39,000 beneficiaries were provided with financial
support in cash and/or in kind, before departure or upon arrival in their countries or territories of origin.
Top 10 host/transit countries and countries/territories of origin of AVRR
beneficiaries (2016)
Host or transit countries Countries or territories of origin
Germany 54,006 Albania 17,976
Greece 6,153 Iraq 12,776
Austria 4,812 Afghanistan 7,102
Niger 4,788 Serbia 6,978
Netherlands, the 4,635 Kosovo/UNSC 1244 5,889
Belgium 4,117 Ethiopia 5,675
Yemen 2,594 The former Yugoslav Republic of Macedonia 4,986
Finland 2,116 Iran (Islamic Republic of) 4,485
Djibouti 1,803 Ukraine 3,438
Norway 1,459 Russian Federation 2,058
As highlighted in the above table, in 2016, the majority of AVRR beneficiaries (83%) returned from
the European Economic Area (EEA) and Switzerland, particularly from Germany, Greece, Austria, the
Netherlands and Belgium. Returns from the EEA and Switzerland increased from 55,851 in 2015 to
81,671 in 2016. Recent trends also indicate that South–South returns, including from transit countries,
are increasing. In 2016, returns from Niger and Morocco to countries such as Cameroon, Guinea, Guinea-
Bissau and Senegal, for example, amounted to more than 6 per cent of the global total. The main regions
of origin for AVRR beneficiaries in 2016 were South-Eastern Europe, Eastern Europe and Central Asia
(49% of total), Asia and the Pacific (16%), and the Middle East and North Africa (16%). Together, the top
10 countries and territories of origin accounted for 72 per cent of the total number of AVRR beneficiaries.
For more information, see www.iom.int/assisted-voluntary-return-and-reintegration and www.iom.int/
sites/default/files/our_work/DMM/AVRR/AVRR-2016-Key-Highlights.pdf.16 Migration and migrants: A global overview
Migrant workers
The latest available estimates for the global stock of migrant workers, which are based on 2013 data, indicate
that there were roughly 150.3 million, accounting for a little under two thirds of the global stock of international
migrants (232 million) in that year.27 When compared with the global population of international migrants of
working age – regarded as 15 years or older (207 million) – migrant workers account for more than 70 per cent.
For a range of reasons, however, these global figures are likely to be underestimates.28 While earlier global
estimates of migrant workers are available (36–42 million in 1995, 86.2 million in 2000 and 105.5 million in
2010), the ILO notes that these cannot be compared with the 2013 figures, due to definitional differences and
changes in methodology and data sources.
In 2013, most migrant workers – an estimated 112.3 million (75%) – were in high-income countries, with another
34.4 million (23%) in middle-income countries. Only about 2 per cent of migrant workers went to low-income
destination countries. The share of migrant workers in the total workforce across the clustered income groups
was relatively low (around 1.4%) and quite similar across low- and middle-income countries, but much higher
(at 16.3%) for the high-income group of countries.
Male migrant workers outnumbered female migrant workers by almost 17 million in 2013, with 83.7 million
males (55.7%) and 66.6 million females (44.3%), in a context where males comprised a higher number of
international migrants of working age (107.2 million against 99.3 million). See table 3 for further breakdowns.
Table 3. Migrant workers, by sex and income level of destination countries (2013)
Lower middle Upper middle
Low income High income Global Total
income income
M F Total M F Total M F Total M F Total M F Total
Migrant
workers 1.8 1.8 3.5 9.4 7.5 16.9 10.4 7.2 17.5 62.1 50.1 112.3 83.7 66.6 150.3
(millions)
As a
proportion
of all 1.2 1.2 2.4 6.3 5.0 11.2 6.9 4.8 11.6 41.3 33.3 74.7 55.7 44.3 100
migrant
workers (%)
Source: Based on ILO, 2015.
Most migrant workers were engaged in services in 2013 (106.8. million or 71.1%). Manufacturing and construction
(26.7 million or 17.8%) and agriculture (16.7 million or 11.1%) accounted for the rest. Of the more than
70 per cent engaged in services, almost 8 per cent were domestic workers.
27 The content in this subsection is based on and drawn from ILO, 2015. Please refer to this document for explanatory notes, deeper
analysis, and limitations and caveats associated with the numbers and trends presented. More generally, information on foreign-
born employment in OECD countries is available from OECD, n.d.b.
28 See, for example, ILO, 2015.WORLD MIGRATION REPORT 2018 17
In 2013, there were an estimated 11.5 million migrant domestic workers, comprising more than 17 per cent of
all domestic workers (67.1 million) and over 7 per cent of all migrant workers. Of the 11.5 million, 8.45 million
were female and 3.07 million were male. Migrant domestic workers were overwhelmingly located in high-income
countries; and this was true of both female and male migrant domestic workers (see figure 5). IOM’s work on
migrant health, as discussed in the following box, is particularly relevant for migrant workers and refugees
(discussed in the next section).
Figure 5. Migrant domestic workers by destination country income level and sex as of 2013
(millions)
Source: ILO, 2015.
IOM’s work on migrant health
IOM delivers and promotes preventative and curative health programmes through its Migration
Health Division. Upon request from receiving-country governments, IOM provides physical and mental
health assessments for migrants prior to their departure, whether for the purposes of resettlement,
international employment, or for obtaining temporary or permanent visas. Specific services include
tuberculosis testing and control; HIV, syphilis and hepatitis tests; physical exams; laboratory diagnostic
services; medical escort services; and pre-departure immunization.
Such health assessments contribute to the epidemiological knowledge base on selected migrant
populations, allowing for the development of evidence-based programmes and health interventions.
Data collection is standardized and centralized among IOM country offices, which also enables IOM to
decrease processing time, conserve resources and integrate all migration health activities at the country
level. IOM is also in the process of developing a medical data repository to facilitate analysis of current
and historical operational data.18 Migration and migrants: A global overview In 2015, IOM conducted more than 346,000 health assessments among migrants in more than 80 countries, covering both immigrants (65%) and refugees (35%). The majority of assessments were conducted in Asia (45%), followed by Africa (29%), the Middle East (14%) and Europe (13%). In 2016, IOM conducted almost 450,000 health assessment (52% immigrants and 48% refugees), representing an overall 27 per cent increase compared with 2015. Again, the majority of assessments were carried out in Asia (35%), followed by Africa (30%), the Middle East (23%) and Europe (12%). These figures are consistent with a steady growth in the number of global health assessment activities conducted by IOM over the preceding five years. Beginning in 2012, IOM engaged with US agencies to develop and implement a vaccination programme for United States-bound refugees within the context of the US Refugee Admissions Program. The programme sought to introduce vaccinations early in the resettlement process to protect refugees against many of the common vaccine-preventable diseases. By the end of 2015, this programme had been implemented in over 12 countries. Overall, between 2012 and 2016, this programme was implemented in 21 countries with more than 215,000 refugees having received one or more vaccines. For more on IOM’s work on migrant health, see www.health.iom.int/. Remittances Remittances are financial or in-kind transfers made by migrants directly to families or communities in their countries of origin. The World Bank compiles global data on remittances, notwithstanding the myriad data gaps, definitional differences and methodological challenges in compiling accurate statistics.29 Its data, however, do not capture unrecorded flows through formal or informal channels, and the actual magnitude of global remittances are therefore likely to be larger than available estimates.30 Despite these limitations, available data reflect an overall increase in recent decades, from USD 126 billion in 2000, to USD 575 billion in 2016, although the past two years have witnessed a decline. Between 2014 and 2015, global (inward) flows of remittances contracted by an estimated 2.7 per cent, from USD 598 billion in 2014 to USD 582 billion in 2015, and by another 1.2 per cent between 2015 and 2016. Consistent with this trend, remittances to developing countries (which account for the majority of the global total) have also declined for two consecutive years – a trend that has not been seen for three decades, according to the World Bank. Nonetheless and, notably, since the 29 The content of much of this subsection, unless otherwise noted, is based on and drawn from the World Bank’s data in relation to migration and remittances, available from World Bank, n.d.b; and publications on the topic, available from World Bank, n.d.c. In particular, the World Bank’s annual remittances datasets (World Bank, n.d.b), the Migration and Development Brief 25 (World Bank, 2015), Migration and Development Brief 26 (World Bank, 2016b),the Migration and Development Brief 27 (World Bank, 2017a) and its April 21 Press Release (World Bank, 2017b) are key sources of information. Please refer to these sources as well as the World Bank’s Factbooks on Migration and Development, including its latest, published in 2016, for explanatory notes, deeper analysis, caveats, limitations and methodologies associated with the numbers and trends presented. 30 World Bank, 2016a.
WORLD MIGRATION REPORT 2018                                                                                                 19

mid-1990s, remittances have greatly surpassed Official Development Assistance (ODA) levels,31 defined as
government aid designed to promote the economic development and welfare of developing countries.32

In 2016, India, China, Philippines, Mexico and Pakistan were (in descending order) the top five remittance-
recipient countries, although China and India were well above the rest, with total inward remittances exceeding
USD 60 billion for each country (see table 4). Each of the remaining three countries received less than USD 30
billion in the same year. Many of these countries have remained in the top spots in this century. When remittances
are viewed as a percentage of GDP, however, the top five countries are Kyrgyzstan (at 35.4%), followed by Nepal
(29.7%), Liberia (29.6%), Haiti (27.8%) and Tonga (27.8%) in 2016.

High-income countries are almost always the main source of remittances. For decades, the United States has
consistently been the top remittance-sending country, with a total outflow of USD 61.38 billion in 2015,
followed by Saudi Arabia (USD 38.79 billion) and Switzerland (USD 24.38 billion). China, which is classified
as an upper–middle income country by the World Bank, is also a major source (in addition to its role as a top
recipient), with an outflow of USD 20.42 billion in 2015. The fifth-highest remittance-sending country in 2015
was the Russian Federation (USD 19.7 billion). Table 4 provides further details and trends.33

      Table 4. Top countries receiving/sending remittances (2000–2015) (current USD billions)

                                          Top countries receiving remittances
               2000                            2005                          2010                            2015
 India                    12.84     China               23.63     India                 53.48     India               68.91

 France                     8.61    Mexico              22.74     China                 52.46     China               63.94

 Mexico                     7.52    India               22.13     Mexico                22.08     Philippines, the    28.48

 Philippines                6.96    Nigeria             14.64     Philippines, the      20.56     Mexico              26.23

 Republic of Korea          4.86    France              14.21     France                19.90     France              23.35

 Spain                      4.86    Philippines, the    13.73     Nigeria               19.75     Nigeria             18.96

 Turkey                     4.56    Belgium               6.89    Germany               12.79     Pakistan            19.85
 United States of
                            4.40    Germany               6.87    Egypt                 12.45     Egypt               16.58
 America
 Germany                    3.64    Spain                 6.66    Bangladesh            10.85     Bangladesh          15.38

 United Kingdom             3.61    Poland                6.47    Belgium               10.35     Germany             15.36

31 See ibid., for example.
32 See, for example, OECD, n.d.c, which also contains data on ODA. There is a growing body of work exploring the developmental,
   economic and social impacts of this trend.
33 Breakdowns for 2016 were unavailable at the time of publication.
20 Migration and migrants: A global overview
Top countries sending remittances
2000 2005 2010 2015
United States of United States United States of United States
34.40 47.25 50.78 61.38
America of America America of America
Saudi Arabia 15.40 Saudi Arabia 14.32 Saudi Arabia 27.07 Saudi Arabia 38.79
Russian
Germany 9.04 Germany 12.71 21.45 Switzerland 24.38
Federation
Switzerland 7.59 Switzerland 9.99 Switzerland 16.88 China 20.42
United Russian
France 3.77 9.64 Germany 14.68 19.70
Kingdom Federation
United Arab
3.68 France 9.48 Italy 12.89 Germany 18.56
Emirates
Republic of
3.65 Italy 7.55 France 12.03 Kuwait 15.20
Korea
Russian
Israel 3.26 6.83 Kuwait 11.86 France 12.68
Federation
Japan 3.17 Luxembourg 6.70 Luxembourg 10.64 Qatar 12.19
Netherlands, Republic of United Arab
3.13 6.67 10.57 Luxembourg 11.35
the Korea Emirates
Source: World Bank, n.d.b. (accessed May 2017).
Note: All numbers are in current (nominal) USD billion.
Refugees and asylum seekers
By the end of 2016, there were a total of 22.5 million refugees, with 17.2 million under UNHCR’s mandate and 5.3 million
refugees registered by the United Nations Relief and Works Agency for Palestine Refugees in the Near East.34 The total
number of refugees is the highest on record, although the annual rate of growth has slowed since 2012. There were also
2.8 million people seeking international protection and awaiting determination of their refugee status, referred to as
asylum seekers. Of the roughly 2 million first-instance applications for asylum lodged in 2016, Germany remained the
top recipient, with over 720,000 applications, followed by the United States (262,000) and Italy (123,000).
UNHCR estimates that, at the end of 2016, those under 18 years of age constituted roughly 51 per cent of
the global refugee population. Indeed, between 2003 and 2016, according to available disaggregated data,
the proportion of children among stocks of refugees was very high, fluctuating between 41 and 51 per cent.
The proportion of women remained relatively stable, at between 47 and 49 per cent, over the same
period. Consistent with broader global dynamics, refugees were increasingly based in urban settings, with
60 per cent of refugees located in urban areas at the end of 2016.35
34 The content in this subsection is based on and drawn from UNHCR, 2017 and UNHCR, 2016. Please refer to these documents for
explanatory notes, deeper analysis, caveats, limitations and methodologies associated with the numbers and trends presented.
UNHCR’s previous Global Trends reports, as well as its Population Statistics database (available from UNHCR, n.d.) are other key
sources of information.
35 See UNHCR’s 2016 and 2017 reports for limitations applicable to these assessments related to age, sex and location.WORLD MIGRATION REPORT 2018 21
Unaccompanied and separated children lodged an estimated 75,000 individual asylum applications in 70 countries
in 2016 – down from the exceptionally high number of applications in 2015 (98,400), yet still more than double
the number reported in 2014.36 Consistent with the overall global trends in asylum application submissions,
Germany received more than half of all reported claims from unaccompanied and separated children.
As in other years, unresolved or renewed conflict dynamics in key countries contributed most significantly to
current figures and trends. Of the refugees under UNHCR’s mandate at the end of 2016, the top 10 countries
of origin – Syrian Arab Republic, Afghanistan, South Sudan, Somalia, Sudan, the Democratic Republic of
the Congo, Central African Republic, Myanmar, Eritrea and Burundi – accounted for roughly 13.5 million, or
79 per cent. Many of these countries have been among the top sources for refugees for at least five years.
The ongoing conflict in the Syrian Arab Republic saw the number of refugees from that country reach
approximately 5.5 million. The instability and violence that have made Afghanistan a major source of refugees
for over 30 years has continued, with the country being the second top origin country in the world, with
2.5 million refugees; this is a slight decrease from 2015 figures (2.7 million), largely due to returns from
Pakistan. Large-scale violence that erupted in South Sudan in the middle of 2016 saw it become the third
largest origin country for refugees, with over 1.4 million at the end of the year. Refugees from Afghanistan,
South Sudan and the Syrian Arab Republic comprised 55 per cent of the refugees under UNHCR’s mandate.
Figure 6 shows the trends in refugee numbers for selected major countries of origin between 2000 and 2015.
The impact of the Syrian conflict is clearly illustrated in figure 6; in 2010, the Syrian Arab Republic was a
source country for fewer than 30,000 refugees and asylums seekers, whereas it was the third largest host
country, with 1,005,500 refugees, primarily originating from Iraq.37
Figure 6. Number of refugees by major countries of origin as of 2016 (millions)
Source: UNHCR, n.d. (accessed on 18 July 2017).
Note: Lines indicate five-year trends and crosses indicate a single year’s data. South Sudan became a country in 2011.
36 See UNHCR, 2017, on why these figures are underestimates.
37 UNHCR, 2010.22 Migration and migrants: A global overview
In 2016, for the third consecutive year, Turkey was the largest host country in the world, with 2.9 million
refugees, mainly Syrians (2.8 million). Reflecting the significant share of Syrians in the global refugee
population, two other bordering countries – Jordan and Lebanon – also featured among the top 10. Pakistan
and the Islamic Republic of Iran were also among the top refugee-hosting countries, as the two principal hosts
of refugees from Afghanistan, the second largest origin country. Uganda, Ethiopia, Germany, the Democratic
Republic of the Congo and Kenya comprised the rest. The vast majority of refugees were hosted in neighbouring
countries. According to UNHCR, the least developed countries, such as Cameroon, Chad, the Democratic Republic
of the Congo, Ethiopia, Kenya, Sudan and Uganda, hosted 28 per cent of the global total (4.9 million refugees).
It is only when refugees are measured against national populations that high-income countries such as Sweden
(fifth) and Malta (ninth) rank among the top 10. Figure 7 shows trends in refugee numbers for major host
countries between 2000 and 2015.
Figure 7. Number of refugees by major host countries as of 2016 (millions)
Source: UNHCR, n.d. (accessed on 18 July 2017).
Note: Lines indicate five-year trends and crosses indicate a single year’s data.
A key component of UNHCR’s mandate is to seek permanent solutions for refugees. Within this context,
UNHCR also compiles statistics on the three traditional solutions: voluntary repatriation, local integration and
resettlement. For many, return home is the preferred solution. However, for various reasons, as evidenced by
the numbers discussed below, only a very small proportion of refugees achieve a solution in any given year,
contributing to the protracted nature of many refugee predicaments.
During 2016, over 550,000 refugees returned to their countries of origin – more than double the number in 2015
and a notable increase from previous years. The majority of returns (384,000) were to Afghanistan, primarily
from Pakistan. Prolonged and renewed conflicts have contributed to low levels of voluntary repatriation, with
levels of returns between 2011 and 2015 accounting for only 10 per cent of all returns over the last two decades.WORLD MIGRATION REPORT 2018 23
While there are many challenges to measuring those benefiting from local integration, UNHCR estimates that,
in 2016, 23 countries reported at least one naturalized refugee (compared with 28 countries in 2015), with a
total of 23,000 naturalized refugees for the year (compared with 32,000 in 2015). Canada, which naturalized
an estimated 16,300 refugees in 2016 (compared with 25,900 in 2015), represents the greatest proportion, with
France, Belgium and Austria contributing the bulk of the rest.
The number of countries that are a part of UNHCR’s resettlement programmes increased from 33 in 2015 to 37 in
2016; States in Europe and Latin America, in particular, established new resettlement programmes, or made new
resettlement commitments. Notwithstanding this increase, the traditional resettlement countries of Australia,
Canada and the United States continued to conduct the majority of the world’s refugee resettlements. In 2016,
almost 190,000 refugees were admitted for resettlement globally, representing a 77 per cent increase from 2015
(107,100). Syrian, Congolese, Iraqi and Somali refugees were the key beneficiaries. Figure 8 provides an overview
of resettlement statistics for key countries between 2000 and 2016.
Figure 8. Number of refugees resettled by major resettlement countries in 2000–2016
(thousands)
Source: UNHCR, n.d. (accessed on 23 June 2017).24 Migration and migrants: A global overview IOM’s role in resettlement IOM arranges safe and organized travel for refugees through resettlement programmes, as well as for other vulnerable persons of concern moving through other humanitarian pathways. Beyond classical refugee resettlement and humanitarian admission programmes, more States are interested in or are currently carrying out other forms of admission, such as humanitarian visas, private sponsorships, academic scholarships and labour mobility schemes. IOM’s movement data for resettlement assistance refer to the overall number of refugees and other persons of concern travelling under IOM auspices from various countries of departure to destinations around the world during a given period. During calendar years 2015 and 2016, IOM supported some 43 States in carrying out resettlement, humanitarian admission and relocation initiatives in over 140 countries of departure, with significant operations conducted in Afghanistan, Ethiopia, Iraq, Jordan, Kenya, Lebanon, Malaysia, Nepal, Thailand, Turkey and the United Republic of Tanzania. In 2015, a total of 126,867 individuals travelled to 30 States under IOM auspices for resettlement assistance; the top nationalities were Syrians, Burmese, Iraqis, Afghans and Somalis. In 2016, a total of 204,937 individuals travelled to 39 States under IOM auspices for resettlement assistance; the top nationalities were Syrians, Congolese, Iraqis, Afghans and Somalis. Each year, the gender breakdown remains the same, with 51 per cent males and 49 per cent females resettling to third countries. Between 2010 and 2016, annual resettlement by IOM increased by more than 103 per cent, with over 100,000 vulnerable persons of concern in 2010, and close to 205,000 in 2016. This is largely due to the emergency resettlement of Syrians and admission of Iraqi and Afghan translators/interpreters through special immigration visas. An increase in Syrian resettlement began in the latter half of 2015, notably to Canada, the United Kingdom, the United States of America, and a number of European countries such as Germany and Sweden. Under cooperative agreements, IOM provides stakeholders with necessary information and shares data with key partners such as UNHCR, resettlement countries and settlement agencies. IOM works in close collaboration with UNHCR on a regular basis to verify and better align aggregate data related to resettlement, specifically around departures figures. For more information on IOM’s resettlement activities, see: www.iom.int/resettlement-assistance. Internally displaced persons IDMC compiles data on two types of internal displacement: new displacements during a given period, and the total stock of IDPs at a given point in time. At the end of 2016, there were 31.1 million new internal displacements in 125 countries.38 Disasters triggered by rapid-onset hazards were associated with the majority, 38 The content in this subsection is based on and drawn from IDMC, 2017 and IDMC, 2016. Please refer to these documents for explanatory notes, deeper analysis, caveats, limitations and methodologies associated with the numbers and trends presented. The year 2016 was the first year that IDMC produced a single and combined annual report that included figures for conflict and violence as well as disasters. IDMC’s previous Global Estimates reports (available from www.internal-displacement.org/global- report/), as well as its Global Internal Displacement Database (available from IDMC, n.d.), are other key sources of information.
You can also read