The Cariboo Alpine Mesonet: sub-hourly hydrometeorological observations of British Columbia's Cariboo Mountains and surrounding area since 2006
←
→
Page content transcription
If your browser does not render page correctly, please read the page content below
Earth Syst. Sci. Data, 10, 1655–1672, 2018
https://doi.org/10.5194/essd-10-1655-2018
© Author(s) 2018. This work is distributed under
the Creative Commons Attribution 4.0 License.

              The Cariboo Alpine Mesonet: sub-hourly
        hydrometeorological observations of British Columbia’s
         Cariboo Mountains and surrounding area since 2006
          Marco A. Hernández-Henríquez1 , Aseem R. Sharma2 , Mark Taylor1 , Hadleigh D. Thompson2 , and
                                               Stephen J. Déry1
                1 Environmental Science and Engineering Program, University of Northern British Columbia,
                         3333 University Way, Prince George, British Columbia, V2N 4Z9, Canada
             2 Natural Resources and Environmental Studies Program, University of Northern British Columbia,

                         3333 University Way, Prince George, British Columbia, V2N 4Z9, Canada
                                     Correspondence: Stephen J. Déry (sdery@unbc.ca)

                                    Received: 27 March 2018 – Discussion started: 12 April 2018
                        Revised: 14 August 2018 – Accepted: 23 August 2018 – Published: 11 September 2018

       Abstract. This article presents the development of a sub-hourly database of hydrometeorological conditions
       collected in British Columbia’s (BC’s) Cariboo Mountains and surrounding area extending from 2006 to present.
       The Cariboo Alpine Mesonet (CAMnet) forms a network of 11 active hydrometeorological stations positioned
       at strategic locations across mid- to high elevations of the Cariboo Mountains. This mountain region spans
       44 150 km2 , forming the northern extension of the Columbia Mountains. Deep fjord lakes along with old-growth
       western redcedar and hemlock forests reside in the lower valleys, montane forests of Engelmann spruce, lodge-
       pole pine and subalpine fir permeate the mid-elevations, while alpine tundra, glaciers and several large ice fields
       cover the higher elevations. The automatic weather stations typically measure air and soil temperature, relative
       humidity, atmospheric pressure, wind speed and direction, rainfall and snow depth at 15 min intervals. Addi-
       tional measurements at some stations include shortwave and longwave radiation, near-surface air, skin, snow, or
       water temperature, and soil moisture, among others. Details on deployment sites, the instrumentation used and
       its precision, the collection and quality control process are provided. Instructions on how to access the database
       at Zenodo, an online public data repository, are also furnished (https://doi.org/10.5281/zenodo.1195043). Infor-
       mation on some of the challenges and opportunities encountered in maintaining continuous and homogeneous
       time series of hydrometeorological variables and remote field sites is provided. The paper also summarizes on-
       going plans to expand CAMnet to better monitor atmospheric conditions in BC’s mountainous terrain, efforts to
       push data online in (near-)real time, availability of ancillary data and lessons learned thus far in developing this
       mesoscale network of hydrometeorological stations in the data-sparse Cariboo Mountains.

1   Introduction                                                   itation (Kang et al., 2016). The Cariboo Alpine Mesonet
                                                                   (CAMnet; MacLeod and Déry, 2007) is a mesoscale net-
As in many regions worldwide, amplified climate change             work (∼ 100s km2 ) initiated in 2006 by the Northern Hy-
is altering the hydrometeorology of mountainous basins in          drometeorology Group (NHG) at the University of North-
northern British Columbia (BC). Climate change in north-           ern British Columbia (UNBC) to collect long-term hydrocli-
central BC’s mountains is accelerating permafrost degrada-         matological data for the Cariboo Mountains and surround-
tion and thawing (Hasler et al., 2015), snowpack thinning          ing regions. Given the remote and difficult terrain in moun-
(Kang et al., 2016) and glacier retreat (Beedle et al., 2015)      tain environments where atmospheric and snowpack condi-
and decreasing the proportion of snowfall to total precip-         tions vary substantially over small spatial scales, paucity of

Published by Copernicus Publications.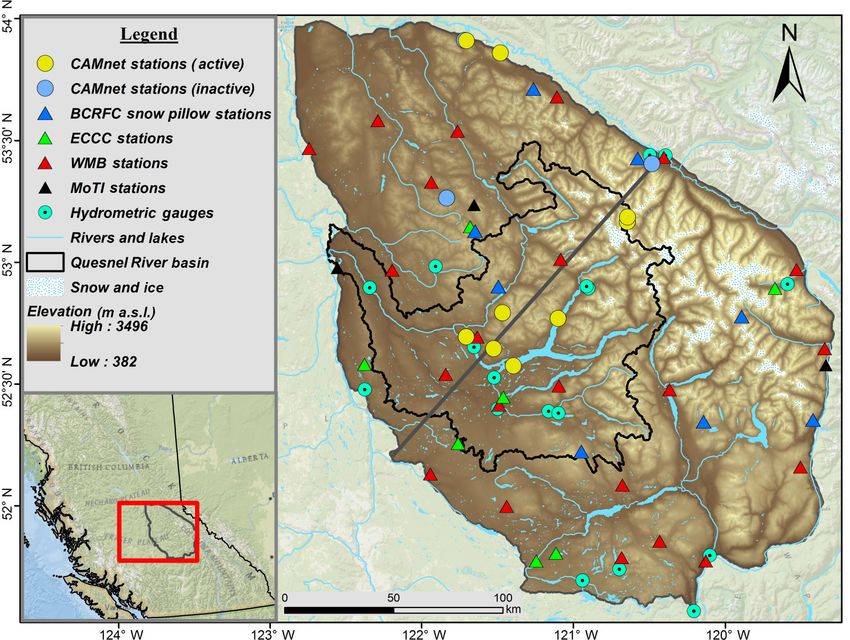
1656                                                              M. A. Hernández-Henríquez et al.: The Cariboo Alpine Mesonet

Figure 1. (a) Hypsometric curve showing the cumulative fraction of the elevation ranges in the Cariboo Mountains region. (b) The number
of active weather stations at different elevations within the Cariboo Mountains region.

observational climate data exists in the world’s alpine re-              provided meteorological data to researchers investigating the
gions (Beniston, 2006; Bradley et al., 2004). This was indeed            long-term physical, chemical and biological effects of the
the case for the Cariboo Mountains where there is relatively             Mount Polley mine tailings impoundment breach in August
good coverage of meteorological stations below the treeline              2014 (see Sect. 3.2) (Petticrew et al., 2015). The CAMnet
elevation of 1700 m a.s.l.; however, coverage is particularly            meteorological datasets thus have the potential to serve mul-
sparse in the higher elevations (Fig. 1). Indeed, there are only         tiple users including the operational forecasting and climate
49 active weather stations in the Cariboo Mountains region               modelling communities, the developers of gridded climate
that spans 44 150 km2 , equivalent to a density of 1.1 station           datasets such as ANUSPLIN (McKenney et al., 2011) and
per 1000 km2 , which is well below the range of one station              ClimateWNA (Wang et al., 2012), water resource managers,
per 100–250 km2 recommended by the World Meteorolog-                     natural hazard mitigators (e.g., for the control of wildfire ac-
ical Organization (WMO) (Miles et al., 2003) and found in                tivity and avalanche potential), and the tourism and recre-
other regions of Canada (e.g., Mekis et al., 2018) or in moun-           ation industries (e.g., heli-skiing operations).
tainous environments such as the European Alps (Gubler et                   The purpose of this article is to document the development
al., 2017). This issue is especially acute at higher elevations          and current status of CAMnet, including the setting in which
as there are currently only six active meteorological stations           the meteorological stations are deployed; the hydrometeo-
above the treeline in the Cariboo Mountains, three of which              rological variables being monitored and collected; efforts to
are part of CAMnet. Thus, CAMnet fills an important obser-               quality control the data; and data processing, archiving and
vational gap to detect climate change at high elevations and             availability. The paper also describes some of the challenges
its impacts to snowpacks, glaciers and water resources.                  and opportunities incurred during the data collection process
   Since the summer of 2006, we have established 11 active               in the remote terrain of the Cariboo Mountains, the availabil-
and 7 deactivated automatic weather stations and 2 radio re-             ity of ancillary data and prospects for future expansion of the
peater stations in valley and mountain settings, at elevations           network in the Cariboo Mountains and beyond.
ranging from 683 to 2105 m a.s.l. (Déry et al., 2010). Data
from these weather stations have supported modelling stud-
ies of seasonal snowpack evolution (Younas et al., 2017),                2   Study area
blowing snow fluxes (Déry et al., 2010), turbulent fluxes on
a mountain glacier (Radić et al., 2017), glacial retreat (Bee-          The Cariboo Mountains region spans ∼ 44 150 km2 in the
dle et al., 2009, 2015) and pro-glacial sediment transport dy-           central interior of BC, forming the northernmost range of
namics (Leggat et al., 2015; Stott et al., 2016). These data             the Columbia Mountains between the Interior Plateau and
have also been used to validate remote sensing products of               Rocky Mountain Trench (Fig. 2). Elevations in the Cariboo
snow (Tong et al., 2009a, b, 2010), gridded meteorological               Mountains range from 330 m a.s.l. in the valley bottoms to
datasets (Sharma and Déry, 2016) and output from numerical               3520 m a.s.l. at its highest peak, Mount Sir Wilfrid Laurier
weather prediction models over complex terrain (Schirmer                 (Sharma, 2014). The climate in the Cariboo Mountains re-
and Jamieson, 2015). More recently, CAMnet stations have                 mains drier than the Coast Mountains to the west, but wetter
                                                                         than the Interior Plateau to the west and Rocky Mountains

Earth Syst. Sci. Data, 10, 1655–1672, 2018                                                www.earth-syst-sci-data.net/10/1655/2018/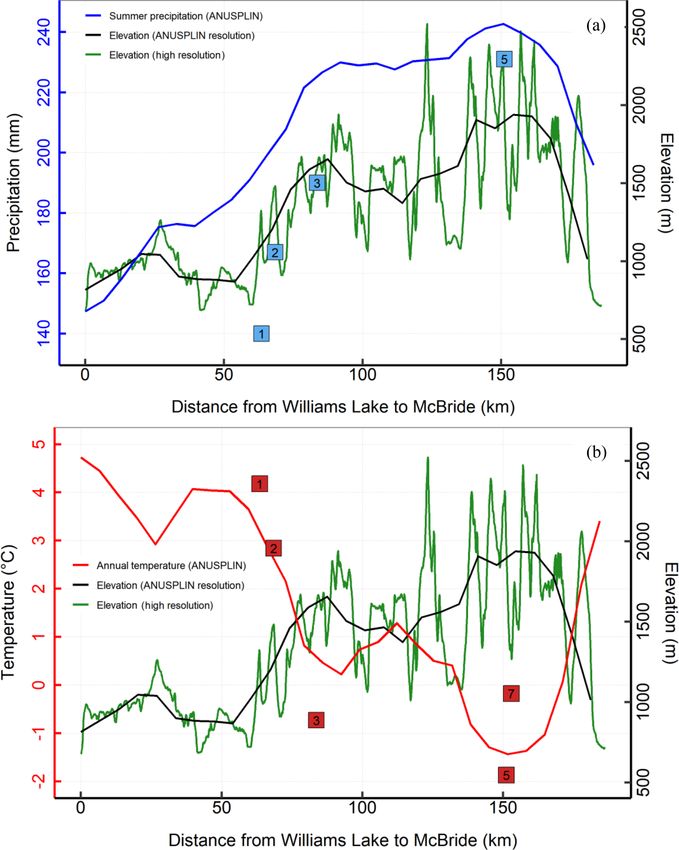
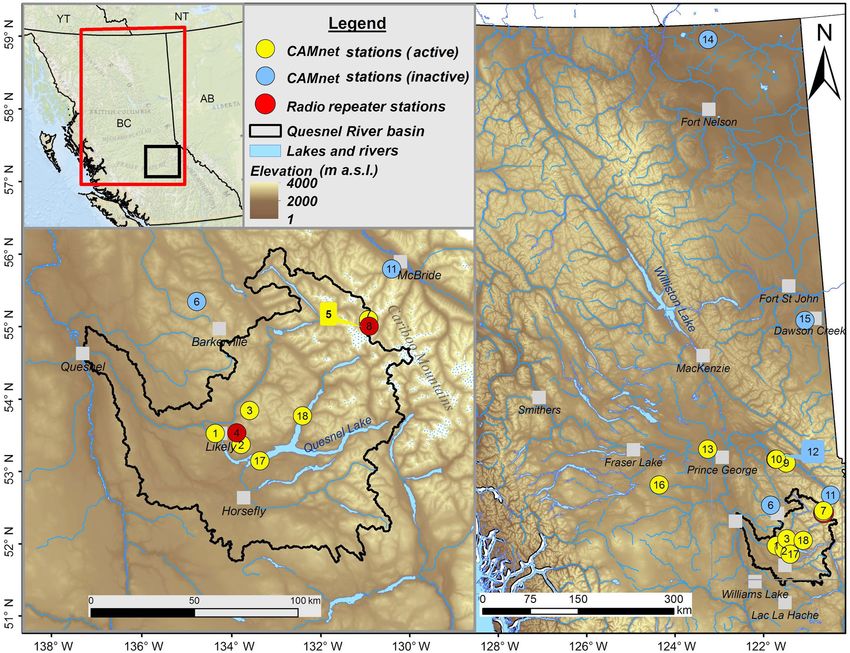
M. A. Hernández-Henríquez et al.: The Cariboo Alpine Mesonet                                                                       1657

Figure 2. Topographic map of the Cariboo Mountains region including the Quesnel River basin. Dots and triangles show the location of
active weather, snow pillow and hydrometric stations operated by different agencies in this region including the BC River Forecast Centre
(BCRFC), Environment and Climate Change Canada (ECCC), BC Wildfire Management Branch (WMB), and BC Ministry of Transportation
and Infrastructure (MoTI). The grey line depicts a transect between Williams Lake and McBride, BC, for which climate data are extracted
(see Fig. 6).

to the east (Beedle et al., 2015). On the windward side of             heather Alpine, Engelmann Spruce-Subalpine Fir, Interior
the Cariboo Mountains in Quesnel, BC, the total annual pre-            Cedar-Hemlock, Sub-boreal Spruce, and Sub-boreal Pine
cipitation averages ≈ 500 mm but increases to > 2000 mm                and Spruce). The terrain varies from relatively flat to moun-
150 km further east (Burford et al., 2009). Annual air tem-            tainous with a mean elevation of 1375 m a.s.l, rising from
perature averages 1.8 ◦ C ± 1.0 ◦ C over the Cariboo Moun-             ∼ 500 m a.s.l. in the west to ∼ 3000 m a.s.l. in the northeast.
tains region, with January being the coldest month (average            Glaciers cover ∼ 2 % of the watershed while deep fjord lakes
air temperature of −10.1 ◦ C ± 1.1 ◦ C) and July the warmest           (e.g., Quesnel Lake with depths surpassing 500 m) reside in
(average air temperature of 12.9 ◦ C±1.8 ◦ C). Average annual          steep valleys. The mountainous terrain and snowy climate
total precipitation in this region reaches 739 mm ± 140 mm             provide a suitable environment for the world’s largest inland
with nearly half falling as snow (Sharma, 2014). The rel-              temperate rainforest (Stevenson et al., 2011; Farley, 1979).
ative amount of snow accumulation increases with altitude              Situated along the Quesnel River sits UNBC’s Quesnel River
(Burford et al., 2009). Peak snow accumulation commonly                Research Centre (QRRC; http://www.unbc.ca/qrrc, last ac-
surpasses 1000 mm water equivalent near the treeline (Déry             cess: 3 July 2018) that includes a large workshop, laboratory,
et al., 2014) and snow cover often persists from October               office space and housing residence. This unique combination
through June (Tong et al., 2009a). Annual peak flows in                of landscape and research infrastructure makes the watershed
the creeks and rivers draining the Cariboo Mountains follow            an ideal location for collecting high-elevation hydrometeoro-
snowmelt with general declines in summer although moder-               logical data.
ated through glacier melt into fall prior to entering the low-
flow season during winter when precipitation accumulates in
the seasonal snowpack (Burford et al., 2009).
   Within the North Cariboo region of BC lies the ∼
12 000 km2 Quesnel River basin, covering six biogeocli-
matic zones (Boreal Altai Fescue Alpine, Interior Mountain-

www.earth-syst-sci-data.net/10/1655/2018/                                              Earth Syst. Sci. Data, 10, 1655–1672, 2018
1658                                                                             M. A. Hernández-Henríquez et al.: The Cariboo Alpine Mesonet

Table 1. Details for each CAMnet station.

      Station   Name                                         Latitude       Longitude      Elevation     Terrain                      Date of           Date of
                                                              (◦ N)           (◦ W)         (m a.s.l.)                                deployment        decommission
      1         QRRCa                                      52◦ 370 0600    121◦ 350 2400          743    Flat short grass             11 Aug 2006
      2         Spanish Mountain                           52◦ 330 4800    121◦ 240 3500         1509    Sloped forest regrowth       30 Jun 2006
      3         Browntop Mountain                          52◦ 420 2800    121◦ 200 0200         2030    Alpine ridge                 23 Aug 2006
      4         Blackbear Mountain radio repeaterb         52◦ 360 5300    121◦ 260 1200         1590    Sloped forest regrowth       24 Aug 2006
      5         Upper Castle Creek Glacier                 53◦ 020 3400    120◦ 260 1500         2105    Bedrock ridge                28 Aug 2007
      6         Mount Tom                                  53◦ 110 3200    121◦ 390 4900         1490    Sloped cutblock              20 Sep 2007       15 Sep 2009
      7         Lower Castle Creek Glacier                 53◦ 030 4500    120◦ 260 0400         1803    Flat moraine                 13 Aug 2008
      8         Castle Creek Glacier radio repeater        53◦ 020 0300    120◦ 250 5700         2219    Bedrock ridge                1 Aug 2009
      9         Ancient Forest                             53◦ 460 2100    121◦ 130 4400          774    Old-growth forest            7 Oct 2009
      10        Lunate Creek                               53◦ 490 5600    121◦ 270 3200          953    Regenerating clear cut       17 May 2010
      11        Lucille Mountain                           53◦ 160 2200    120◦ 140 1800         1587    Planted cutblock             7 Jul 2010        10 Jul 2013
      12        Upper Lunate Creek                         53◦ 500 0200    121◦ 280 2100         1134    Regenerating clear cut       23 Aug 2011       29 Jul 2012
      13        Ness Lake                                  54◦ 010 2700    123◦ 050 3500          763    Flat short grass             30 Jul 2012
      14        Coles Lake                                 59◦ 470 2200    122◦ 360 4300          479    Flat – bulldozed             11 Jun 2013       29 Jul 2015
      15        Kiskatinaw                                 55◦ 450 0400    120◦ 310 2700          726    Flat long grass              20 Aug 2015       15 Jun 2017
      16        Tatuk Lake                                 53◦ 320 4100    124◦ 160 3600          938    Flat short grass             29 Sep 2015
      17        Plato Point                                52◦ 290 1500    121◦ 170 0300          728    Sandy beach                  17 Aug 2016
      18        Long Creek                                 52◦ 400 0600    120◦ 570 3400          728    Gravel beach                 26 Jun 2017
a Quesnel River Research Centre. b The Blackbear Mountain weather station was dismantled in July 2007 and became a radio repeater station to facilitate communication
and data download at the QRRC.

3     Hydrometeorological stations                                                         data downloads and routine maintenance occur at a minimum
                                                                                           once a year at all stations (see Sect. 4.1).
3.1        Overview
                                                                                           3.2    Chronological development
As of 31 March 2018, CAMnet comprises 11 active meteoro-                                   Having identified a significant observational gap in the Cari-
logical stations and two radio repeaters positioned at strate-                             boo Mountains and addressing the needs of the QRRC’s ex-
gic locations, predominantly at mid- to high elevations within                             panding research operations, UNBC’s NHG established its
the Quesnel River basin and the surrounding Cariboo Moun-                                  first four CAMnet weather stations during the summer of
tains of north-central BC (Figs. 3 and 4, Table 1). Specifi-                               2006 in the vicinity of Likely, BC. Given the QRRC’s avail-
cally, the Quesnel watershed hosts five active CAMnet sta-                                 ability to other UNBC researchers and those at other insti-
tions, the Upper and Lower Castle Creek Glacier stations re-                               tutions, a dedicated effort was made to establish a standard
side on its eastern divide, and four others reside near Prince                             meteorological station with an extended suite of instrumen-
George and its vicinity. At each station, instruments mea-                                 tation on the research centre’s property. This station became
sure atmospheric pressure, 2 m air temperature and relative                                operational on 11 August 2006 and is located 2 km south-
humidity (with respect to water), wind speed and direction,                                west of Likely, BC, in an incised valley ∼ 100 m south of the
liquid precipitation and snow depth among other variables                                  Quesnel River at an elevation of 743 m a.s.l. This is the only
that are only measured at specific stations (e.g., soil mois-                              CAMnet weather station with a permanent 10 m tower with a
ture, solar radiation, and near-surface air, snow, soil and wa-                            concrete foundation for the tower footing and guy wires for
ter temperature) (Supplement Table S1). All the sensors are                                anchoring. There is 50 % sky visibility at the site and, given
powered by 12 V batteries charged during the day by solar                                  its location, accessibility remains easy. Vegetation consists
panels; however, both the QRRC and Ness Lake weather sta-                                  of grasses, western redcedar, hemlock and some Douglas
tions run on alternating current (AC) supplemented by bat-                                 fir. A CR23X data logger controls the entire weather station
teries in case of electrical interruptions. The QRRC station                               and accommodates the additional programming capacity and
records incoming and outgoing shortwave and longwave ra-                                   power supply needed to run a full radiometer and associated
diation in addition to the parameters measured by the remote                               heater, installed 5 m above bare ground. Winds are measured
stations. Table 2 lists the specifications of each instrument,                             at 10 m above the surface while air temperature and relative
including their accuracy and precision. Data loggers record                                humidity are gauged 2 m above bare ground. This site also
the meteorological parameters and store data every 15 min.                                 benefits from access to AC power to operate a heated pre-
Stations located within the QRRC’s proximity periodically                                  cipitation gauge surrounded by an Alter shield. Data are pe-
send data via spread-spectrum radio to the operational base                                riodically sent to the QRRC operational base computer via
computer located in the housing residence (see Sect. 4.2).                                 spread-spectrum radio.
Despite remote data access for several stations, site visits for

Earth Syst. Sci. Data, 10, 1655–1672, 2018                                                                     www.earth-syst-sci-data.net/10/1655/2018/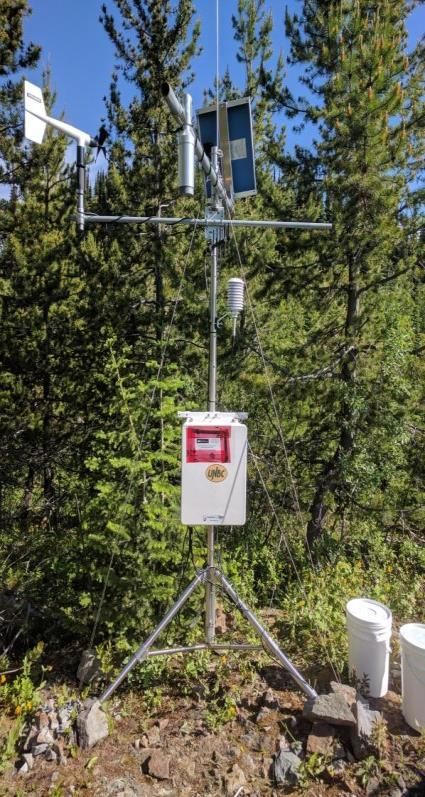
M. A. Hernández-Henríquez et al.: The Cariboo Alpine Mesonet 1659
Table 2. Specifications for sensors used at each CAMnet station. NA – not available.
Sensor Model Measurements Units Sensitivity Accuracy Operating range
Spread-spectrum ra- RF401 NA NA −109 dBm NA −25 to 50 ◦ C
dio
61205V Atmospheric 0.1 hPa ±0.5 hPa 600–1100 hPa
Barometric pressure hPa
61205V-10 pressure
sensor
61302V Atmospheric 0.1 hPa ±0.2 hPa (25 ◦ C) 500–1100 hPa
pressure hPa ±0.3 hPa (−50 to +60 ◦ C)
CS106 Atmospheric hPa NA ±0.3 hPa (20 ◦ C) −40 to 60 ◦ C
pressure ±0.6 hPa (0 to 40 ◦ C) 500–1100 hPa
±1.0 hPa (−20 to +45 ◦ C)
±1.5 hPa (−40 to +60 ◦ C)
HMP35C Air temperature ◦C NA ±0.1 ◦ C
HMP45C
Relative humidity −40 to 60 ◦ C
HMP45C212
and air temperature
probe Relative humidity % NA ±2 % (0–90 % RH) at 20 ◦ C
±3 % (90–100 % RH) at 20 ◦ C
HMP60 Air temperature ◦C NA ±0.6 ◦ C (−40 to +60 ◦ C)
Relative humidity % NA ±3 % RH (0–90 % RH)
±5 % RH (90–100 % RH)
HC-S3 Air temperature ◦C NA ±0.2 ◦ C (−30 to 60 ◦ C)
−40 to 60 ◦ C
Relative humidity % NA ±1.5 % at 23 ◦ C
107B Soil temperature ◦C NA ±0.4 ◦ C (−24 to 48 ◦ C)
Temperature probe −50 to 100 ◦ C
±0.9 ◦ C (−35 to 50 ◦ C)
109 Soil temperature ◦C NA ±0.60 ◦ C (−50 to 70 ◦ C)
109B ±0.25 ◦ C (−10 to 70 ◦ C)
RM Young wind 05103-10 Wind speed m s−1 NA ±0.3 m s−1
−50 to 50 ◦ C
monitor 05103-45
Wind direction degrees NA ±5◦
34-HT-P Liquid/solid precipita- mm 0.25 mm per tip Precipitation rate: −20 to 50 ◦ C
Tipping bucket tion ±0.25 mm up to 20 mm h−1
rain gauge ±3 % over 20 mm h−1
TE525WS Liquid precipitation mm 0.254 mm Precipitation rate:
per tip ±1 % up to 25.4 mm h−1
0 to 50 ◦ C
+0, −2.5 % from 25.4 to
50.8 mm h−1
+0, −3.5 % from 50.8 to 76.2 mm h−1
TE525M Liquid precipitation mm 0.1 mm per tip Precipitation rate:
±1 % up to 25.4 mm h−1
+0, −2.5 % from 25.4 to
50.8 mm h−1
+0, −3.5 % from 50.8 to 76.2 mm h−1
TR-525USW Liquid precipitation mm 0.254 mm per tip Precipitation rate:
1 % at 25.4 mm h−1 or less
Ultrasonic distance SR50 Snow depth cm 0.1 mm ±1 cm or 0.4 % of distance to target
measurement (whichever is greater)
SR50A Snow depth cm 0.25 mm ±1 cm or 0.4 % of distance to target −45 to 50 ◦ C
(whichever is greater)
Water content CS616 Soil moisture % volumet- < 0.1 % VWC ±2.5 % VWC using standard calibra- 0 to 70 ◦ C
reflectometer ric water tion with bulk electrical conductivity
content (EC) ≤ 0.5 dS m−1 and
(VWC) bulk density ≤ 1.55 g cm−3
in measurement range
0 to 50 % VWC
CS650 Soil moisture % VWC < 0.05 % VWC ±3 % (typical with factory VWC −50 to 70 ◦ C
model) where solution EC < 3 dS m−1
www.earth-syst-sci-data.net/10/1655/2018/ Earth Syst. Sci. Data, 10, 1655–1672, 2018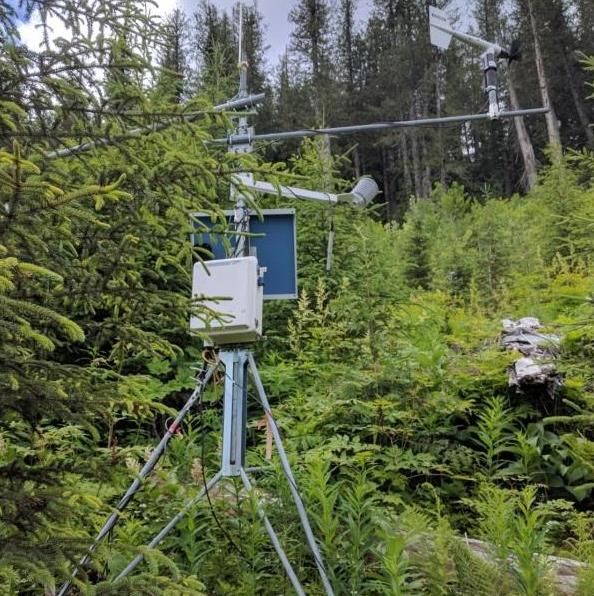
1660                                                               M. A. Hernández-Henríquez et al.: The Cariboo Alpine Mesonet

Table 2. Continued.

 Sensor                   Model      Measurements          Units     Sensitivity               Accuracy                                Operating range
                          CNR1       Shortwave up/down,                                                                                −40 to 70 ◦ C
                                                           W m−2     6.18 µV (W m−2 )−1        ±10 % of daily totals
                                     Longwave up/down
                          CMP3       Shortwave up/down                                                                                 −40 to 80 ◦ C
                                                           W m−2     5 to 20 µV (W m−2 )−1     ±10 % of daily totals
 Radiometer/
 pyranometer
                          SP LITE2   Shortwave up/down               81 µV (W m−2 )−1                                                  −40 to 80 ◦ C
                                                           W m−2                               ±5 % of daily totals
                                                                     < ±2 % shift per year
                          LI 200R                                                              Absolute error in natural daylight is
                                                           W m−2     7 to 15 µV (W m−2 )−1
                                     Shortwave up/down                                         ±5 % maximum; ±3 % typical              −40 to 65 ◦ C
                          LI 190SB                                   5 µA                per   Maximum deviation of 1 % up to
                                                                     1000 µmoles s−1 m−2       10 000 µmoles s−1 m−2
 Precision infrared ra-   SI-111     Surface temperature   ◦C        ±0.1 ◦ C @                ±0.2 ◦ C @ −10 to 65 ◦ C                −55 to 80 ◦ C
 diometer                 (IRR-P)                                    −10 to 65 ◦ C             (where target temperature is within     0 to 100 % RH
                                                                     ±0.3 ◦ C @                20 ◦ C of sensor body temperature)
                                                                     −40 to 70 ◦ C             ±0.5 ◦ C @ −40 to 70 ◦ C
                                                                                               (where target temperature is > 20 ◦ C
                                                                                               of sensor body temperature)

Figure 3. Map of north-central BC showing the location of active and inactive CAMnet weather and radio repeater stations, numbered as in
Table 1.

   Three additional weather stations mounted on 3 m tripods              forestry roads and/or hiking trails) and were within line of
were also deployed during summer 2006 near Likely, BC, in                sight of each other, with one station being within line of sight
an attempt to capture the effects of elevation gradients on              of the QRRC. All were equipped with identical instrumenta-
atmospheric conditions in the Cariboo Mountains. Factors                 tion to measure 2 m air temperature and relative humidity,
leading to the selection of Spanish, Browntop and Black-                 3 m wind speed and direction, atmospheric pressure, snow
bear mountains as deployment sites included their range in               depth, rainfall and soil temperature at 10–15 cm in depth.
elevations (1500–2000 m a.s.l.) and accessibility (deactivated           Stations at Spanish and Blackbear mountains were installed

Earth Syst. Sci. Data, 10, 1655–1672, 2018                                                   www.earth-syst-sci-data.net/10/1655/2018/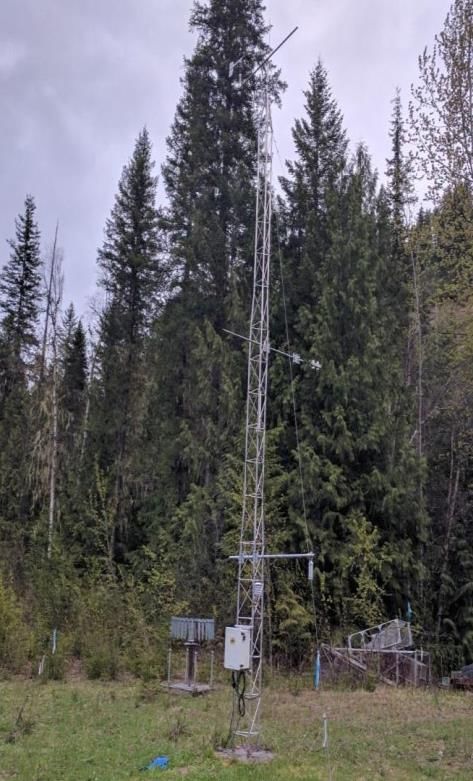
M. A. Hernández-Henríquez et al.: The Cariboo Alpine Mesonet                                        1661

       (a)                                    (b)                  (c)

       (d)                                    (e)                  (f)

       (g)                                  (h)                    (i)

Figure 4.

www.earth-syst-sci-data.net/10/1655/2018/                      Earth Syst. Sci. Data, 10, 1655–1672, 2018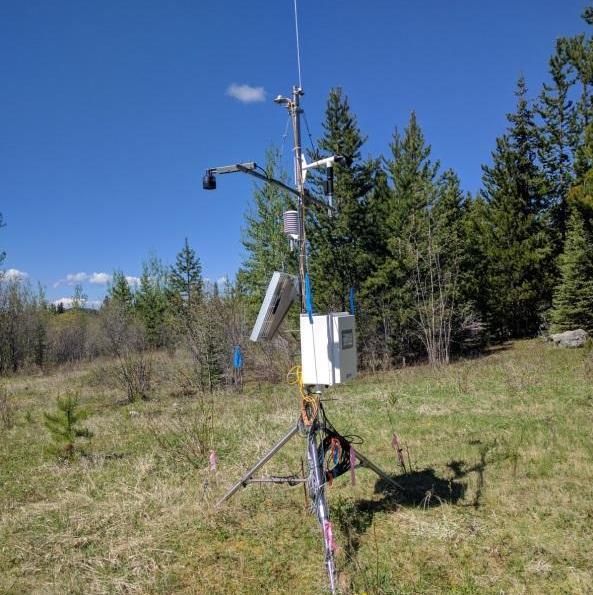
1662 M. A. Hernández-Henríquez et al.: The Cariboo Alpine Mesonet
(j) (k) (l)
(m) (n) (o)
(p)
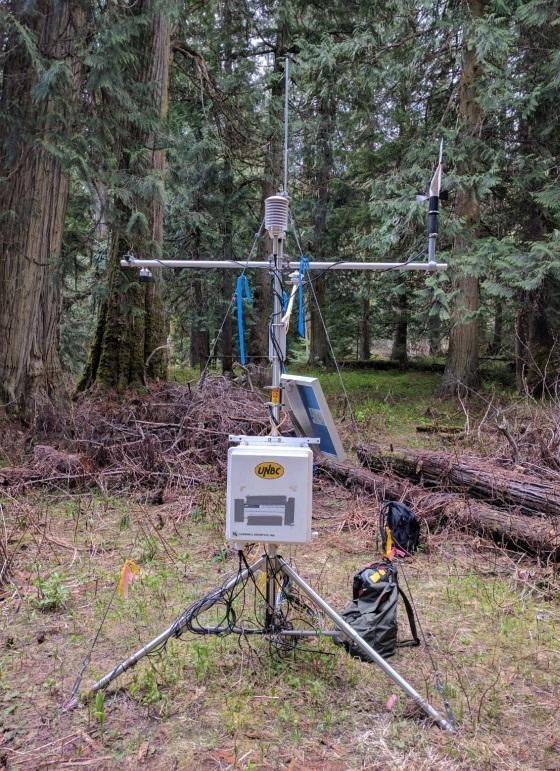
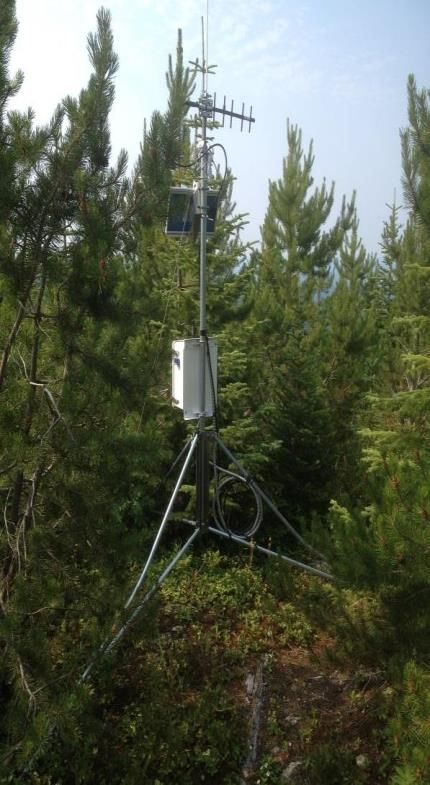
Figure 4. Photos of CAMnet weather stations: (a) QRRC in May 2017 (el. 743 m), (b) Spanish Mountain in June 2017 (el. 1509 m),
(c) Blackbear Mountain radio repeater in July 2015 (el. 1509 m), (d) Browntop Mountain in June 2017 (el. 2030 m), (e) Upper Castle Creek
Glacier in September 2015 (el. 2105 m), (f) Mount Tom in September 2008 (el. 1490 m), (g) Lower Castle Creek Glacier in September 2015
(el. 1803 m), (h) Castle Creek Glacier radio repeater in August 2009 (el. 2219 m), (i) Ancient Forest in May 2017 (el. 774 m), (j) Lunate
Creek in June 2017 (el. 953 m), (k) Ness Lake in June 2015 (el. 763 m), (l) Tatuk Lake in May 2017 (el. 938 m), (m) Plato Point in May 2017
(el. 728), (n) Kiskatinaw in August 2015 (el. 726 m), (o) Coles Lake in July 2015 (el. 479 m) and (p) Long Creek in June 2017 (el. 728 m).
Earth Syst. Sci. Data, 10, 1655–1672, 2018 www.earth-syst-sci-data.net/10/1655/2018/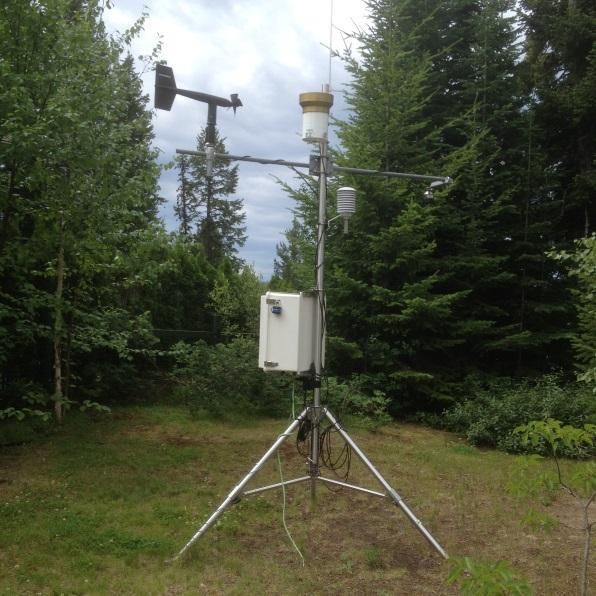
M. A. Hernández-Henríquez et al.: The Cariboo Alpine Mesonet                                                                 1663

in similar terrain (regenerating cutblocks of lodgepole pine       Operations and Rural Development’s (FLNRORD) Mt. Tom
stands) and elevations such that the meteorological condi-         adaptive management trial. The spatial distribution of snow
tions between the two exhibited little differences. As such,       cover in forested and clear-cut areas of different sizes as well
the meteorological instrumentation at Blackbear Mountain           as soil moisture memory was the focus of these two projects.
was decommissioned during the summer of 2007 but the ra-           Weekly snow survey data during one ablation season in addi-
dio repeater was retained to act as the communication hub be-      tion to snow/surface temperatures were collected during this
tween the remote Spanish and Browntop Mountain stations            experiment.
and the operational base computer. The Browntop Mountain              Following the completion of the two graduate student
weather station lies at 2030 m a.s.l. in the alpine terrain on     projects at Mt. Tom, the equipment was transferred in Oc-
an exposed ridge and endures excessive winds approaching           tober 2009 to a site at the Ancient Forest ∼ 100 km east of
40 m s−1 in some storms. These high winds have been quite          Prince George at an elevation of 775 m a.s.l. The station was
challenging in keeping the entire station operational, with the    installed a few hundred metres from the Yellowhead High-
continuity of readings frequently disrupted through instru-        way in a small clearing in the inland temperate rainforest sit-
ment damage (including the loss of multiple anemometers),          uated on the northwestern border of the Cariboo Mountains
icing and power malfunctions. A tipping bucket rain gauge          (Stevenson et al., 2011), now within the boundary of the An-
was eventually dismantled on 11 July 2012 due to its low           cient Forest/Chun T’oh Whudujut Provincial Park created in
capacity to capture precipitation even when protected with         2016. The damp, low-lying characteristics of this old-growth
an Alter shield. While a SR50 remains in operation at this         forest limit sky visibility and expose the site to abundant pre-
site it rarely measures > 10 cm of snow as winds continually       cipitation in all seasons with heavy snowfall during winter.
erode it from the ridge top towards the lee side of Browntop       Ground cover vegetation consists of large ferns, tall grasses
Mountain where massive snowdrifts form and persist during          and dense Devil’s club. Measurements at this site include soil
summer.                                                            moisture at three depths down to 65 cm. The CR10X data
   Equipment previously installed at Blackbear Mountain            logger at this site was replaced with a CR1000 in August
was moved during August 2007 to a bedrock ridge at                 2013, while the tripod and a cross arm were replaced in Au-
2105 m a.s.l. near Castle Creek Glacier, 40 km west of             gust 2015 following a near-direct hit by a felled old-growth
McBride, BC, to support research of the Western Canadian           western redcedar. This station provides critical information
Cryospheric Network. Despite its exposed and remote lo-            on BC’s great “snowforest” in a changing climate includ-
cation, the station has experienced only a few minor issues        ing support for ongoing ecosystem, ecological and outdoor
mainly from strong winds affecting precipitation measure-          recreation and tourism research at UNBC. It also serves rou-
ments, with the loss on several occasions of the tipping           tinely as a field site for a snow survey conducted by UNBC
bucket rain gauge’s funnel and/or filter. A second weather         students enrolled in a course titled “Snow and Ice”.
station was installed at 1803 m a.s.l. in 2008, ∼ 700 m in the        In proximity to the Ancient Forest, a basic meteorological
Castle Creek Glacier forefield to complement the data be-          station at Lunate Creek was acquired from the BC Ministry
ing collected at higher elevation. The Lower Castle Creek          of FLNRORD in May 2010. The equipment at the station
Glacier weather station is unique in the CAMnet network in         was fully updated and deployed in a regenerating western
measuring air temperature, relative humidity, wind speed and       redcedar and hemlock cutblock at an elevation of 953 m a.s.l.
direction at two heights (4.1 and 2.7 m) above the surface on      The tower sits on a 20◦ north-facing slope overlooking the
a 6 m mast, allowing estimates of turbulent sensible and la-       Rocky Mountain Trench. Owing to bear and rodent activity
tent heat fluxes. This site also contains an array of sensors to   along with the minimal incoming solar radiation during win-
measure near-surface air or snow, skin surface and soil tem-       ter this site has experienced periodic power interruptions and
peratures. A tipping bucket rain gauge protected by an Alter       thus suffers extended data gaps. A second weather station
shield was added to the site on 21 August 2012. Both Castle        was installed on a neighbouring cutblock at 1134 m a.s.l. to
Creek Glacier weather stations are within line of sight of a       monitor upslope conditions during a period of 1 year in sup-
radio repeater mounted in August 2009 on a bedrock ridge           port of a graduate student project that quantified the contribu-
at 2219 m a.s.l. facing eastward towards Castle Creek Valley.      tion of snowmelt to soil moisture replenishment on the area’s
Combined, the two weather stations at Castle Creek Glacier         steep inclines. The toe slopes of the Cariboo Mountains are
provide a nearly continuous record of atmospheric and snow         well known for their abundant soil moisture and springs even
conditions exceeding a decade that complement well ongo-           during dry summer periods, with these water resources vital
ing efforts to monitor the glacier’s mass balance using push       in sustaining the Ancient Forest’s old-growth forest stands.
moraines, geodetic and remote sensing techniques.                     Similarly to the Lunate Creek site, another weather station
   A basic weather station was installed in 2007 for a period      was acquired from BC Ministry of FLNRORD in July 2010
of 2 years at Mt. Tom, in the Cariboo Highlands near Wells         at Lucille Mountain, west of McBride, BC. The weather
and Barkerville, BC, to support the research projects of two       station is deployed in a regenerating cutblock (planted) at
UNBC graduate students. This research was in collaboration         an elevation of 1587 m a.s.l. and faces the Rocky Mountain
with the BC Ministry of Forests, Lands, Natural Resource

www.earth-syst-sci-data.net/10/1655/2018/                                         Earth Syst. Sci. Data, 10, 1655–1672, 2018
1664                                                           M. A. Hernández-Henríquez et al.: The Cariboo Alpine Mesonet

Trench. Due to its difficult access and animal activity, the        tion (∼ 1000 m2 ) where there is ∼ 85 % sky visibility. Tall
station has not been visited nor maintained since 2013.             grasses, shrubs and rocky soil characterize the site. This sta-
   Following the conclusion of the intensive field campaign at      tion also serves as a reliable source of meteorological in-
Lunate Creek, its upper station was transferred in July 2012        formation for local communities of the Nechako watershed
to Ness Lake, ∼ 35 km northwest of UNBC on the property             and as a demonstration site for local elementary and middle
of the senior and corresponding author. The weather station         school students.
lies ∼ 25 m from the eastern shore of Ness Lake at an eleva-            The catastrophic failure of a tailings pond impoundment
tion of 763 m a.s.l. The tower has only ∼ 75 % sky visibility       at Mount Polley mine near Likely, BC, in August 2014 (Pet-
since it is deployed in an area with large Douglas firs and two     ticrew et al., 2015) renewed interest in monitoring closely
nearby residences. Data collected contribute to studying the        atmospheric conditions at Quesnel Lake and the surround-
effects that public recreational use has on Ness Lake wave          ing area. While CAMnet included three weather stations near
activity and shoreline erosion. This site also serves to train      Likely, none was located on the shores of Quesnel Lake. To
students and research staff on the use of the meteorological        fill this observational gap, two lake-level sites were chosen
equipment; testing new, damaged or repaired equipment; and          for weather station deployment in August 2016 and 2017.
data logger programming and has also provided meteorolog-           The Plato Point weather station is located 22 km southeast
ical resources for UNBC courses. This site benefits from ac-        of Likely on the sandy shoreline of Quesnel Lake just east
cess to AC power and the internet, facilitating automatic data      of the Plato Island Resort. The tower sits at an elevation of
transfers to a computer server at UNBC.                             728 m a.s.l. and has ∼ 90 % sky visibility. The station has
   To support a graduate student’s project investigating the        excellent exposure in all cardinal directions except towards
water balance of a small boreal lake and its watershed, a           the south, allowing measurement of long-fetch winds aligned
weather station was deployed at Coles Lake, ∼ 100 km north          along the principal axis of Quesnel Lake’s main basin. Dur-
of Fort Nelson, BC, near the border to the Northwest Territo-       ing spring snowmelt, water levels rise, partially submerging
ries in June 2013. The weather station resided ∼ 500 m north        the station. Two additional probes measure water and near-
of Coles Lake on the property of Quicksilver Inc., an oil and       surface air temperatures. In the summer of 2017, the equip-
gas extraction company that, along with the BC Ministry of          ment from the Kiskatinaw watershed weather station was
FLNRORD, supported the research. Apart from the meteoro-            moved to Long Creek, on a gravel beach along the shore-
logical data collected at the weather station, ancillary data in-   line of Quesnel Lake approximately halfway up its north arm.
cluded rainfall at three additional sites under various vegeta-     The tower is deployed at an elevation of 728 m a.s.l. and has
tion canopies, snow depth and snow water equivalent through         ∼ 75 % sky visibility. Small shrubs and mature conifers flank
biweekly snow surveys at three sites during one ablation sea-       the western side of the station that otherwise benefits from
son, Coles Lake inflows and outflows, shallow groundwater           excellent exposure in all other cardinal directions. Both the
levels with three piezometer nests along the lakeshore and          Plato Point and Long Creek weather stations allow detection
lake skin surface water temperature.                                of wind storms that generate basin-scale hydrodynamic pro-
   Completion of the field campaign at Coles Lake allowed           cesses in Quesnel Lake, leading to possible resuspension of
its station to be moved to the Kiskatinaw watershed in the          mine tailings sediments deposited on the lake bottom during
summer of 2015. The site was located 300 m south of Arras           the 2014 spill.
Road and the John Hart Highway, ∼ 19 km west of Dawson
Creek, BC. The tower was installed in a ∼ 4000 m2 open-             3.3   Equipment used at each site
ing atop a small hill ∼ 60 m north of the Hansen Reservoir.
Ground cover consisted of unmaintained grass and the sur-           The majority of the meteorological equipment was purchased
rounding area is composed of mixed deciduous–coniferous             from Campbell Scientific Canada (CSC) and its suppliers;
trees and agricultural plots. Data for this station supported       however, this report should not be construed as an endorse-
a graduate student’s study on the prediction of the spring          ment of their products. Sole use of CSC equipment at nearly
freshet in the Kiskatinaw River that supplies domestic, com-        all CAMnet sites facilitates data cross comparisons, equip-
mercial and industrial water for Dawson Creek and surround-         ment substitutions, student and research staff training, and
ing communities.                                                    ensures the homogeneity of the hydrometeorological records
   In a continuing effort to improve and integrate knowl-           (see Sect. 5.2). Most remote stations are assembled on 3 m
edge on the Nechako River (a major tributary to the Fraser          tripods (i.e., CM110 or UT10) anchored to the ground to
River) and its watershed, a weather station was deployed at         maintain the orientation of the tower, ensure proper posi-
Tatuk Lake, BC, in September 2015. The weather station              tioning of sensors and prevent electrical damage from light-
stands ∼ 250 m from the northern shore of Tatuk Lake in             ning strikes. Most of the sensors are installed and configured
the headwaters of the Chilako River, ∼ 75 km south of Van-          as recommended in the manuals (e.g., anemometers ∼ 3 m
derhoof, BC. It resides on the Tatuk Lake Resort’s private          above the ground surface and the air temperature and humid-
property, which provides safe and secure year-round access.         ity sensors ∼ 2 m above the ground surface). However, the
The tower sits at an elevation of 938 m a.s.l. in an open sec-      precipitation gauges were an exception since the construc-

Earth Syst. Sci. Data, 10, 1655–1672, 2018                                          www.earth-syst-sci-data.net/10/1655/2018/
M. A. Hernández-Henríquez et al.: The Cariboo Alpine Mesonet                                                                   1665

tion of concrete footings was not feasible at the remote sites.     4     Data collection
Instead, the precipitation gauges were typically installed on
1.2 m × 1.2 m platforms anchored to the ground with rebar           4.1    Frequency
to support and level the rain gauges as well as the Alter wind
screens that reduce the effects of wind and turbulence on pre-      Data loggers were programmed using the Loggernet SCWin,
cipitation measurements. Most of the remote stations employ         CRBasic and Edlog software from CSC. All of the station
CR1000 data loggers from CSC to power and operate the               programs employ scan intervals of 1 min and data intervals
sensors. A CR23X data logger is used at the QRRC station            of 15 min. Depending on the sensors and the specific variable
to run the sensors as it can provide the necessary power to en-     being measured, sampling either occurs once every 15 min or
gage the CNR1 net radiometer heater. Supplement Table S1            is measured for the entire data interval and averaged. Some
provides a detailed summary of the equipment and sensors            of the measurements are also simply summed over the 15 min
used at each CAMnet station.                                        period, such as precipitation and incoming solar radiation.
                                                                    Regardless of the sampling interval, all collected data are
                                                                    stored in 15 min timestamps in the data logger memory and
3.4   Precision and accuracy of the instrumentation
                                                                    the database spreadsheets.
Table 2 provides the specifications, including precision and           All CAMnet weather stations are visited at least once an-
sensitivity, for sensors used at each CAMnet station. These         nually for data downloads and maintenance, although repeat
sensors are manufactured to withstand strong variations in          visits are not feasible at the most remote sites (i.e., Upper and
environmental conditions and often remain unattended for            Lower Castle Creek Glacier weather stations) given access is
lengthy periods of time. Most of the instruments, including         often by helicopter. All other sites, however, are usually vis-
the tipping bucket rain gauges, barometers and wind moni-           ited two to four times a year, while others such as the Ques-
tors, are initially calibrated and come with a certificate of ac-   nel River Research Centre (QRRC) and Ness Lake are easily
curacy. Depending on the amount of usage and the presence           accessible and thus serviced much more regularly. The fre-
of adverse atmospheric conditions, some of the CAMnet in-           quency of visits escalates during intensive field campaigns in
strumentation undergoes periodic recalibration, as maintain-        association with a student’s research project or accelerated to
ing the precision and quality of data remains of utmost im-         address promptly a known technical or instrumental issue.
portance to the development of the database. Recalibration
and regular maintenance are completed if the quality of the
                                                                    4.2    Automated data transfers
data being sampled starts to become affected or if there is ob-
vious damage to the instrumentation. Common errors in sam-          Spread-spectrum radios facilitate communication and auto-
pling precision and accuracy stem from worn-out equipment           mated data transfers between the weather stations at Span-
such as the depth-to-target data recorded by the SR50 ultra-        ish Mountain, Browntop Mountain and Blackbear Mountain
sonic depth sensor that can contain outlying values when the        (no longer equipped with meteorological equipment) with
transducer wears out. This causes peaks in the depth-to-target      the operational base computer. Spread-spectrum radios have
data that are carried over to the snow depth data through cal-      a range of ∼ 20 km within line of sight (Campbell Scientific,
culations. These peaks can be filtered out relatively easily so     2017); however, obstructions such as hills and vegetation at-
they do not significantly affect data quality.                      tenuate significantly the radio signals while the specific type
   All instrumentation used at CAMnet weather stations in-          of antenna used modulates signal strength. Thus, a radio sig-
cludes a recommended temperature operating range where              nal range of ∼ 13 km was chosen during the site selection
data collected outside these parameters are subject to larger       process for stations 1–4 (Table 1). The Blackbear Mountain
errors. However, these operating ranges are quite vast (typi-       radio repeater routes radio communication from the Spanish
cally −40 to +70 ◦ C), thus minimizing potential errors. Note       Mountain and Browntop Mountain stations once daily to the
that data loggers with extended temperature operating ranges        QRRC operational base computer that acts as a gateway to
are employed at all CAMnet sites given the frigid conditions        online data retrieval. Radio communication from the QRRC
often encountered during winter in the Cariboo Mountains            weather station to this computer occurs on an hourly basis,
and surrounding area. Snow and ice, like temperature, have          allowing online data transfers to a computer server on the
the ability to affect the precision of the data and accuracy        UNBC campus in Prince George, BC, for web-based visual-
of the equipment. Rime build-up can cause the anemometer            ization and long-term archiving.
blades to freeze up, resulting in extended periods of data with        A second radio repeater station installed on a bedrock
wind speeds of 0 m s−1 . Snow accumulation on pyranometers          ridge at Castle Creek Glacier within line of sight of the two
and the radiation shields of temperature and relative humid-        nearby weather stations and the Castle Creek Valley allowed
ity probes can also affect the precision of the sampled data.       remote data downloads at the end of a deactivated forestry
Regular site visits mitigate these issues and allow for periodic    road accessed by a 4 × 4 vehicle. A major landslide in 2012,
instrument check-ups to maintain the quality of the data.           however, has since blocked road access to the upper reaches
                                                                    of the Castle Creek Valley, rendering this radio repeater obso-

www.earth-syst-sci-data.net/10/1655/2018/                                          Earth Syst. Sci. Data, 10, 1655–1672, 2018
1666 M. A. Hernández-Henríquez et al.: The Cariboo Alpine Mesonet
lete. Thus, the radio repeater station at Castle Creek Glacier quantities measured at CAMnet weather stations that require
may soon be relocated to a site near Quesnel Lake to extend special attention in reconstructing missing data.
remote communication at sites there.
4.4 Data quality assessment and control
For CAMnet observed data, quality assessment is carried out
4.3 Gaps and infilling
for individual parameters at each station through statistical
Some time series within the database have gaps (Fig. 5) either quality control procedures, analysis of frequency intervals,
for entire stations or individual instruments and for a variety values, manual observations, etc. The CAMnet database con-
of reasons. Stations based in wilderness settings have expe- sists of the original raw data allowing users to manipulate
rienced interruptions due to environmental factors such as them according to their needs and desires. Missing times-
falling trees, intense storms and wintertime icing (see ECCC, tamps are identified and filled with “NA” using codes devel-
2015). Less common, but potentially more destructive to the oped in R (R Core Team, 2014) to maintain a complete yearly
equipment and instrumentation, are the wildlife interactions, data record for each station. All data values assessed as erro-
particularly with large mammals such as black and grizzly neous, extreme or outside a predetermined frequency inter-
bears. Since the NHG’s research requires long-term histor- val are simply flagged (highlighted in yellow) and recorded
ical climate records, it is necessary to find other resources in the metadata documentation. Data from several sampled
that may fill some of the data gaps. A few meteorological variables are also assessed for their quality through visual
stations exist in the vicinity of the Quesnel River basin that inspection and scatter plots such as snow depth and soil tem-
may be able to provide additional data to complete this record perature. An outline of this quality assessment and control
(Fig. 2). Specifically, the BC Ministry of FLNRORD Likely techniques can be found in a document located in the online
Aerodrome weather station (52◦ 360 0500 N, 121◦ 300 4800 W; el- database in each of the station’s respective folders.
evation 1046 m a.s.l.), the BC Ministry of Environment snow A particular concern with data quality is precipitation mea-
pillows at Yanks Peak East (52◦ 490 N, 121◦ 210 W; elevation surements in cold, windy environments such as the Cari-
1683 m a.s.l.) and Barkerville (53◦ 030 N, 121◦ 290 W; eleva- boo Mountains. Apart from the freezing of tipping bucket
tion 1520 m a.s.l.), and the Environment and Climate Change rain gauges, high winds, evaporative losses and trace events
Canada (ECCC) Barkerville weather station (53◦ 040 0900 N, are factors that often induce errors in precipitation measure-
121◦ 300 5300 W; elevation 1283 m a.s.l.) have reliable and rel- ments, especially for snowfall (Cherry et al., 2005). CAM-
atively long-term meteorological measurements for the Cari- net data are not immune to inaccuracies due to precipitation
boo Mountains and in the vicinity of CAMnet weather sta- measurement errors; however, the installation of single Alter
tions. Note that the ECCC Barkerville record begins in 1888, shields at most of the CAMnet weather stations with tipping
making it BC’s third longest observation-based meteorologi- bucket rain gauges reduces the effects of wind undercatch of
cal dataset; however, this remains a weather station operated precipitation. Similarly to other CAMnet measurements, no
by volunteers, rendering data quality and homogeneity sus- modifications are performed on the precipitation data to cor-
pect at times. Nonetheless, these proximal weather and snow rect for possible wind undercatch given the various strate-
pillow stations provide valuable data on hydrometeorologi- gies reported in the literature to address this (e.g., Sevruk,
cal conditions when CAMnet stations experienced data gaps. 1982). A few of the tipping bucket precipitation gauges at
CAMnet stations are notably deficient in measuring cold sea- other CAMnet weather stations (most notably the Ancient
son precipitation and snow water equivalence, variables that Forest and Spanish Mountain sites) are equipped season-
may be acquired from these additional weather stations. ally with CS705 snowfall adapters that are filled with an-
Temporal gaps at one CAMnet station may also be infilled tifreeze to melt and record solid precipitation. However, the
with data from another proximal one in the network. For in- antifreeze remains prone to dilution from precipitation and
stance, daily air temperatures for the QRRC, Spanish Moun- hence often freezes up, particularly during midwinter when
tain and Browntop Mountain weather stations are highly cor- air temperatures may reach ≤ −30 ◦ C. Despite their known
related (r ≥ 0.92; Sharma, 2014). The local surface air tem- limitations, the tipping bucket rain gauges provide reason-
perature lapse rates vary from month to month with the steep- able (liquid) precipitation records for the Cariboo Mountains
est rates (6.6 ◦ C km−1 ) during summer and with more mod- and surrounding areas (see Sect. 4.6). Indeed, the accuracy
est levels during winter (2.7 ◦ C km−1 ) (Sharma, 2014). In- of the CAMnet precipitation measurements remains compa-
deed, potent air temperature inversions often arise in winter rable to that measured at nearby weather stations that meet
such that care must be exercised in reconstructing this vari- WMO standards (Hay, 2018).
able. Vigorous orographic enhancement of precipitation oc-
curs in the Cariboo Mountains inducing strong precipitation
gradients across their steep elevation gradients. Thus, site-
specific conditions such as altitude, exposure, and land and
vegetation cover induce considerable spatial variations in all
Earth Syst. Sci. Data, 10, 1655–1672, 2018 www.earth-syst-sci-data.net/10/1655/2018/M. A. Hernández-Henríquez et al.: The Cariboo Alpine Mesonet 1667
Figure 5. Operating periods for active and inactive CAMnet weather stations (1 January 2006–31 December 2017), deduced by analyzing
the battery voltage required to power each station’s data logger and instruments. Gaps in datasets occur due to a variety of reasons outlined
in Sect. 5.1. Note that data may not be available for all instruments even when a station is operational (e.g., the icing of anemometers during
winter).
4.5 Metadata CAMnet QRRC weather station 5.2 km away with differ-
ences of only 0.45 ◦ C and 22 % (117 mm) during 2014, re-
Metadata for each climate station in the CAMnet network spectively (Figs. S1 and S2). Furthermore, profiles of air
are important to take into consideration when utilizing the temperature and precipitation along a transect crossing the
associated data and are therefore summarized in a detailed Cariboo Mountains between Williams Lake and McBride,
.docx file. This document, a copy of which is available with BC, based on 1950–2010 ANUSPLIN data, reveal the ex-
the data for each station, outlines site location (coordinates, pected cooler, wetter conditions at higher elevations (Fig. 6).
elevation, etc.) and access and provides a brief overview of Climatological data from proximal CAMnet stations to this
the landscape, station equipment specifics (e.g., instrument transect match well the ANUSPLIN data, with differences
heights) and data collection parameters. explained partly by the altitudes of the in situ data relative to
Field notes and site logs are documented using a medi- the smoothed topography of the gridded climate product. The
awiki.org web page allowing the ability to check on historical QRRC, Spanish Mountain, Browntop Mountain and Upper
station visits dating back to the original deployment. These Castle Creek Glacier stations exhibit strong elevational de-
logs remain particularly valuable due to the high turnover pendence in rainfall amounts, albeit with an appreciable pre-
of students and research staff in the NHG (e.g., summer cipitation undercatch relative to ANUSPLIN (Fig. 6a). Air
field assistants) and serve as a complete and detailed re- temperatures at CAMnet stations cool from ∼ 4 ◦ C at the
source. Weather conditions and equipment status, as well as QRRC’s valley bottom site to near −1 ◦ C in the alpine set-
work carried out, comprise important factors noted during tings of Browntop Mountain and the Upper and Lower Castle
each station visit and are therefore documented in these logs. Creek stations, in close agreement with the gridded climate
Moreover, instrument serial numbers, recalibration and ser- data (Fig. 6b).
vicing schedules as well as an ongoing to-do list of field work CAMnet data remain central to the NHG’s goal of investi-
activities are systematically updated on the CAMnet wiki. gating the meteorological drivers influencing the hydrology
of north-central BC. Indeed, CAMnet allows monitoring the
4.6 Example data antecedent and real-time conditions of hydrological extremes
including droughts and floods, as experienced in the region
CAMnet data compare favourably with measurements from
during 2010 and 2011, respectively (Fig. 7). In late winter–
independent meteorological networks that meet WMO stan-
early spring 2010, shallow snow depths (maximum of 45 cm)
dards such as those collected by Environment and Climate
followed by a hot, dry summer during an El Niño event led
Change Canada and the BC Ministry of FLNRORD or with
to scant total annual precipitation (346 mm), 36 % lower than
gridded climate products such as ANUSPLIN (McKenney et
the decadal mean observed at the QRRC weather station.
al., 2011). For example, monthly air temperature and pre-
This yielded some of the lowest annual discharge rates ever
cipitation collected at the BC Ministry of FLNRORD Likely
recorded for the Quesnel River (Déry et al., 2012). These dry
Aerodrome weather station (52◦ 360 5400 N, 121◦ 300 4800 W; el-
conditions were followed by a much deeper snowpack (peak
evation 1046 m a.s.l.) correspond well with data from the
www.earth-syst-sci-data.net/10/1655/2018/ Earth Syst. Sci. Data, 10, 1655–1672, 20181668 M. A. Hernández-Henríquez et al.: The Cariboo Alpine Mesonet
Figure 6. Profiles of average (a) total summer precipitation and (b) annual air temperature along an elevational transect (as shown in Fig. 2)
from Williams Lake to McBride, BC, based on the 1950–2010 ANUSPLIN gridded product along with CAMnet weather station data.
Elevations at high spatial resolution (∼ 90 m) and of the ANUSPLIN smoothed topography (at a spatial resolution of ∼ 10 km) are shown.
Squares depict climatological results for CAMnet stations in proximity to the transect and are numbered as in Table 1. Results for CAMnet
stations depend on data availability as follows: (1) QRRC (2007–2017), (2) Spanish Mountain (2007–2017), (3) Browntop Mountain (2007–
2017), (5) Upper Castle Creek Glacier (2008–2017) and (7) Lower Castle Creek Glacier (2009–2016).
snow depth of 114 cm) in winter–spring of 2011 with precip- 5 Challenges and opportunities
itation during the first half of 2011 (322 mm) nearly equat-
ing the total for 2010. These meteorological conditions led 5.1 Physical and environmental challenges
to saturated soils, increased overland flow and elevated river
runoff throughout 2011. The construction and maintenance of a highly sensitive, long-
term database such as CAMnet generates distinct challenges
on a variety of scales. Power outages due to battery failure
or solar panel issues are a major contributor towards data
loss and interruptions in sampling (see Sect. 4.3), a risk that
is elevated during winter when snow and ice may cover so-
lar panels and immerse instrumentation while cold tempera-
Earth Syst. Sci. Data, 10, 1655–1672, 2018 www.earth-syst-sci-data.net/10/1655/2018/M. A. Hernández-Henríquez et al.: The Cariboo Alpine Mesonet 1669
made in substituting deficient equipment with the same make
and model, this is not always feasible if, for instance, the sup-
plier no longer fabricates a given piece of equipment or spe-
cific model. Meteorological towers may shift under the influ-
ence of winds, frost heaving and heavy snowpacks, altering
the measurement heights and possibly rendering the station
unlevelled. Modifications to data logger programs (e.g., to
switch on or off the heater for the QRRC radiometer) or op-
erating systems may induce additional discontinuities in the
CAMnet data.
Despite efforts to maintain consistency in the CAMnet
datasets by routine station inspection and maintenance, var-
ious factors have resulted in a small fraction of data being
influenced by external factors. Examples of these include the
encroaching vegetation around the station on Spanish Moun-
Figure 7. Cumulative daily precipitation recorded at the QRRC tain, the accidental rotation of the Browntop wind vane (away
CAMnet station (using a heated Ogawa Seiki tipping bucket rain from north), and the replacement of instruments and equip-
gauge) for 2010, 2011 and the overall mean for 2007–2017. ment after various wildlife incidents and severe storms. As
with data gaps, no post-processing of the data has been per-
formed to assess their homogeneity, to remove suspect trends
tures may accelerate the depletion of batteries. CAMnet sta- or erroneous data points. Site photos, field notes and post-trip
tions have also been plagued with several animal incidents updates of metadata remain invaluable resources in resolving
whereby the equipment has been displaced, damaged or ren- issues related to these external influences and are available
dered inoperable. Additionally, wildlife also has the ability for any parties utilizing CAMnet data.
to influence data solely by its presence, with snowpack mea-
surements that rely on an undisturbed section of snow be- 5.3 Opportunistic measurements
neath the sensor being especially vulnerable. Other environ-
mental considerations include lightning strikes that are mit- A primary objective of CAMnet remains to develop long-
igated by robustly grounding each station and the risk of term hydrometeorological records in the poorly sampled
damage from wildfires, which were extensive throughout the Cariboo Mountains to assess climate change impacts on re-
Cariboo region during the summer of 2017 and led to ashfall gional snow, glacier and water resources. This requires long-
in nearby precipitation gauges. Physical challenges are pre- term homogeneous records of hydrometeorological condi-
sented by the complex terrain and remote locations of many tions in the Cariboo Mountains at strategic locations such
stations, which also preclude frequent site visits; some sta- as the QRRC, Browntop and Spanish Mountains, and Castle
tions such as those situated near Castle Creek Glacier are Creek Glacier. A broader role of this long-term monitoring is
only visited once per year. Methods to access station sites the ability to answer unforeseen questions or research needs
include the following: through the use of a 4 × 4 vehicle (of- such as wildfires, pest infestations, mine spills (such as the
ten on deactivated logging roads), a helicopter, a snowmo- Mount Polley mine accident), future resource extraction and
bile and on foot (hiking in summer, snowshoeing in win- land use and cover change in the area in addition to climate
ter). Since these remote locations and environments are fun- change. Indeed, CAMnet may assist in answering questions
damental for local and regional hydrology, the importance that have not yet been asked or even contemplated while pro-
for hydrometeorological data collection and the CAMnet viding baseline data in the event of future disturbances. Push-
network is pronounced; however, difficulty associated with ing CAMnet data online in (near-)real time also allows mon-
securing funds to sustain this extensive network of remote itoring current atmospheric conditions remotely to assist in
weather stations (e.g., costs associated with field work and mitigating extreme events such as atmospheric rivers, floods
travel, equipment repairs, recalibration and purchases, stu- or intense convective storms that can ignite wildfires such as
dent and research staff wages) remains a distinct and ongoing in July 2017 in the BC interior. Finally, the mobile nature of
challenge. the 3 m masts facilitates the transport and rapid deployment
of weather stations to various sites, often to support a gradu-
ate student’s research project or an intensive field campaign
5.2 Data homogeneity challenges at a designated site.
To minimize possible spurious trends or step changes in the
hydrometeorological observations, all CAMnet sites are in-
spected and maintained regularly with faulty instrumentation
repaired or replaced as necessary. While dedicated efforts are
www.earth-syst-sci-data.net/10/1655/2018/ Earth Syst. Sci. Data, 10, 1655–1672, 2018You can also read