Measurements from the RV Ronald H. Brown and related platforms as part of the Atlantic Tradewind Ocean-Atmosphere Mesoscale Interaction Campaign ...
←
→
Page content transcription
If your browser does not render page correctly, please read the page content below
Earth Syst. Sci. Data, 13, 1759–1790, 2021
https://doi.org/10.5194/essd-13-1759-2021
© Author(s) 2021. This work is distributed under
the Creative Commons Attribution 4.0 License.

              Measurements from the RV Ronald H. Brown and
                  related platforms as part of the Atlantic
                 Tradewind Ocean-Atmosphere Mesoscale
                       Interaction Campaign (ATOMIC)
        Patricia K. Quinn1 , Elizabeth J. Thompson2 , Derek J. Coffman1 , Sunil Baidar3,4 , Ludovic Bariteau2 ,
            Timothy S. Bates1,5 , Sebastien Bigorre6 , Alan Brewer4 , Gijs de Boer2,3 , Simon P. de Szoeke7 ,
                 Kyla Drushka8 , Gregory R. Foltz9 , Janet Intrieri2 , Suneil Iyer8 , Chris W. Fairall2 ,
                Cassandra J. Gaston10 , Friedhelm Jansen11 , James E. Johnson1,5 , Ovid O. Krüger12 ,
         Richard D. Marchbanks3,4 , Kenneth P. Moran2,3 , David Noone13 , Sergio Pezoa2 , Robert Pincus2,3 ,
            Albert J. Plueddemann6 , Mira L. Pöhlker12 , Ulrich Pöschl12 , Estefania Quinones Melendez7 ,
        Haley M. Royer10 , Malgorzata Szczodrak10 , Jim Thomson8 , Lucia M. Upchurch1,5 , Chidong Zhang1 ,
                                     Dongxiao Zhang1,5 , and Paquita Zuidema10
                      1 NOAA     Pacific Marine Environmental Laboratory (PMEL), Seattle, WA, USA
                             2 NOAA     Physical Sciences Laboratory (PSL), Boulder, CO, USA
                           3 Cooperative Institute for Research in Environmental Sciences (CIRES),

                                          University of Colorado, Boulder, CO, USA
                              4 NOAA Chemical Sciences Laboratory (CSL), Boulder, CO, USA
                        5 Cooperative Institute for Climate Ocean and Ecosystem Studies (CICOES),

                                         University of Washington, Seattle, WA, USA
                          6 Woods Hole Oceanographic Institution (WHOI), Woods Hole, MA, USA
            7 College of Earth, Ocean, and Atmospheric Sciences, Oregon State University, Corvallis, OR, USA
           8 Department of Air-Sea Interaction and Remote Sensing, University of Washington, Applied Physics

                                             Laboratory (APL), Seattle, WA, USA
                 9 NOAA Atlantic Oceanographic and Meteorological Laboratory (AOML), Miami, FL, USA
              10 Rosenstiel School of Marine and Atmospheric Science, University of Miami, Miami, FL, USA
                                 11 Max Planck Institute for Meteorology, Hamburg, Germany
                                    12 Max Planck Institute for Chemistry, Mainz, Germany
                          13 Department of Physics, University of Auckland, Auckland, New Zealand

                            Correspondence: Patricia K. Quinn (patricia.k.quinn@noaa.gov)

                             Received: 5 November 2020 – Discussion started: 17 November 2020
                        Revised: 28 January 2021 – Accepted: 17 March 2021 – Published: 29 April 2021

      Abstract. The Atlantic Tradewind Ocean-Atmosphere Mesoscale Interaction Campaign (ATOMIC) took place
      from 7 January to 11 July 2020 in the tropical North Atlantic between the eastern edge of Barbados and 51◦ W,
      the longitude of the Northwest Tropical Atlantic Station (NTAS) mooring. Measurements were made to gather
      information on shallow atmospheric convection, the effects of aerosols and clouds on the ocean surface en-
      ergy budget, and mesoscale oceanic processes. Multiple platforms were deployed during ATOMIC including the
      NOAA RV Ronald H. Brown (RHB) (7 January to 13 February) and WP-3D Orion (P-3) aircraft (17 January
      to 10 February), the University of Colorado’s Robust Autonomous Aerial Vehicle-Endurant Nimble (RAAVEN)
      uncrewed aerial system (UAS) (24 January to 15 February), NOAA- and NASA-sponsored Saildrones (12 Jan-
      uary to 11 July), and Surface Velocity Program Salinity (SVPS) surface ocean drifters (23 January to 29 April).
      The RV Ronald H. Brown conducted in situ and remote sensing measurements of oceanic and atmospheric

Published by Copernicus Publications.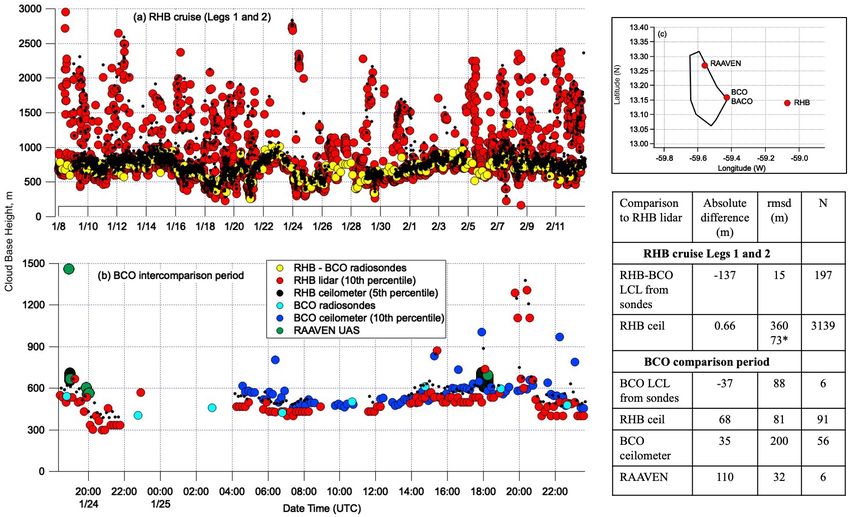
1760             P. K. Quinn et al.: Measurements from the RV Ronald H. Brown and related platforms as part of ATOMIC

       properties with an emphasis on mesoscale oceanic–atmospheric coupling and aerosol–cloud interactions. In ad-
       dition, the ship served as a launching pad for Wave Gliders, Surface Wave Instrument Floats with Tracking
       (SWIFTs), and radiosondes. Details of measurements made from the RV Ronald H. Brown, ship-deployed as-
       sets, and other platforms closely coordinated with the ship during ATOMIC are provided here. These platforms
       include Saildrone 1064 and the RAAVEN UAS as well as the Barbados Cloud Observatory (BCO) and Barbados
       Atmospheric Chemistry Observatory (BACO). Inter-platform comparisons are presented to assess consistency
       in the data sets. Data sets from the RV Ronald H. Brown and deployed assets have been quality controlled
       and are publicly available at NOAA’s National Centers for Environmental Information (NCEI) data archive
       (https://www.ncei.noaa.gov/archive/accession/ATOMIC-2020, last access: 2 April 2021). Point-of-contact in-
       formation and links to individual data sets with digital object identifiers (DOIs) are provided herein.

1   Introduction                                                   study area between January and July 2020. The Robust Au-
                                                                   tonomous Aerial Vehicle-Endurant Nimble (RAAVEN) un-
Shallow, liquid clouds persist at altitudes of hundreds to a       crewed aerial system (UAS) flew near the shore from Mor-
few thousand meters above most of the world’s oceans. Con-         gan Lewis on the eastern side of Barbados between 24 Jan-
vection and mixing in the boundary layer can lead to the           uary and 15 February. Surface Velocity Program Salinity
formation of shallow clouds, which can drive more mixing           (SVPS) type surface ocean drifters were deployed from the
throughout the cloud layer and result in deeper convection.        RV L’Atalante and operated along the South American coast
These clouds reflect incoming solar radiation and lead to a        (23 January to 29 April).
cooling of the surface (Vial et al., 2016). In addition, shallow      A thorough description of the objectives of ATOMIC and
mixing influences sea surface temperature (SST) and salinity       first highlights of the data analyses are presented in Zuidema
by moderating the air–sea exchanges of energy and moisture         (2021a). A description of data collected from the P-3 is de-
(Stevens et al., 2016). Climate models have difficulty accu-       scribed in Pincus et al. (2021), and data collected by the
rately representing low clouds in trade-wind regions because       RAAVEN are documented in de Boer et al. (2021b). Here,
many of the processes involved in their formation occur at         a detailed overview of the data collected from the RV Ronald
sub-grid scales (Bony et al., 2015). Improving model per-          H. Brown and deployed assets is provided. The goal is to
formance requires measurements that will result in a better        document the sampling strategy, instrumentation used, and
understanding of (1) the boundary layer conditions that lead       data availability to advance the widespread use of the data
to cloudiness, (2) the influence of clouds and the atmospheric     by the ATOMIC and broader research communities. A de-
boundary layer on the upper ocean mixed layer, and in turn,        scription of the sampling strategy, including coordination
(3) the influence of ocean mixing processes on surface fluxes      with other platforms, is described in Sect. 2. Also detailed in
and the atmospheric boundary layer.                                Sect. 2 are the measurements made from the RV Ronald H.
   ATOMIC took place in the boreal winter to study shal-           Brown, the NTAS-moored buoy, Wave Gliders and SWIFT
low convection and low, liquid clouds at a time of year when       vessels, Saildrones, RAAVEN UAS, and SVPS drifters. An
other cloud types are mostly absent. ATOMIC is the United          overview of oceanic and atmospheric conditions sampled
States complement to the Elucidating the Role of Clouds Cir-       is provided in Sect. 3. Results from inter-platform compar-
culation Coupling in Climate Campaign (EUREC4 A) (Bony             isons of atmospheric and oceanic parameters are detailed
et al., 2017; Stevens et al., 2021). Together, ATOMIC and          in Sect. 4. Data availability, format, and quality control are
EUREC4 A involved four research vessels, four research air-        described in Sect. 5 along with links to individual data
craft, land-based observations from Barbados, and uncrewed         sets. Available measurement uncertainties are reported in
seagoing and aerial vehicles. The ATOMIC–EUREC4 A                  the data set metadata at https://www.ncei.noaa.gov/archive/
study region stretched from the eastern shores of Barba-           accession/ATOMIC-2020 (last access: 2 April 2021).
dos to the Northwest Tropical Atlantic Station (NTAS) buoy
located ∼ 500 nmi to the northeast and south along the             2   Sampling strategy and measurements
coast of South America to ∼ 5◦ N. EUREC4 A platforms fo-
cused on the western portion of the study area while the           Sampling on board the RV Ronald H. Brown took place from
RV Ronald H. Brown (RHB) and P-3 aircraft worked pri-              7 January to 13 February 2020 and focused on the region be-
marily in the eastern, upwind sector from mid-January to           tween 57 and 51◦ W east of Barbados and between 13 and
mid-February (Fig. 1). ATOMIC was composed of two legs             16◦ N in the so-called trade wind alley (Fig. 1). The overar-
with Leg 1 conducted between 7 and 25 January 2020 and             ching strategy of ATOMIC was to provide a view of the at-
Leg 2 conducted between 28 January and 13 February 2020.           mospheric and oceanic conditions upwind of the EUREC4 A
NOAA- and NASA-sponsored Saildrones covered the entire             study region. Operations of the RV Ronald H. Brown were

Earth Syst. Sci. Data, 13, 1759–1790, 2021                                         https://doi.org/10.5194/essd-13-1759-2021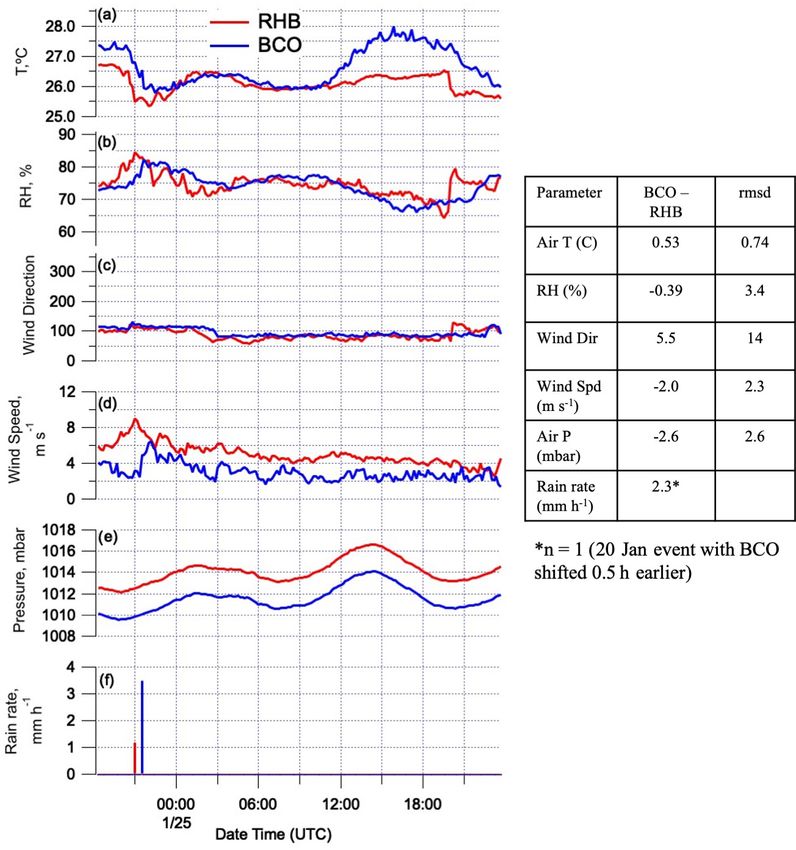
P. K. Quinn et al.: Measurements from the RV Ronald H. Brown and related platforms as part of ATOMIC 1761
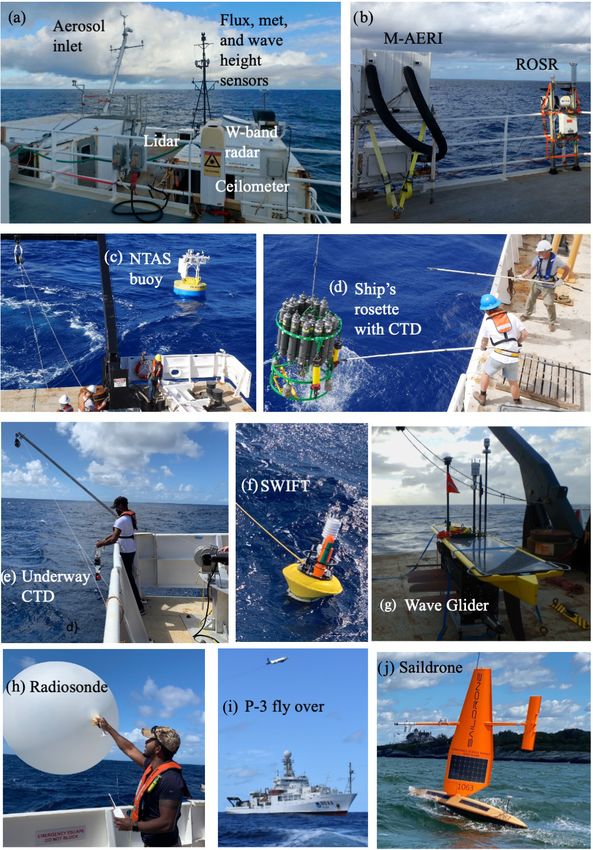
Figure 1. Tracks of the RV Ronald H. Brown, Wave Gliders, and SWIFTS during ATOMIC (colored by seawater skin T calculated by PSL)
for (a) Leg 1 and (b) Leg 2. Tracks for Wave Gliders and SWIFTS are magnified in (c) Leg 1 and (d) Leg 2. The portion of the EUREC4 A
study area overlapping with ATOMIC is indicated by the solid green line in (b). Locations of RV Ronald H. Brown stations, MOVE, and
BCO/BACO are also shown in (a) and (b).
coordinated with the Wave Gliders and Surface Wave Instru- Optimal aerosol and flux measurements were made when
ment Floats with Tracking (SWIFTs) deployed from the ship, the ship was pointed into the wind to avoid contamination by
the P-3 aircraft, Saildrone 1064, and Barbados Cloud Obser- the ship’s stack and air flow distortion. Coordinating with the
vatory (BCO) and Barbados Atmospheric Chemistry Obser- P-3 and Saildrone and deploying the NTAS Mooring, Wave
vatory (BACO). An additional logistical objective included Gliders, and SWIFTs had the advantage of providing redun-
recovering the NTAS-17 mooring and replacing it with the dant and complementary data streams but the disadvantage
NTAS-18 mooring. A third objective was to triangulate and of requiring the ship to transit away from the wind for ma-
download data from a Meridional Overturning Variability neuvers. In addition, ship transits to Bridgetown, Barbados,
Experiment (MOVE) subsurface mooring and related Pres- for a scheduled stay in port (26 to 28 January) and a med-
sure Inverted Echo Sounders (PIES). MOVE is designed to ical emergency (3 to 6 February) were downwind relative
monitor the integrated deep meridional flow in the tropical to prevailing northeast trade winds. Periods of unfavorable
North Atlantic. winds for atmospheric sampling were identified by relative
winds from behind the ship’s beam (∼ −90 through 180◦ to
https://doi.org/10.5194/essd-13-1759-2021 Earth Syst. Sci. Data, 13, 1759–1790, 2021
1762 P. K. Quinn et al.: Measurements from the RV Ronald H. Brown and related platforms as part of ATOMIC
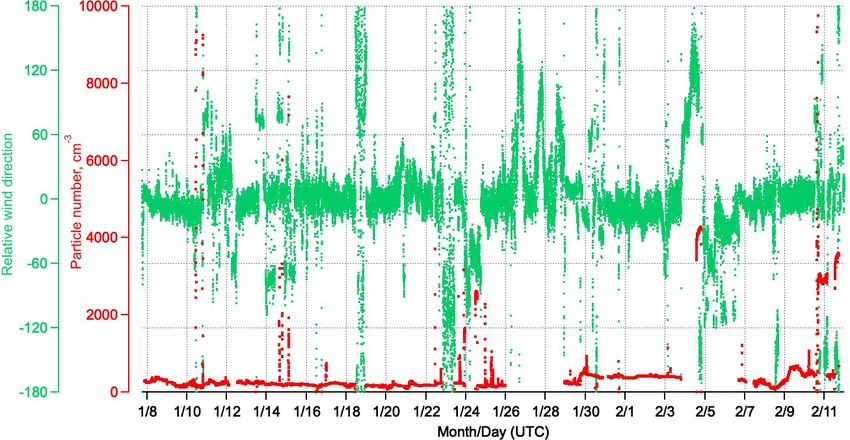
+90◦ relative to the bow at 0◦ ). A time series of relative rosette and conductivity and temperature sensors attached to
winds and corresponding high particle number concentra- the NTAS mooring line. While waiting for the weather to
tions due to emissions from the ship’s stack (∼> 1000 cm−3 ) calm down enough to recover NTAS-17, six SWIFTs were
is shown in Fig. 2. These periods have been removed from deployed. The ship transited 55 nmi to the northwest and de-
the aerosol data. Unfavorable sampling conditions were ex- ployed the first SWIFT (22) on 14 January at 01:13 UTC
perienced 15 % of the time the ship was at sea at the dates at 15◦ 410 2100 N, 51◦ 220 500 W (Fig. 1, Table 2). Following a
and times indicated in Table 1. Seawater measurements were southeast track, the remaining five SWIFTs were deployed
less accurate when the ship’s speed over water was near zero 5 to 12 nmi apart across horizontal gradients in ocean sur-
due to mechanical stirring of the water surface by the ship’s face current and temperature. SWIFT17, the second one de-
propulsion system. ployed, was recovered due to the failure of a 3-D sonic
A general timeline of events for Legs 1 and 2 is pro- anemometer. The ship returned to SWIFT17 to swap out the
vided in Sect. 2.1 and 2.2. Descriptions of the instrumen- anemometer. It was re-deployed near its original position on
tation on board the ship and deployed assets are provided in 14 January at 18:11 UTC. After each SWIFT deployment,
Sect. 2.3 to 2.7 and on the Saildrone, RAAVEN UAS, and underway CTD (uCTD) casts were performed to a depth of
SVPS drifters in Sect. 2.8 to 2.10. 50 m for comparison to SST and salinity measured on board
the SWIFTs and to understand the ocean mixed-layer struc-
2.1 Sampling events during Leg 1
ture at the beginning of each SWIFT Lagrangian drift. In ad-
dition, the ship sat near each SWIFT for at least an hour after
Timelines of events for Legs 1 and 2 are shown in Table 1. deployment for a comparison of measured near-surface at-
Dates and positions of deployment and recovery of assets mospheric and surface seawater parameters.
are listed in Table 2. Times when platforms were within The ship returned to S1 and conducted a second compar-
relatively close proximity providing the potential for inter- ison with NTAS-17 on 15 to 16 January, including a CTD
platform comparisons are given in Table 3. All times reported cast with the ship’s rosette and sensors on the NTAS moor-
throughout the paper are in UTC. ing line. NTAS-17 was recovered on 16 January. The ship
During Leg 1, the NTAS mooring was swapped out, Wave stayed at S1 and was within the P-3’s dropsonde circle dur-
Gliders were deployed for the duration of the experiment, ing its first flight (Research Flight 1 or RF1) on 17 January
and the SWIFTs were deployed and then recovered at the from 15:30 to 16:40. A first comparison between the uCTD
end of the leg. In addition to these logistical operations, mea- and the CTD on the ship’s rosette for temperature and salin-
surements were made throughout the leg to characterize at- ity was conducted on 17 January at 22:36. The ship’s CTD
mospheric and oceanic conditions upwind of the EUREC4 A cast went to a depth of 500 m.
study region. With the NTAS and MOVE work finished, the ship tran-
The ship departed Bridgetown, Barbados, on 7 Jan- sited downwind on 18 January for 14.5 h to Station 2 (S2)
uary 2020 in transit to the NTAS-18 mooring target loca- located at 14◦ 210 4400 N and 53◦ W (Fig. 1a). This location
tion at 14◦ 440 N and 50◦ 560 W. Radiosonde launches every was downwind of the projected paths of the SWIFTs but still
4 h and continuous atmosphere and sea surface sampling be- upwind of the EUREC4 A study region. During the transit,
gan early on 8 January. The latitude and longitude of the four aerosol and flux measurements were compromised by rela-
stations occupied during the cruise are listed in Table 1 and tive winds abaft the beam, but surface ocean and meteoro-
shown in Fig. 1. Station 1 (S1) was located in the NTAS logical measurements as well as radiosonde launches con-
region. Two Wave Gliders were deployed on 9 January en tinued. In addition, uCTD casts to 100 m depth were made
route to S1. Once at S1, early on 10 January a compari- every hour to investigate a large-scale SST gradient between
son between shipboard and NTAS-17 atmosphere and ocean NTAS and S2. The ship briefly slowed to 2 to 4 kn for each
measurements was conducted. The NTAS-18 mooring was cast.
deployed later on 10 January. After deployment, the ship The ship reached S2 on 19 January at 01:30 UTC and
transited 55 nmi to the northwest of S1 to the MOVE region turned into the wind for optimal aerosol and flux measure-
near 15◦ 270 N and 51◦ 320 W (Fig. 1). Unsuccessful attempts ments. Underway CTDs were conducted to a depth of 100 m
were made over a 24 h period to triangulate the position of every 6 h. The second overflight of the P-3 (RF2) occurred
the MOVE1-13 mooring and PIES198 and 238. The ship left on 19 January at 14:57 UTC with the RV Ronald H. Brown
the MOVE region on 12 January at 05:30 to transit back to within the aircraft’s dropsonde circle. A second comparison
S1. The MOVE work did not compromise continuous atmo- between the uCTD and the CTD on the ship’s rosette was
spheric and surface ocean sampling and is not discussed fur- conducted on 21 January at 16:15 with the ship’s CTD reach-
ther. ing a depth of 150 m.
A comparison of atmospheric and oceanic parameters On 22 January at 07:30 UTC, the ship left S2 to recover the
measured on board the ship and NTAS-18 was conducted SWIFTs before the end of Leg 1. The SWIFTs had drifted
12 to 13 January. The comparison included a CTD (conduc- between 53 and 103 nmi to the southwest with those de-
tivity, temperature, and depth) sensor mounted on the ship’s ployed at the more southern locations drifting the furthest
Earth Syst. Sci. Data, 13, 1759–1790, 2021 https://doi.org/10.5194/essd-13-1759-2021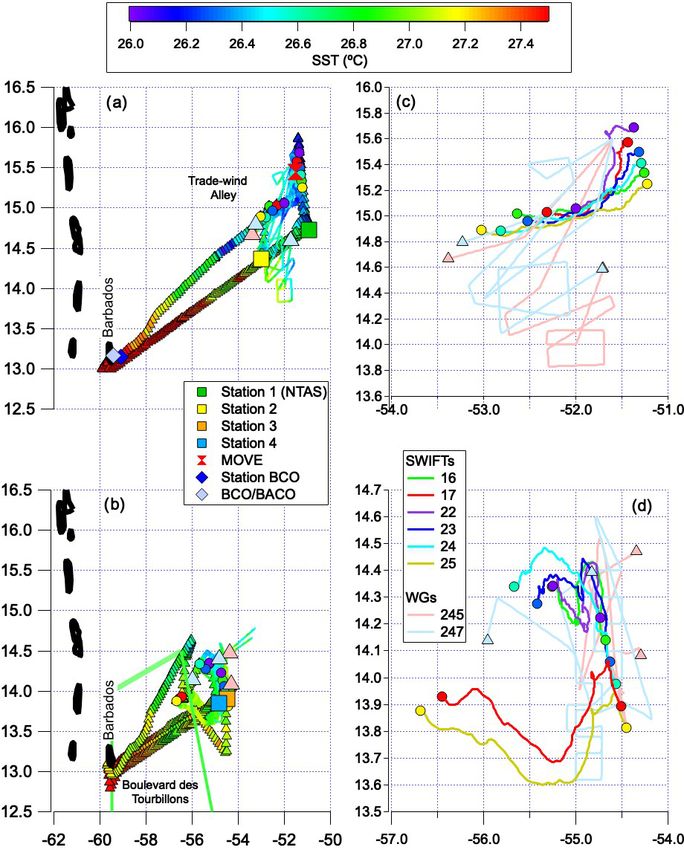
P. K. Quinn et al.: Measurements from the RV Ronald H. Brown and related platforms as part of ATOMIC                                                                1763

Table 1. Timeline of sampling events on board the RV Ronald H. Brown (RHB) including coordination with other platforms, NTAS opera-
tions, downwind transits, and periods at each station. The different symbols shown under RHB correspond to the sampling status of the ship
and coordination with other assets with spacing of vertical bars indicating time of day (UTC).

a Y, sampling day. b S1, Station 1; 14◦ 440 N, 50◦ 560 W (NTAS area). c C-N17, comparison between RHB and NTAS-17. d D, downwind transit. e N18, NTAS-18 deployed.
f MOVE, MOVE operations. g C-N18, comparison between RHB and NTAS-18. h C-S, comparison between RHB and SWIFTs. i N17, NTAS-17 recovered. j C-P3(RF#),
comparison between RHB and P3 Research Flight #. k S2, Station 2; 14◦ 210 4400 N, 53◦ W. l C-BCO, comparison between RHB and BCO with RHB at Station BCO (13◦ 80 55.700 ,
59◦ 40 59.200 W). m C-RUAS, comparison between RHB and RAAVEN UAS. n P, RHB in port. o S3, Station 3; 13◦ 540 N, 54◦ 300 W. p S4, Station 4; 13◦ 510 N, 54◦ 510 3600 W.
q C-SD, comparison between RHB and Saildrone 1064. r C-WG, comparison between RHB and Wave Gliders.

(Fig. 1a, Table 2). The ship transited 32 nmi to the north to                            flew over the ship at an altitude of 150 m. This flyby was the
reach the southernmost SWIFT and then followed a course to                               closest the P-3 was to the ship during the ATOMIC cam-
the northeast recovering the remaining SWIFTs, which were                                paign while all instrumentation was operational. At 22:00
7 to 24 nmi apart. Once all SWIFTs were on board (22 Jan-                                the ship started the 250 nmi transit back to Bridgetown with
uary, 19:14), the ship transited 180 nmi to the southwest to                             a planned stop upwind of BCO/BACO for a measurement
14◦ 220 5900 N and 55◦ W to be in the center of the P-3’s drop-                          comparison. Initially, relative winds were from the port side
sonde circle the next day. Aerosol and flux measurements                                 of the ship at −100◦ relative to the bow, but 6 h into the
were compromised during the transit due to the relative wind                             transit they shifted to a relative direction of −50◦ due to a
being abaft the beam.                                                                    change in true wind direction and the ship’s course, making
   The ship reached the designated position on 23 January                                for better conditions for aerosol and flux measurements. Ra-
at 10:30, turned into the wind for optimal aerosol and flux                              diosonde launches were halted on 24 January at 02:45 near
measurements, and was within the P-3’s dropsonde circle on                               56◦ W with the knowledge that sondes launched from the
23 January at 14:06 (RF3). Later in the flight (15:42), the P-3                          RV Meteor and BCO could be used to fill in the gap. The

https://doi.org/10.5194/essd-13-1759-2021                                                                    Earth Syst. Sci. Data, 13, 1759–1790, 2021
1764              P. K. Quinn et al.: Measurements from the RV Ronald H. Brown and related platforms as part of ATOMIC

Figure 2. Time series of relative wind direction (apparent wind relative to the bow of the ship, negative values are port and positive values
are starboard) and particle number concentration (Dgn > 13 nm) measured on the RV Ronald H. Brown during ATOMIC.

Table 2. Dates (UTC) and positions of deployment and recovery of NTAS moorings, two Wave Gliders, and six SWIFTs. Assets are listed
in order of start and stop times of the data stream. Distance traveled is given for the SWIFTs and Wave Gliders.

                                           Deployment                                              Recovery
   Asset              Date                   Position                         Date                  Position                          Distance
                                                                                                                                         (nmi)
   Leg 1
   Wave Glider 245    9 Jan 2020, 20:55      14◦ 350 2500 N, 51◦ 410 5600 W
   Wave Glider 247    9 Jan 2020, 20:55      14◦ 350 1300 N, 51◦ 420 2100 W
   NTAS-18            10 Jan 2020, 17:45     14◦ 440 N, 50◦ 560 W
   SWIFT 22           14 Jan 2020, 01:13     15◦ 410 2100 N, 51◦ 220 500 W    22 Jan 2020, 19:14    15◦ 30 2900 N, 51◦ 590 5000 W          52
   SWIFT 23           14 Jan 2020, 05:11     15◦ 290 5900 N, 51◦ 180 5400 W   22 Jan 2020, 15:11    14◦ 570 4700 N, 52◦ 310 2100 W         62
   SWIFT 24           14 Jan 2020, 07:11     15◦ 240 4200 N, 51◦ 170 1900 W   22 Jan 2020, 12:13    14◦ 530 1200 N, 52◦ 490 500 W          94
   SWIFT 16           14 Jan 2020, 09:11     15◦ 200 300 N, 51◦ 150 3700 W    22 Jan 2020, 14:13    15◦ 10 900 N, 52◦ 380 800 W            82
   SWIFT 25           14 Jan 2020, 10:12     15◦ 150 700 N, 51◦ 130 4600 W    22 Jan 2020, 11:13    14◦ 530 2600 N, 53◦ 10 3400 W          60
   SWIFT 17           14 Jan 2020, 18:11     15◦ 340 3100 N, 51◦ 260 1600 W   22 Jan 2020, 17:14    15◦ 10 5500 N, 52◦ 180 5600 W          60
   NTAS-17                                                                    16 Jan 2020, 10:41    14◦ 490 2800 N, 51◦ 000 W
   Leg 2
   Wave Glider 245                                                            7 Feb 2020, 19:55     14◦ 40 5500 N, 54◦ 170 1200 W         153
   SWIFT 22           30 Jan 2020, 17:12     14◦ 130 2500 N, 54◦ 430 5300 W   10 Feb 2020, 17:12    14◦ 200 3500 N, 55◦ 150 500 W          31
   SWIFT 16           30 Jan 2020, 18:13     14◦ 80 2300 N, 54◦ 400 5100 W    10 Feb 2020, 17:13    14◦ 200 2800 N, 55◦ 150 1900 W         36
   SWIFT 23           30 Jan 2020, 19:12     14◦ 30 3100 N, 54◦ 370 3000 W    10 Feb 2020, 20:15    14◦ 160 3000 N, 55◦ 250 1400 W         48
   SWIFT 24           30 Jan 2020, 20:13     13◦ 580 3900 N, 54◦ 330 5200 W   10 Feb 2020, 23:12    14◦ 200 1900 N, 55◦ 390 5600 W         68
   Wave Glider 247                                                            11 Feb 2020, 10:54    14◦ 80 1100 N, 55◦ 570 900 W          248
   SWIFT 17           30 Jan 2020, 21:10     13◦ 530 4000 N, 54◦ 300 3100 W   11 Feb 2020, 15:11    13◦ 550 4700 N, 56◦ 270 600 W         127
   SWIFT 25           30 Jan 2020, 22:13     13◦ 480 5000 N, 54◦ 270 600 W    11 Feb 2020, 17:14    13◦ 520 3700 N, 56◦ 410 0.600 W       130

Earth Syst. Sci. Data, 13, 1759–1790, 2021                                                  https://doi.org/10.5194/essd-13-1759-2021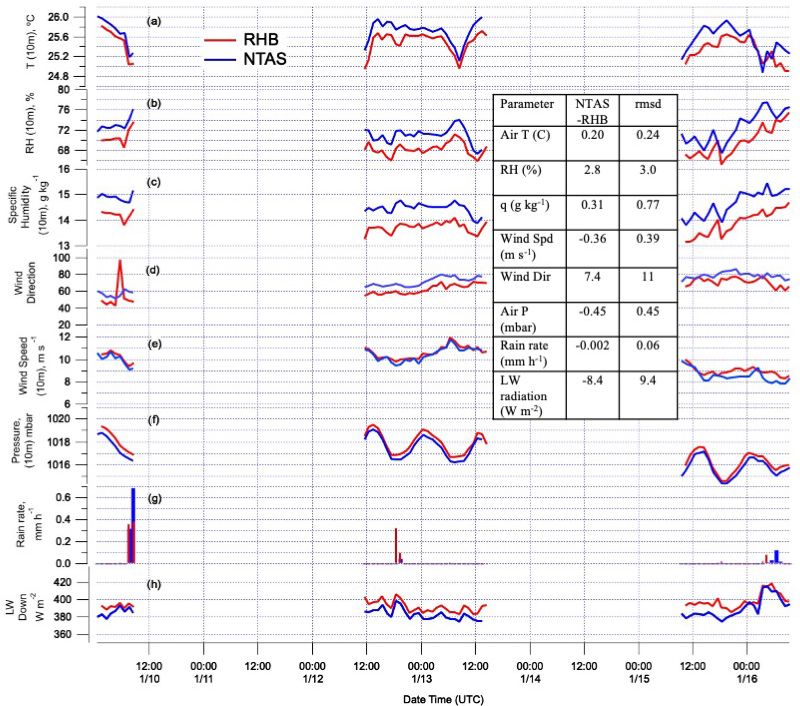
P. K. Quinn et al.: Measurements from the RV Ronald H. Brown and related platforms as part of ATOMIC                                     1765

Table 3. Times when platforms were within relatively close proximity providing the potential for inter-platform comparisons. Also given are
distances between platforms during the comparisons. Results from inter-platform comparisons reported here are indicated in bold. Distances
between RHB and NTAS refer to distance to the mooring anchor. Distance to buoys was between 0.25 and 3 nmi.

    Platforms          Start UTC                     Stop UTC                   Distance (nmi)            Comments
    RHB, NTAS-17       10 Jan 2020, 00:58            10 Jan 2020, 08:57         2.5 (mooring anchor)      Station 1
    RHB, NTAS-18       12 Jan 2020, 11:30            13 Jan 2020, 14:00         2.9 (mooring anchor)      12 Jan 2020, 14:06, 19:04; 13
                                                                                                          Jan 2020, 00:00
                                                                                                          CTD casts to 250 m
                                                                                                          Station 1
    RHB, NTAS-17       15 Jan 2020, 10:00            16 Jan 2020, 09:05         2.9 (mooring anchor)      15 Jan 2020, 20:16
                                                                                                          CTD cast to 5000 m
                                                                                                          Station 1
    RHB, P-3           17 Jan 2020, 14:20                                       Within dropsonde circle   P-3 RF1, 7.3–7.7 km altitude
                                                                                                          Station 1
    RHB, P-3           19 Jan 2020, 14:57                                       Within dropsonde circle   P-3 RF2 7.6 km altitude
                                                                                                          Station 2
    RHB, P-3           23 Jan 2020, 14:06, 19:46                                Within dropsonde circle   P-3 RF3, 3.2 km altitude
                                                                                                          14◦ 220 5900 N and 55◦ W
                                                                                                          Overfly of ship at 150 m at
                                                                                                          15:42
    RHB, P-3           31 Jan 2020, 16:25                                       Within dropsonde circle   P-3 RF5, 7.4 km altitude
                                                                                                          Station 3
    RHB, P-3           3 Feb 2020, 14:13                                        Within dropsonde circle   P-3 RF6, 7.7 km altitude
                                                                                                          Station 3
    RHB, P-3           9 Feb 2020, 05:57                                        Within dropsonde circle   P-3 RF9, 7.5 km altitude
                                                                                                          Station 4
    RHB, P-3           10 Feb 2020, 05:46                                       Within dropsonde circle   P-3 RF10, 7.5 km altitude
                                                                                                          Station 4
    RHB, P-3           11 Feb 2020, 10:26                                                                 P-3 RF11, 7.5 km altitude
                                                                                                          Station 4
    RHB, SD 1064       8 Feb 2020,          09:30    10 Feb 2020, 18:50         0.7 to 3.6                8 Feb 2020, 09:30–18:10 SD
                                                                                                          was 2.8–3.6 nmi upwind, 8
                                                                                                          Feb, 19:00, 10 Feb, 18:50 SD
                                                                                                          was 0.7–0.8 nmi from ship
                                                                                                          Station 4
    RHB, BCO           24 Jan 2020, 18:20            25 Jan 2020, 23:40         20                        RHB located directly upwind
                                                                                                          of BCO

ship arrived at the comparison point 20 nmi east of BCO                   2.2        Sampling events during Leg 2
(13◦ 80 55.700 N, 59◦ 40 59.200 W) at 18:20 on 24 January and
stayed until 25 January at 23:40 (Fig. 1a). Underway CTDs                 During Leg 2, the SWIFTs were deployed at the beginning of
were conducted approximately every 2 h until 25 January at                the leg and then recovered along with the Wave Gliders at the
21:58.                                                                    end of the leg. Similar to Leg 1, measurements were made
   The ship ended Leg 1 with a transit around the south-                  throughout the leg to characterize atmospheric and oceanic
ern end of Barbados and into Bridgetown with an arrival on                conditions upwind of the EUREC4 A study region.
26 January at 12:15 for an open house and outreach activities                The RV Ronald H. Brown left Bridgetown at 22:15 on
to be conducted on 27 January.                                            28 January and headed for Station 3 (S3) located 290 nmi to
                                                                          the northeast of BCO/BACO at 13◦ 540 000 N and 54◦ 300 000 W
                                                                          (Fig. 1b). S3 was roughly halfway between BCO/BACO and

https://doi.org/10.5194/essd-13-1759-2021                                                    Earth Syst. Sci. Data, 13, 1759–1790, 2021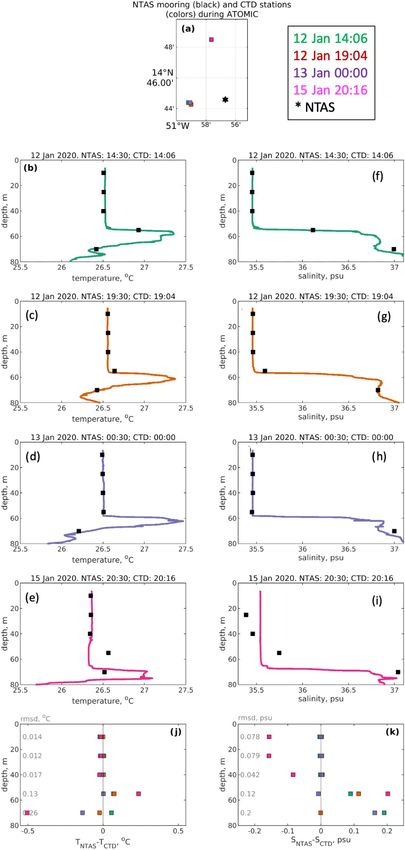
1766             P. K. Quinn et al.: Measurements from the RV Ronald H. Brown and related platforms as part of ATOMIC

NTAS. Radiosonde launches began on 29 January at 06:45               Still at S4, the ship was within the P-3’s nighttime drop-
and continued every 4 h. The ship veered off its NE track         sonde circle on 9 February (RF9) at 05:57. The NOAA
on 29 January at 20:18 and turned to the southeast to map         PMEL-operated Saildrone 1064 completed a first leg be-
the spatial orientation of SST fronts with gradients around       tween BCO and NTAS and then sailed near the ship for a
0.75 ◦ C for determining where to deploy SWIFTs. When             comparison of fluxes and measured meteorological and sea-
done with mapping, the ship went north on 30 January at           water parameters. The Saildrone was 2.8 to 3.6 nmi upwind
04:15 arriving in the vicinity of S3 and Wave Glider 245 at       of the ship between 8 February from 09:30 to 18:10 and
08:00. Wave Glider 245 was recovered to replace malfunc-          within 0.7 to 0.8 nmi of the ship between 8 February, 19:00
tioning sensors.                                                  and 10 February, 18:50. Two final comparisons between the
    The ship zigzagged to the northwest and then northeast un-    uCTD and the CTD on the ship’s rosette were conducted on 8
til reaching 14◦ 130 2500 N and 54◦ 430 5300 W on 30 January at   and 9 February with the ship’s CTD going to depths of 1000
17:12 where the first SWIFT deployment of Leg 2 took place        and 400 m, respectively. The ship remained at S4 for the P-
(Fig. 1d, Table 2). The remaining SWIFTs were deployed            3’s second night flight (RF10) and was within the dropsonde
on a southeast track approximately 6 nmi apart. After each        circle on 10 February from 05:46 to 06:42. The ship’s final
SWIFT deployment, uCTD casts were performed to a depth            coordination with the P-3 occurred during a combination re-
of 100 m to provide a subsurface context for SWIFT mea-           search and sightseeing flight with press (RF11) on 11 Febru-
surements. During each cast, the ship moved into the wind         ary. The ship was not within the dropsonde circle but was
at 0.5 kn. Wave Glider 245 was re-deployed on 30 January          flown over at sunrise at 10:26.
at 18:08 after the last SWIFT was put in the water. The ship         The ship remained at S4 until 10 February at 12:00, at
then transited back to S3, arriving 5 h later at 23:09. Dur-      which point aerosol measurements were ended and the ship
ing this 6 h period, as the ship was maneuvering to deploy        began the transit to recover SWIFTs and Wave Glider 247.
SWIFTs, relative winds were from the port side between −50        Recovery operations were conducted between 10 February,
and −100◦ , compromising aerosol and flux measurements.           15:00 and 11 February, 18:15. The four SWIFTs (16, 22,
    The ship remained at S3 until 3 February at 15:00 to char-    23, and 24) that were initially deployed to the north be-
acterize diurnal variations in oceanic and atmospheric condi-     tween 14◦ 130 2500 and 13◦ 580 3900 N drifted to the northwest,
tions and to be in position for the P-3’s RF5 and RF6. Con-       traveling a total distance ranging from 31 to 68 nmi (Ta-
tinuous atmospheric and surface ocean measurements were           ble 2, Fig. 1b). The two SWIFTs (17 and 25) deployed to the
made, radiosondes were launched every 4 h, and uCTD casts         south between 13◦ 530 4000 N and 13◦ 480 5000 N initially drifted
were conducted every 2 h. Four comparisons between the            to the southwest, each traveling 130 nmi. The ship transited
uCTD and the CTD on the ship’s rosette were conducted be-         to the northeast to pick up the northern cluster of SWIFTs
tween 1 and 3 February with the ship’s CTD reaching a depth       first, staying near each asset for up to 1.5 h for a comparison
of 400 m. The ship was at the center of the P-3’s dropsonde       of measured atmospheric and oceanic parameters. The ship
circle on 31 January at 16:25 (RF5) and 3 February at 14:13       then did several back-and-forth tracks between the position
(RF6).                                                            of Wave Glider 247 and SWIFT 17 mapping a SST front be-
    On 3 February at 19:30 the ship headed back to                fore recovering the Wave Glider and the last two SWIFTs.
Bridgetown for a medical emergency. Aerosol and flux mea-            After the SWIFTs and Wave Glider were recovered, the
surements were compromised due to relative winds abaft the        ship started a northeast transit on 11 February around 19:30
beam. Radiosonde launches continued every 4 h. The last           across a SST front in the upwind direction to study air–
launch before reaching port was on 4 February at 10:45. The       sea interaction and atmospheric and oceanic mixed-layer
ship arrived in Bridgetown on 4 February at 19:00.                variability. Underway CTDs were made continuously. On
    The ship departed Bridgetown on 6 February at 16:00 and       12 February at 06:00, the ship began the southwest transit
headed northeast to Station 4 (S4) located at 13◦ 510 N and       back to Bridgetown for the final time. Atmospheric sampling
54◦ 510 3600 W, 21.2 nmi southwest of S3. Atmospheric mea-        was compromised during the downwind transit. The last ra-
surements resumed along with radiosonde launches every            diosonde launch occurred on 12 February at 10:45. The ship
4 h. The ship arrived at S4 on 8 February at 01:00 but left 6 h   arrived in port on 13 February at 10:00.
later to recover Wave Glider 245 because it was experiencing
navigation problems that could have endangered the vehicle.       2.3   NTAS operations and measurements
The Wave Glider was recovered 36 nmi to the northeast of S4
(14◦ 40 5500 N, 54◦ 170 1200 W) on 8 February at 12:45. Aerosol   NTAS was established to provide accurate air–sea flux esti-
and flux measurements were compromised during the down-           mates and upper ocean measurements in a region with strong
wind transit back to S4 between 12:45 and 16:25. Once back        SST anomalies and the likelihood of significant local air–
on station, optimal aerosol and flux measurements resumed         sea interaction on interannual to decadal timescales (Weller,
along with uCTD casts every 2 h. A CTD cast to a depth of         2018; Bigorre and Galbraith, 2018). The station is main-
1000 m with the ship’s rosette was conducted on 8 February        tained at a site near 15◦ N and 51◦ W through successive
at 17:00 for comparison to the uCTD.                              mooring turnarounds. During Leg 1, the Upper Ocean Pro-

Earth Syst. Sci. Data, 13, 1759–1790, 2021                                        https://doi.org/10.5194/essd-13-1759-2021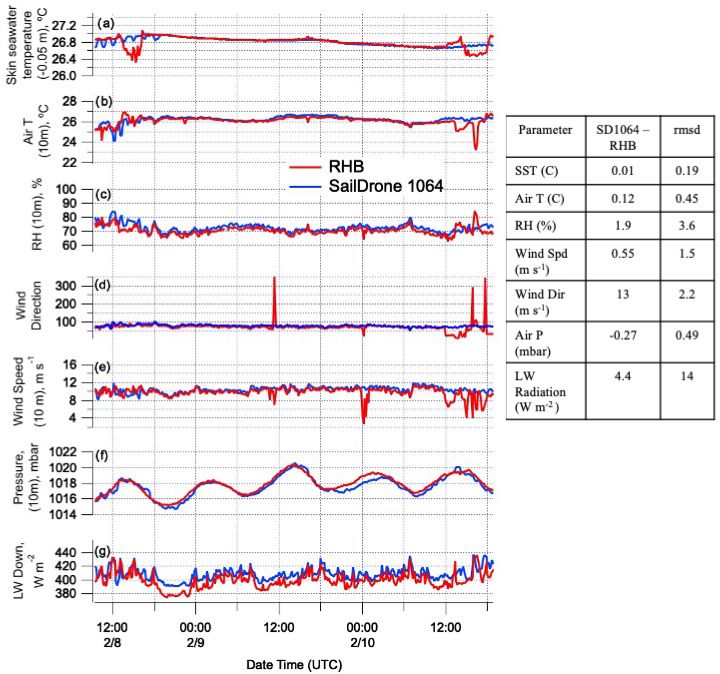
P. K. Quinn et al.: Measurements from the RV Ronald H. Brown and related platforms as part of ATOMIC                         1767

cesses Group of the Woods Hole Oceanographic Institution            ter mounted on the forward O3 deck (three levels above the
(WHOI) and crew of the RV Ronald H. Brown deployed                  main deck) provided cloud base height and temporal cloud
the NTAS-18 mooring and recovered the NTAS-17 mooring               fraction. For comparison with other platforms (NTAS and
at nearby sites. Both moorings used Surlyn foam buoys as            Saildrone 1064), wind speed, air temperature, air pressure,
the surface element. These buoys are outfitted with two Air–        and specific humidity were adjusted to a height of 10 m us-
Sea Interaction Meteorology (ASIMET) systems (Colbo and             ing the COARE 3.6 bulk algorithm. Final data products of
Weller, 2009). The ASIMET system measures, records, and             meteorological and navigation data are 1 and 10 min aver-
transmits via Iridium satellites the surface meteorological         ages of high-resolution raw data (see Table 5 for raw sam-
variables necessary to compute air–sea fluxes of heat, mois-        pling intervals). The data are time-stamped at the beginning
ture, and momentum. The upper 160 m of the mooring line is          of the 1 and 10 min period. Fluxes were calculated at 10 min
outfitted with oceanographic sensors for the measurement of         resolution, then interpolated to 1 min.
temperature, salinity, and velocity. Information on the instru-        University of Miami (UM) provided high-resolution mea-
ments providing real-time data, measured atmospheric and            surements of cloud and rain to better understand the relation-
oceanic parameters, and height/depth of the measurements            ship between cloud properties and cloud spatial organization
on the NTAS mooring is provided in Table 4.                         as a function of cloud mesoscale organization, in particular
   ASIMET data are sampled and recorded internally ev-              rain and the associated atmospheric cold pools (Stevens et
ery minute. The oceanographic measurements are recorded             al., 2021; Löffler-Mang and Joss, 2000). Two collocated Par-
either every 5 or 10 min for temperature and salinity (de-          sivel disdrometers mounted on the forward O3 deck provided
pending on the instrument type) and 20 min or 1 h for cur-          precipitation intensity, drop number, and equivalent radar re-
rents. The NTAS-18 mooring was deployed on 10 January               flectivity. A sky camera provided a 50◦ field of view oriented
at 14◦ 440 N, 50◦ 560 W with anchor drop at 17:45 in 5055 m         horizontally off the starboard side of the ship every 4 s. A
of water. The NTAS-17 mooring was recovered on 16 Jan-              microwave radiometer was deployed to provide cloud liquid
uary with anchor release at 10:41. Both buoys have a watch          water path estimates, but its data acquisition was unsuccess-
circle of about 2 nmi from their respective anchors and were        ful and no data are available. A Marine Atmospheric Emitted
separated by about 6 nmi during the 10 to 16 January period,        Radiance Interferometer (M-AERI) was mounted on the port
allowing for comparisons of measured ocean and atmosphere           side O2 deck rail (two levels above the main deck) (Min-
parameters. Atmospheric data from NTAS-17 and NTAS-18               nett et al., 2001). It measured the spectra of infrared emis-
were combined for comparison to measurements on board               sion from the sea surface and atmosphere for the derivation
the RV Ronald H. Brown (Sect. 4.2.1). Wind speed, air tem-          of skin sea surface temperature and lower troposphere pro-
perature, and specific humidity were adjusted to a height of        files of temperature and humidity (Szczodrak et al., 2007). A
10 m and neutral atmospheric stability using the COARE 3.6          W-band Doppler vertically pointing cloud radar was housed
bulk model for the comparison (Fairall et al., 2003; Edson et       in a container on the O2 deck for the measurement of vertical
al., 2013). NTAS data in the ATOMIC archive only include            profiles of non-precipitating and lightly precipitating clouds
data collected during the ATOMIC campaign.                          (Moran et al., 2012). The radar was not functional during
   On 8 April 2020 at 08:00 UTC, the NTAS-18 buoy                   Leg 1 and operated with a 10 dB attenuator on Leg 2 that pre-
went adrift. It meandered slowly toward the Caribbean for           vented detection of non-precipitating clouds. Although the
7 months until being recovered on 20 October 2020. NTAS-            loss of this information limited the ship-based observations
19 was deployed on 22 October 2020.                                 of non-precipitating cloud, data from the shipboard ceilome-
                                                                    ter and Doppler radar and the cloud radar on the P-3 will be
2.4   Shipboard atmospheric measurements
                                                                    used to fill in gaps.
                                                                       NOAA’s Chemical Sciences Laboratory (CSL) operated
Instrumentation on board the RV Ronald H. Brown for the             a microjoule class, pulsed Doppler lidar (microDop) oper-
measurement of atmospheric and aerosol parameters is listed         ating at a wavelength of 1.5 µm to assess atmospheric tur-
in Table 5. Locations of instruments on deck are shown              bulence, aerosol backscatter intensity, and horizontal winds
in Fig. 3. NOAA’s Physical Science Laboratory (PSL) col-            (Schroeder et al., 2020). The lidar was mounted on the for-
lected data to enable a deeper understanding and quantifi-          ward O2 deck. The system was motion stabilized while star-
cation of cloud processes, the environments in which they           ing vertically to within 0.25◦ of zenith. Ship motion projected
either grow or dissipate, how the ocean and atmosphere in-          onto the line-of-site velocity measurement was estimated and
teract, and the spatial variability of these processes. Instru-     removed using a six-axis inertial navigation unit (INU). The
mentation mounted on the bow mast and forward O2 deck               INU allowed the lidar to measure the mean and turbulent mo-
(two levels above the main deck) measured sea-surface me-           tions of aerosol in clear air and cloud scatterers with a spa-
teorological properties, rain rate, radiative fluxes, and air–sea   tial and temporal resolution of 33.6 m and 2 Hz respectively.
turbulent fluxes using bulk, eddy covariance, and inertial dis-     The first valid gate was 75 m above the ocean surface. The
sipation methods (Fairall et al., 1997, 1996, 2003; Edson et        maximum height of valid data depends on the availability
al., 2013). Vertical profiles of backscatter from a ceilome-        of aerosol scattering targets. Typically, the instrument pro-

https://doi.org/10.5194/essd-13-1759-2021                                          Earth Syst. Sci. Data, 13, 1759–1790, 2021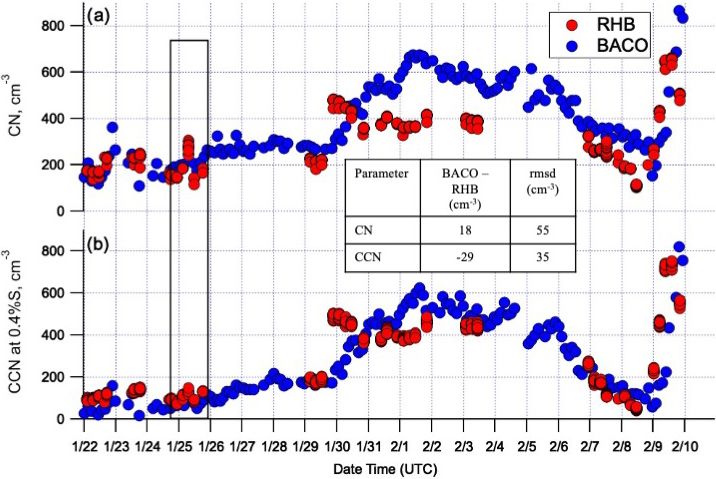
1768             P. K. Quinn et al.: Measurements from the RV Ronald H. Brown and related platforms as part of ATOMIC

Table 4. Instrumentation providing real-time data on board the NTAS mooring.

                 Instrument              Measured/derived quantities, raw sampling interval
                                         Atmospheric parameters                                           Height (m)
                 ASIMET system           Bulk air–sea fluxes, relative humidity, temperature, pressure,           3
                                         wind speed and direction, precipitation rate, longwave radia-
                                         tion, shortwave radiation, 1 min
                                         Oceanic parameters                                               Depth (m)
                 ASIMET system           Sea surface temperature and salinity, 1 min                             0.8
                 Seabird (SBE-37 IM)     Temperature and salinity, 5 min                                          10
                 NORTEK Aquadopp         Currents, 20 min                                                        13
                 Seabird (SBE-37 IM)     Temperature and salinity, 5 min                                          25
                 Seabird (SBE-37 IM)     Temperature and salinity, 5 min                                          40
                 Seabird (SBE-37 IM)     Temperature and salinity, 5 min                                          55
                 Seabird (SBE-37 IM)     Temperature and salinity, 5 min                                          70

vided data through the top of the marine atmospheric bound-           ary layer. Measurements included aerosol chemical compo-
ary layer, in the presence of elevated dust layers to 3 km, and       sition, total number concentration, number size distribution,
clouds to a height of 7 km. The lidar pointed vertically 95 %         light scattering and its dependence on relative humidity, light
of the time to sample updrafts and downdrafts in the subcloud         absorption, and cloud nucleating ability. Aerosol instrumen-
mixed layer and in the interstitial trade cumulus boundary            tation was housed in two containers on the O2 deck. All in-
layer and spent 2 min of every hour performing a 65◦ eleva-           struments drew sample air from an inlet 18 m a.s.l. mounted
tion, full azimuthal scan to measure horizontal wind profiles.        on top of one of the O2 deck vans (Bates et al., 2002) (Fig. 3).
Real-time quicklooks of backscatter intensity profiles show-          Aerosol optical depth (AOD) was measured using Microtops
ing strongly scattering cloud base and updraft structures were        hand-held sun photometers. The raw Microtops data were
available for awareness of the clouds and turbulent mixed             processed by the NASA Maritime Aerosol Network in con-
layer throughout the cruise. Cloud base height (CBH) was              junction with the Aerosol Robotic Network (Smirnov et al.,
retrieved by applying Haar wavelet covariance transforms to           2009). In addition, 222 Rn was measured for its use as a tracer
the backscatter intensity profiles.                                   of continentally influenced air masses (Whittlestone and Za-
   Oregon State University and the National Center for At-            horowski, 1998), and O3 was measured for its use as an indi-
mospheric Research (NCAR) operated a Picarro water vapor              cator of entrainment from the upper troposphere.
isotope analyzer on Leg 2 of the cruise to investigate pro-              Radiosondes were launched throughout the ATOMIC
cesses that shape the atmosphere’s humidity structure and its         campaign to provide information about the temporal evolu-
variations. The spectroscopic analyzer measured water va-             tion and vertical structure of the boundary layer, upper atmo-
por concentration and its isotopic composition, the isotope           sphere, and clouds. A total of 97 radiosondes (Vaisala RS41-
ratios of oxygen (18 O/16 O) and hydrogen (D/H). All three            SGP) were launched from the fantail during Leg 1, and 66
quantities were measured continuously at 5 Hz frequency via           were launched during Leg 2. There were six launches per
the aerosol inlet on the O2 deck at 18 m above sea level              day at 02:45, 06:45, 10:45, 14:45, 18:45, and 22:45 UTC.
(m a.s.l.). Complementary gas-phase water isotopic measure-           Vertical profiles of pressure, temperature, relative humid-
ments were made from the P-3, at BCO, from the French                 ity, and winds were measured from the surface to approxi-
ATR aircraft, and aboard German and French research ves-              mately 25 km. Measurements were also made during the ra-
sels. Rainwater and seawater were also collected from the             diosondes’ descent. Data were communicated to the Global
ship platforms for future offline analysis. Surface seawater          Telecommunications System (GTS) following each sound-
and water column samples from CTD casts were also col-                ing via email to the U.S. National Weather Service and via
lected to investigate the upper ocean mixing and the fresh-           FTP to Météo-France. The data were put into 10 m alti-
water balance to be evaluated in the context of air–sea gas           tude bins and merged with the EUREC4 A sounding network.
exchange and upper ocean circulation.                                 Raw (Level-0), quality-controlled 1 s (Level-1), and verti-
   The goals of NOAA’s Pacific Marine Environmental Lab-              cally gridded (Level-2) data in NetCDF format are available
oratory (PMEL) were to assess the impacts of aerosols on              to the public at AERIS (https://doi.org/10.25326/62). The
clouds and direct aerosol light scattering and absorption on          methods of data collection and post-processing can be found
the temporal variability of net radiation reaching the ocean          in Stephan et al. (2021).
surface and SST for the conditions of a well-mixed bound-

Earth Syst. Sci. Data, 13, 1759–1790, 2021                                             https://doi.org/10.5194/essd-13-1759-2021
P. K. Quinn et al.: Measurements from the RV Ronald H. Brown and related platforms as part of ATOMIC 1769
Table 5. Instrumentation on board the RV Ronald H. Brown for the measurement of atmospheric and aerosol parameters. The O2 and O3
decks were two and three levels above the main deck, respectively.
Instrument Measured/derived quantities, raw sampling interval Location
Atmospheric parameters
Gill WindMaster Pro three-axis ultrasonic anemometer Wind vector, stress, and sensible heat flux, 0.1 s Bow mast
Optical precipitation sensor, OSI Inc., Rain rate, 5 s sampling, collected/recorded every 1 min Bow mast
ORG-815 DA
Li-COR 7500 Gas Analyzer Water vapor density, turbulent latent heat flux, 0.1 s Bow mast
Vaisala HMT335 Air temperature, humidity, 1 min Bow mast
Vaisala PTB220 Atmospheric pressure, 1 min O2 deck
Two Eppley PSPs (Pyranometer) Shortwave radiation, 1 min O2 deck
Two Eppley PIRs (Pyrgeometer) Longwave radiation, 1 min O2 deck
Systron and Donner MP-1 six-axis motion detector system 3-D ship acceleration, 0.1 s Bow mast
Vaisala CL31 Ceilometer Vertical profiles of backscatter from refractive index gradients, O3 deck
cloud base height, cloud fraction, 15 s sampling from 0–7.7 km
with 10 m vertical spacing
Two Parsivel optical rain gauges, 650 and 780 nm Rain rate, equivalent radar reflectivity, particle number O3 deck
StarDot Camera, NetCam XL Pointed to starboard, field of view of 50◦ , image captured every O3 deck
4s
Doppler lidar λ = 1.5 µm Atmospheric vertical velocity and backscatter intensity, hori- O2 deck
zontal wind profiles, estimates of cloud base and mixed-layer
heights; 0.5 s
W-band (95.56 GHz) Doppler vertically pointing cloud radar Vertical profiles of non-precipitating and lightly precipitating O2 deck
clouds from 100 m to 4.2 km with 30 m vertical resolution every
0.5 s
Dual-flow, two filtered radon detector 222 Rn, 30 min O3 deck
Vaisala WXT536 T , RH, rain rate; 1 s O2 deck
Picarro water vapor isotope analyzer (L2130-fi) Water vapor concentration and isotopic composition, 0.2 s Aerosol inleta
Vaisala RS-41 radiosondes Profiles of T , RH, P , and winds every 4 h Main deck
Thermo Environmental Model 49C Ozone, 1 s Inlet at 18 m a.s.l.
Aerosol properties
Collection with multi-jet cascade impactors and analysis by ion Size-segregated concentrations of Cl− , NO− =
3 , SO4 , methane- Aerosol inleta
chromatography, thermal–optical, gravimetric, and XRF analy- sulfonate (MSA− ), Na+ , NH+ 4 , K+ , Mg+2 , Ca+2 , organic car-
sis bon, elemental carbon, trace elements; hours
DMPS and TSI 3321APS Number size distribution 0.02 to 10 µm, 5 min Aerosol inleta
TSI 3025A, 3760A, 3010 Number concentration > 3, 13, 13 nm; 1 s Aerosol inleta
TSI 3563 Nephelometer Sub-1.1 and sub-10 µm light scattering and backscattering; 450, Aerosol inleta
550, 700 nm; 60 % RH; 1 s
TSI 3563 Nephelometers Sub-1.1 µm scattering f(RH); 450, 550, 700 nm; dry and Aerosol inleta
80 %RH; 1 s
Radiance Research PSAP Sub-1.1 and sub-10 µm light absorption; 467, 530, 660 nm; dry Aerosol inleta
DMT CCNC Sub-1.1 µm cloud condensation nuclei concentration, 0.1 % to Aerosol inleta
0.6 % S, 1 s
Solar Light Microtops Sunphotometer Aerosol optical depth; 380, 440, 500, 675, 870 nm O3 deck
a Aerosol inlet was located on the O2 deck, 18 m a.s.l. Final data products of meteorological and navigation data are 1 and 10 min averages of high-resolution raw data and
time-stamped at the beginning of the 1 and 10 min period. Fluxes were calculated at 10 min resolution, then interpolated to 1 min for those files.
https://doi.org/10.5194/essd-13-1759-2021 Earth Syst. Sci. Data, 13, 1759–1790, 20211770 P. K. Quinn et al.: Measurements from the RV Ronald H. Brown and related platforms as part of ATOMIC Figure 3. Instrumentation on board the RV Ronald. H. Brown for the measurement of atmospheric and oceanic parameters located on (a) the bow mast and forward O2 deck and (b) port side O3 deck. Asset deployments are shown for (c) NTAS mooring, (d) ship’s rosette with CTD and Niskin bottles, (e) uCTD, (f) SWIFT, (g) Wave Glider, and (h) radiosonde. Also shown are (i) P-3 fly over of the ship on 23 January and (j) Saildrone upon its return to the United States (Newport, RI) from Barbados. Not shown are disdrometers on the port O3 deck and camera on the starboard O3 deck. Earth Syst. Sci. Data, 13, 1759–1790, 2021 https://doi.org/10.5194/essd-13-1759-2021
P. K. Quinn et al.: Measurements from the RV Ronald H. Brown and related platforms as part of ATOMIC                         1771

   Radiosonde operations were suspended on the ship west           the ship had an underway seawater sampling system con-
of ∼ 56◦ W when the ship transited to Bridgetown for the           sisting of a thermistor SBE38 located at the intake valve
planned in port (24 January at 2:45) and an emergency med-         on the hull and a thermosalinograph SBE45 located inside
ical evacuation (4 February at 10:45). Soundings from BCO          the ship. These sensors produced underway measurements
were stitched together with those from the ship to allow for       of temperature and conductivity (salinity) from water sam-
an uninterrupted data record over the entire cruise.               pled at ∼ 5.3 m below the surface. The values recorded may
   The lifted condensation level (LCL) was calculated from         be representative of seawater properties shallower in depth
the BCO–RHB radiosonde data record and assumed to rep-             due to an unknown amount of mixing along the hull of the
resent cloud base height (CBH). The LCL (in m) was calcu-          ship that is dependent on currents, ship speed, and waves.
lated as                                                           The ship also had a 75 kHz acoustic Doppler current profiler
                                                                   (ADCP) for the measurement of currents at depths greater
LCL = (T50 − Td,50 ) × 125 + 50,                            (1)    than ∼ 17 m.
                                                                      UW deployed an underway CTD (uCTD) for the mea-
where T50 is temperature and Td,50 is dew point, both at 50 m      surement of conductivity (salinity), temperature, and pres-
height (Espy, 1836; Bolton, 1980). The lowest altitude con-        sure (depth) to assess variability in the upper 60 to 130 m
sidered was 50 m to avoid contamination by the temperature         of the water column (Mojica and Gaube, 2021). The uCTD
and relative humidity near the ship’s deck and to minimize         was deployed off the starboard aft quarter. Initially, the probe
the effect of vertical gradients in the surface layer. Since the   was lowered by hand with line pre-measured to 50 m. Casts
calculation started at 50 m, 50 was added to the LCL.              were completed more frequently and with an electric winch
                                                                   after the NTAS mooring work was done which freed up deck
2.5   Shipboard oceanic measurements                               space. During Leg 2, a cast with the ship’s CTD was con-
                                                                   ducted every day at 13:00 (31 January, 1 and 2 February) or
Instrumentation on board the RV Ronald H. Brown for the            17:00 (3, 8, and 9 February) shortly after a uCTD cast. These
measurement of oceanic parameters is listed in Table 6. Lo-        casts were used to correct the uCTD conductivity data which
cations of instruments mounted on the deck are shown in            had a small offset due to interference from the sensor guard.
Fig. 3. As stated above, UM’s M-AERI, located on the port          A transect of intensive uCTD data was collected when the
side forward O2 deck, measured sea surface skin temperature        ship transited from NTAS (S1) to S2 on 18 January. While at
(Minnett et al., 2001).                                            S2, uCTD casts were conducted every 1 to 4 h. In addition,
   During Leg 1, the Applied Physics Laboratory at the Uni-        uCTD casts were conducted every 2 h during the majority of
versity of Washington (APL-UW) also measured sea surface           Leg 2 when the ship was stationary. The frequency of uCTD
skin temperature with a Remote Ocean Surface Radiometer            sampling increased to every 10 min between 13:00 and 15:15
(ROSR) located near the M-AERI. PSL measured subskin               on 9 February to study heaving of periodic internal waves lo-
temperature at approximately 0.05 m depth with a floating          cated at the base of the mixed layer (60–80 m depth) and for
thermistor (a.k.a. sea snake) deployed off the port side. A        7 h at the end of Leg 2 on 11 and 12 February as the ship
skin temperature value was estimated by the COARE algo-            transited across a strong SST front in the upwind direction.
rithm using the sea snake data as input (Fairall et al., 1996,     uCTD casts were also performed when deploying or recover-
1997). This algorithm accounts for the cool skin present in        ing the SWIFTs and Wave Gliders for comparison purposes.
the upper ∼ 0.2–1 mm and any potential diurnal warm lay-
ers in the upper ∼ 10 m. This COARE-calculated skin T and          2.6   Wave Glider measurements
the current-relative wind were used to compute bulk, eddy
covariance, and inertial dissipation air–sea fluxes (Fairall et    Two Wave Gliders (serial numbers 245 and 247) operated
al., 1997, 2003). The COARE 3.6 algorithm estimated wave           by APL-UW were deployed within 15 min of each other on
parameters using wind as input. The parameterization is            9 January (Fig. 1a and Table 2). The Wave Gliders greatly
based on fits to the Banner and Morison (2010) wave model          increased the sampling of spatial inhomogeneities in atmo-
and the flux database collected by NOAA PSL, University            spheric and oceanic properties as well as bulk air–sea fluxes
of Connecticut, and Woods Hole Oceanographic Institution           in the study area (Thomson and Girton, 2017; Thomson et al.,
(Fairall et al., 2003; Edson et al., 2013). PSL also measured      2018). The deployment occurred in transit to NTAS approxi-
significant wave height and period with a 1-dimensional            mately 45 nmi to the southwest of the buoy with the intent of
downward-looking RIEGL laser altimeter mounted on the              leaving the Wave Gliders in the water throughout the length
bow mast.                                                          of the cruise. They were remotely piloted from shore via an
   The ship’s rosette-mounted CTD was intermittently de-           online portal to cross gradients in SST and ocean currents.
ployed off the starboard main deck for comparison to the           Data were available in near real time, which helped guide
uCTD, Wave Gliders, SWIFTs, and NTAS moorings. Wa-                 their course. The Wave Gliders were equipped with surface
ter was collected from the Niskin bottles for analysis of the      meteorological sensors (bulk winds, air temperature, relative
isotopic composition of oxygen and hydrogen. In addition,          humidity, pressure, and longwave and shortwave radiation),

https://doi.org/10.5194/essd-13-1759-2021                                         Earth Syst. Sci. Data, 13, 1759–1790, 2021
1772 P. K. Quinn et al.: Measurements from the RV Ronald H. Brown and related platforms as part of ATOMIC
Table 6. Instrumentation on board the RV Ronald H. Brown for the measurement of seawater parameters. O2 deck is two levels above the
main deck.
Instrument Measured/derived quantities, raw sam- Location
pling interval
Marine Atmospheric Emitted Radiance Sea surface skin temperature, 5–7 min O2 deck
Interferometer (M-AERI) averages
Remote Ocean Surface Radiometer Sea surface skin temperature, 5 min av- O2 deck
(ROSR) erages
Floating YSI 46040 Thermistor (sea Subskin sea surface temperature, Deployed off port side with outrigger
snake) ∼ 0.05 m depth, 1 s
Riegl 1-D laser altimeter Wave height and period, 10 min aver- Bow mast
ages
Seabird 9+ CTD At station conductivity (salinity), tem- Deployed off starboard side, main deck
perature, depth (pressure), PAR, fluo-
rescence, and oxygen
Seabird SBE45 thermosalinograph Seawater temperature, conductivity 5.3 m below the surface
Seabird SBE38 thermistor (salinity), 1 s
Acoustic Doppler current profiler Current velocity across two depth Ship’s hull
75 kHz (ADCP) ranges depending on mode. Nar-
rowband: 29–892 m. Broadband:
17–333 m. 5 min sampling.
RBR Concerto underway CTD + Tuna Conductivity (salinity), temperature, Deployed off starboard aft quarter
Brute winch (uCTD) and depth (pressure) from the surface to
60 or 130 m depending on cast
sky cameras, wave motion sensors, downward-looking AD- had detached and were being dragged by wires on the port
CPs for currents, and CTDs at 1 and 8 m depth for conduc- side of vehicle. A small boat was deployed to clip the ra-
tivity (salinity) and temperature measurements at 1 and 8 m diometer wires and take the instruments back to the ship.
depth. Measurements were collected during 20 min bursts ev-
ery 30 min. Final data products are 60 min averages of high- 2.7 SWIFT measurements
resolution raw data within each hour, time-stamped at the
beginning of the hour. Instrumentation on board the Wave Drifting with ocean currents and winds, the SWIFTs (Surface
Gliders is listed in Table 7. Wave Instrument Floats with Tracking) offered a Lagrangian
Wave Glider 245 was recovered, repaired, and redeployed view of the near-surface ocean and atmospheric properties,
on 30 January. Telemetered data suggested that the humidity ocean waves and currents, bulk air–sea fluxes, and cloud fea-
sensor had malfunctioned. When recovered, it was found that tures (Thomson, 2012; Thomson et al., 2019). Instrumenta-
the radiometers and their entire mounting pole were gone, tion on board SWIFTs v4 and v3 is listed in Tables 8 and 9,
water was inside the data logger housing, the Airmar me- respectively. Six SWIFT drifters were deployed in two SE–
teorological sensor and light were broken, and the Vaisala NW lines across gradients in SST and ocean surface currents
meteorological sensor was destroyed. The radiation measure- – once during Leg 1 and once during Leg 2. These gradi-
ments lasted approximately 1 week into the deployment. The ents were identified with satellite MUR v4 SST daily plots
Wave Glider was redeployed with spare Vaisala and Airmar and the ship’s underway thermistor, thermosalinograph, and
meteorological sensors but no radiometer. Wave Glider 245 ADCP. Two v3 (serial number 16 and 17) and four v4 (se-
was recovered for the final time on 7 February because it rial number 22, 23, 24, and 25) SWIFTs were deployed. All
was experiencing navigation problems that could have en- had bulk meteorological sensors (winds, air temperature and
dangered the vehicle. Wave Glider 247 sampled from 9 Jan- pressure on all models, plus relative humidity on the v4 mod-
uary to 11 February. On 31 January, Wave Glider 247 was els), sky cameras, and CTD sensors at 0.3 m depth for mea-
inspected with the ship at close range after finding Wave suring temperature and conductivity (salinity). The v3 mod-
Glider 245 damaged the day before. The meteorological sen- els also had conductivity and temperature sensors at 1.1 m
sors were found to be in good condition, but the radiometers depth. The v3 SWIFTs measured ocean turbulence in the up-
per 0.62 m. The v4 SWIFTs measured ocean turbulence in
Earth Syst. Sci. Data, 13, 1759–1790, 2021 https://doi.org/10.5194/essd-13-1759-2021P. K. Quinn et al.: Measurements from the RV Ronald H. Brown and related platforms as part of ATOMIC 1773
Table 7. Instrumentation on board the Wave Gliders for the measurement of atmospheric and seawater parameters. Data were collected
during bursts lasting 20 min at the top of each hour. Measurements were collected during 20 min bursts every 30 min. Final data products are
60 min averages of high-resolution raw data within each hour and time-stamped at the beginning of the hour.
Instrument Measured quantity Height (+) Raw sampling interval
depth (−) (m)
Airmar 200WX Wind velocity (true and rel- +1.3 1s
ative), GPS position, course
over ground (COG), speed over
ground (SOG), magnetic head-
ing, temp, pressure, pitch and
roll
Vaisala WXT530 Wind velocity, air temperature, +1 1s
pressure, relative humidity, rain
rate
Kipp & Zonen CMP3 pyra- Shortwave radiation (300– +1 5s
nometer 2800 nm)
Kipp & Zonen CGR3 pyrge- Longwave radiation (4200– +1 5s
ometer 4500 nm), temperature of
sensor
GPSWaves/Microstrain Directional (2D) wave spectra, 0 0.25 s
3DM-GX3-35 GPS/AHRS and standard bulk wave param-
eters of height, period, direction
Aanderaa 4319 Conductivity, temperature −0.24 2s
RDI Workhorse Monitor Ocean current profiles with 4 m Data be- 1 s pings, ensemble averages
300 kHz ADCP vertical resolution tween −6 and recorded every 2 min
−100 m
Seabird GPCTD + DO Conductivity, temperature, −8 m 10 s
depth, dissolved O2
the upper 2.64 m. Both versions had ADCPs that measured of BCO, where the North Brazil Current Rings propagate
vertical profiles of currents down to 20 m. The SWIFTs sam- northwestward toward Barbados. Saildrone 1064 sampled in
pled high-resolution bursts of data for 8 min at the top of each trade wind alley along the leg between BCO and NTAS.
hour. These data were archived on board the vehicle for fi- In addition, Saildrone 1064 coordinated sampling with the
nal processing once recovered. The 8 min data segments and RV Ronald H. Brown, remote sensing from research air-
platform location were also averaged and reported via Irid- craft, NTAS, Wave Gliders, and SWIFTs. Saildrones 1063
ium satellite telemetry each hour for monitoring purposes. and 1064 were equipped to measure near-surface ocean tem-
SWIFT locations were also tracked in real time using the AIS perature and salinity, upper-ocean current profiles (6–100 m),
ship traffic system (local VHF radio signals). The SWIFTs surface air temperature, humidity, pressure, wind direction
were deployed for 8 d during Leg 1 (14 to 22 January) and and speed, wave height and period, short- and longwave ra-
13 d during Leg 2 (30 January to 11 February). diation, and cloud images (Table 10). This system enabled
calculation of the bulk latent heat flux and direct turbulent
fluxes of momentum and sensible heat. Six thermistors were
2.8 Saildrone measurements strapped on the keel to measure the surface layer stratifica-
tion. Onboard data processing included averaging and mo-
NOAA sponsored two Saildrones for the ATOMIC cam-
tion correction; 1 min averages (5 min average for ADCP
paign to obtain high-quality multiscale air–sea fluxes (Zhang
current) were telemetered in real time, while high-resolution
et al., 2019) in two different regimes. Both were launched
data were downloaded after the Saildrones returned to United
from Bridgetown, Barbados, on 12 January 2020. Sail-
States. During the 1-month ATOMIC intensive observation
drone SD1063 focused on the large ocean eddies southeast
https://doi.org/10.5194/essd-13-1759-2021 Earth Syst. Sci. Data, 13, 1759–1790, 2021You can also read