Documentation Part 1: for Basics, Deep Breathing Test, Short Term HRV, HRV-Biofeedback / Qiu, Parameters, BioSign
←
→
Page content transcription
If your browser does not render page correctly, please read the page content below
Documentation
                       for

                  Part 1:
Basics, Deep Breathing Test, Short Term HRV,
    HRV-Biofeedback / Qiu, Parameters,
          FAQ, HRV and Respiration

                    BioSign GmbH
                   Brunnenstr. 21
                 D-85570 Ottenhofen
                  www.biosign.de
                  info@biosign.de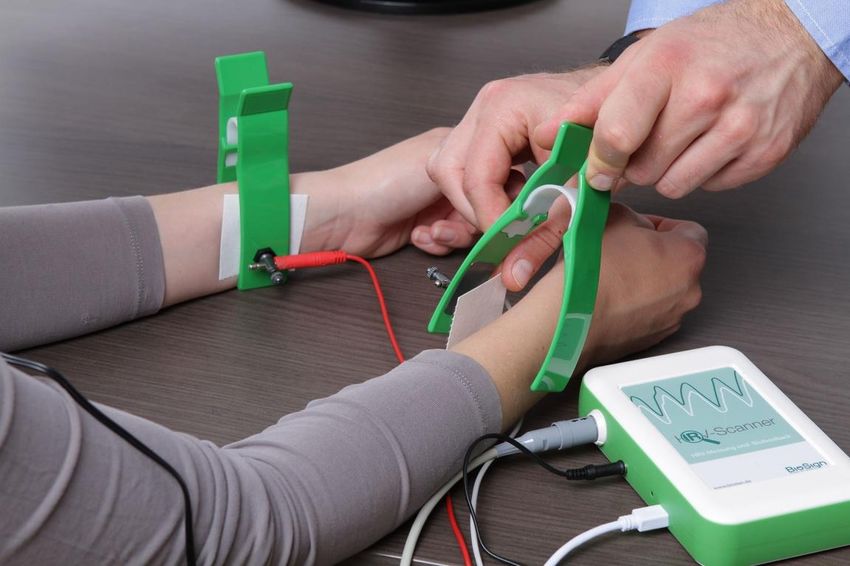
Content

Foreword ............................................................................................................7
   Online training / support via TeamViewer ........................................................................... 7
   Questions about interpretation .......................................................................................... 7
   Status of the documentation ............................................................................................. 7
   Newsletters ..................................................................................................................... 7
   Information for patients/clients ......................................................................................... 7
   Our HRV concept ............................................................................................................. 7
General ...............................................................................................................8
   Setup of the HRV-Scanner software (HRV-Scanner and HRV-Scanner lite) .............................. 8
   Uninstall the software....................................................................................................... 8
   Licensing the software ...................................................................................................... 8
   Update license ................................................................................................................. 8
   Connecting the hardware .................................................................................................. 8
   Start software ................................................................................................................. 8
   Append new examiner ...................................................................................................... 8
   Append new subject ......................................................................................................... 9
   The main window ............................................................................................................. 9
   Status display in the main window ..................................................................................... 9
Possible system configurations ...........................................................................9
   Network mode ................................................................................................................. 9
   GDT Connection............................................................................................................... 9
   Language selection .......................................................................................................... 9
   Your logo or information in the reports ............................................................................... 9
Other important functions .................................................................................10
   Data backup...................................................................................................................10
   Import/Export ................................................................................................................10
FAQ - common problems and questions ............................................................10
   I made a measurement accidentally for the wrong subject ...................................................10
   I forgot my access password ............................................................................................10
   When I start the HRV-Scanner software, I am asked to enter a license code ..........................10
   I connected the hardware to the PC, but the status is "USB offline" .......................................10
   My HRV-Scanner hardware no longer shows ECG ................................................................10
Signal acquisition with the HRV-Scanner hardware during the measurement ...11
Notes on improving data quality during analysis ..............................................15
   Step 1: Visual control of heart rate curve and biosignal .......................................................15
   Step 2: Optimal automatic determination of the heartbeat in the biosignal .............................16
   Step 3: Manual editing in biosignal....................................................................................17
   Step 4: Graphic filtering ..................................................................................................21
   Step 5: Adjust plausibility check and heart rate filters .........................................................23
Limits of HRV determination .............................................................................25
   Example 1: many irregular heart beats (marked in orange) .................................................25
   Example 2: Atrial fibrillation .............................................................................................26
HRV concept "Tone, Flexibility, Dynamics" .......................................................27
   Tone .............................................................................................................................28
   Flexibility .......................................................................................................................28
                                                                           2
                              Documentation for HRV-Scanner V 5.02 - copyright 2020 by BioSign GmbH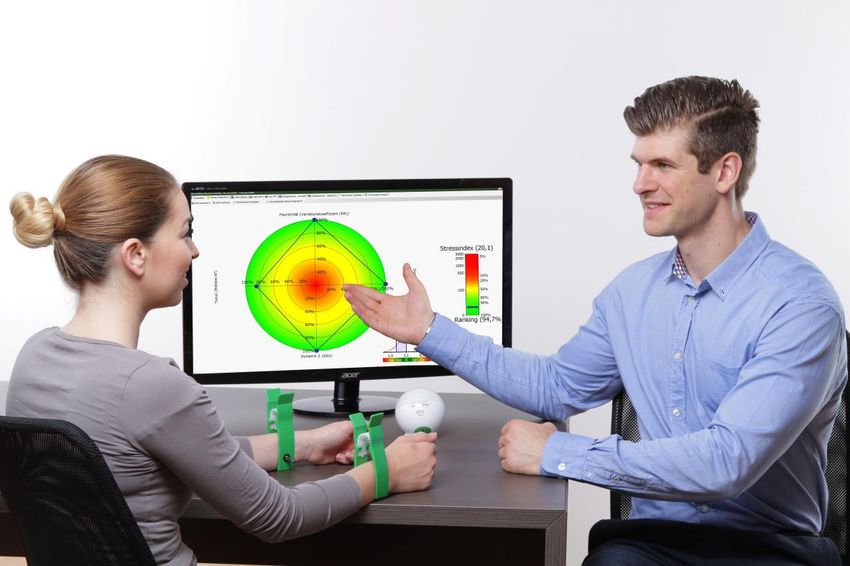
Dynamics.......................................................................................................................29
Understanding the rank chart ...........................................................................30
Basis HRV measurements .................................................................................33
The Short-Term HRV .........................................................................................33
Target parameter in the rank diagram of the Short-Term HRV measurement ...36
Flexibility (Coefficient of Variation RR) ...............................................................................36
Tone (mean HR) .............................................................................................................37
Dynamics 1 (SD1) ..........................................................................................................37
Dynamics 2 (SD2) ..........................................................................................................37
SD2/SD1 ratio ................................................................................................................38
Stress index ...................................................................................................................38
Respiration and HRV .........................................................................................39
Influence of breathing on the results of the short-term HRV .................................................39
Distinguishing sympathetic - parasympathetic in the short-term HRV ....................................40
Conclusion .....................................................................................................................41
Methods for measuring breathing .....................................................................41
EDR - ECG Derived Respiration (HRV-Scanner standard and HRV-Scanner lite).......................41
Mechanical determination of respiration - breathing belt (HRV-Scanner plus) .........................42
The Deep Breathing Test ...................................................................................44
Target parameter in the rank diagram of the Short-Term HRV measurement ...47
Flexibility (E-I) ...............................................................................................................47
Tone .............................................................................................................................48
Dynamics.......................................................................................................................48
Why two measurements as a basis HRV ............................................................49
What has a negative impact on HRV..................................................................50
Anticholinergic drugs .......................................................................................................50
Drugs with anticholinergic action ......................................................................................50
Further diagrams in the analysis .......................................................................51
Poincaré Plot ..................................................................................................................51
Histogram ......................................................................................................................52
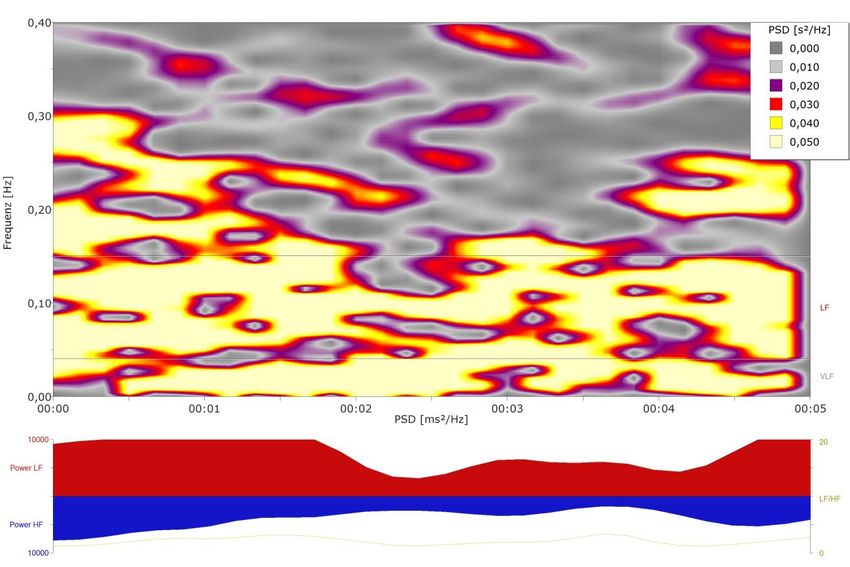
Spectral analysis ............................................................................................................53
Color-FFT .......................................................................................................................53
ANS status .....................................................................................................................55
Parameter History/Pre-measurements ...............................................................................56
Number of pre-measurements in the HRV-Scanner lite ........................................................57
Pre-measurements in the HRV-Scanner standard ..............................................57
Rank chart .....................................................................................................................58
Biofeedback History ........................................................................................................58
Changes ........................................................................................................................60
Parameter......................................................................................................................60
List of parameters .............................................................................................61
Calculate heart rate from [] .............................................................................................61
Sampling rate [Hz] .........................................................................................................61
Duration [hh:mm:ss] ......................................................................................................61
Number of heartbeats [n] ................................................................................................61
Artefact ratio [%] ...........................................................................................................61
Well-being [%] ...............................................................................................................61
3
Documentation for HRV-Scanner V 5.02 - copyright 2020 by BioSign GmbH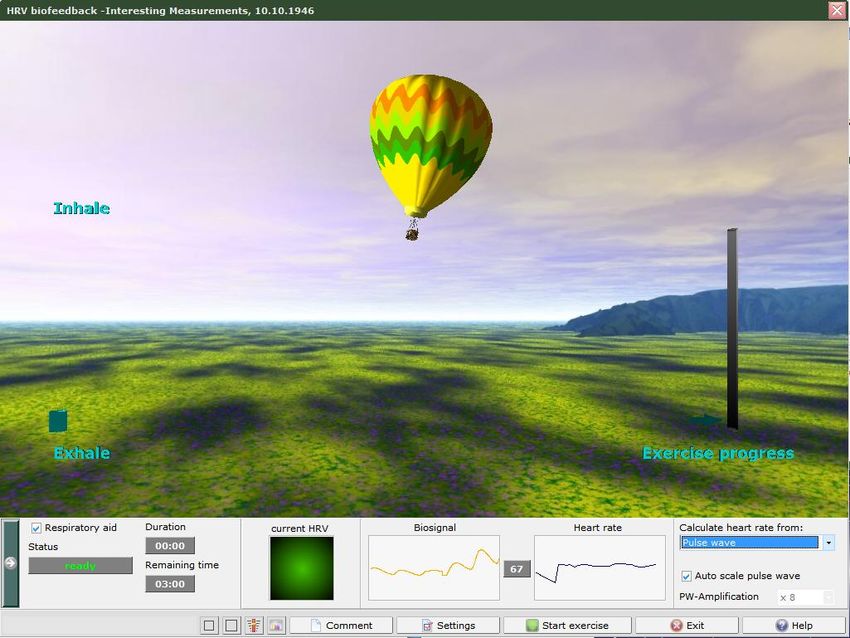
DBT quality [%] .............................................................................................................61
Test quality [%] .............................................................................................................61
Biofeedback quality [%] ..................................................................................................61
Subject age [years] ........................................................................................................61
Subject height [cm] ........................................................................................................61
Subject weight [kg] (initial) .............................................................................................61
Subject sex ....................................................................................................................61
Examiner .......................................................................................................................61
Mean HR [1/min.] ...........................................................................................................62
Standard deviation (St.Dev.) [ms] ....................................................................................62
Coefficient of variation (HR) [%].......................................................................................62
Mean RR interval [ms] .....................................................................................................62
SDNN [ms] ....................................................................................................................62
PNN50 [%] ....................................................................................................................62
PNN20 [%] ....................................................................................................................62
Coefficient of variation (RR) .............................................................................................63
RMSSD [ms] ..................................................................................................................63
SD1 [ms] .......................................................................................................................63
SD2 [ms] .......................................................................................................................63
SD2/SD1 quotient ...........................................................................................................63
Normalized SD2/SD1 quotient [σ] .....................................................................................64
Stress index [Pts.] ..........................................................................................................66
HF-Band [Hz] .................................................................................................................67
LF-Band [Hz]..................................................................................................................67
VLF-Band [Hz] ................................................................................................................67
Power HF-band [ms²] ......................................................................................................67
Power LF-band [ms²] ......................................................................................................67
Power VLF-band [ms²] ....................................................................................................67
Power total [ms²] ...........................................................................................................67
rel. Power HF-band [%] ...................................................................................................67
rel. Power LF-band [%] ...................................................................................................67
rel. Power VLF-band [%] .................................................................................................67
LF/HF ratio .....................................................................................................................67
Rhythmisation degree [] ..................................................................................................67
E-I [1/min.] ...................................................................................................................68
E/I [] ............................................................................................................................68
MCR [] ..........................................................................................................................68
Ewing 30:15 value [].......................................................................................................68
Biological HRV age [years] ...............................................................................................68
Valsalva-Ratio ................................................................................................................69
Alpha 1 [] ......................................................................................................................69
Respiration parameters ...................................................................................................70
Impact breathing [%] .....................................................................................................70
Respiratory rate [1min.] ..................................................................................................70
Respiration stress[].........................................................................................................70

                                                                        4
                           Documentation for HRV-Scanner V 5.02 - copyright 2020 by BioSign GmbH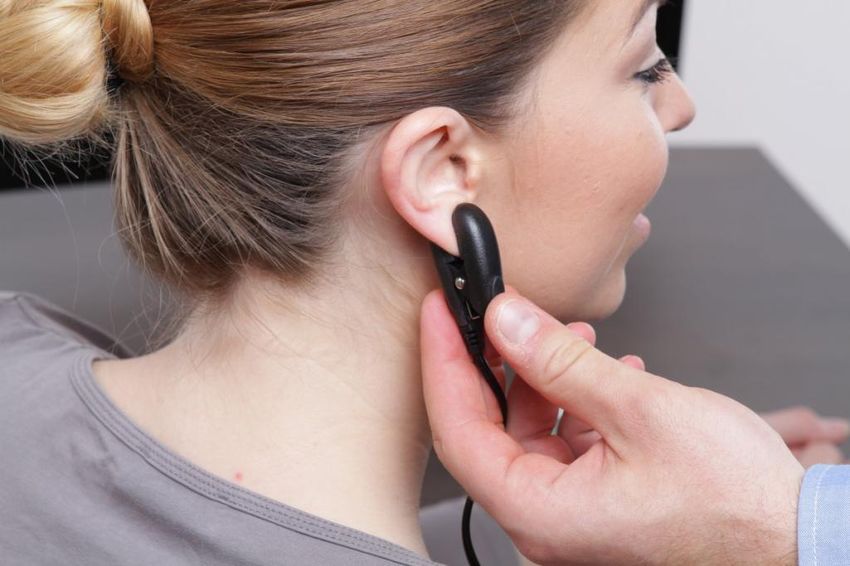
Breathing variability [] ....................................................................................................70
  Pulse wave latency [ms] ..................................................................................................70
HRV biofeedback ...............................................................................................71
  HRV biofeedback ............................................................................................................71
  Online spectral analysis (Real time FFT).............................................................................72
  Rhythmisation ................................................................................................................72
Fundamentals of HRV Biofeedback ....................................................................73
  From chaos to order ........................................................................................................73
Breathing is the key to coherence .....................................................................73
  As you learn, breathing and heartbeat are rhythmic ............................................................74
  How to improve coherence through biofeedback .................................................................74
  What to do if coherence is always low? ..............................................................................74
  What does the balloon mean in the centre of the screen? ....................................................75
  How often and how long should you practice HRV Biofeedback? ............................................75
Important settings in HRV Biofeedback ............................................................76
  Breathing rhythm ...........................................................................................................76
  Exercise duration ............................................................................................................76
  Rhythmization degree target value (difficulty level of the exercise) .......................................76
Qiu and HRV-Scanner ........................................................................................77
  The Qiu .........................................................................................................................77
  The Qiu-Modul in the HRV-Scanner-Software......................................................................77
  Qiu-Configurator .............................................................................................................77
    Connecting the Qiu to the PC ......................................................................................................... 77
    Assigning a Qiu to a subject .......................................................................................................... 77
    Configuration of the breathing display on the Qiu ............................................................................. 78
    Determine the exercise difficulty .................................................................................................... 78
    Set the exercise duration .............................................................................................................. 78
    Configuring the brightness of the biofeedback.................................................................................. 78
  Additional functions.........................................................................................................78
    Set the date / time of the Qiu ........................................................................................................ 78
    Clear the Qiu’s measurement memory ............................................................................................ 78
    Qiu Signal Check .......................................................................................................................... 78
    Ear clip as an alternative ............................................................................................................... 79
  Qiu measurements ..........................................................................................................79
    Defining the exercise plan by day of the week and time of day .......................................................... 79
    Management of Qiu measurements ................................................................................................ 79
    Rework the measurement ............................................................................................................. 79
    Overview of the exercise success with statistical evaluation ............................................................... 80
    Statistical evaluation: ................................................................................................................... 80
    Filter settings .............................................................................................................................. 80
    Overview of Exercise Compliance, Compliance Index ........................................................................ 81
  HRV-Monitoring with the Qiu ............................................................................................82
  Instruction .....................................................................................................................82
     How do you turn the Qiu on / off? .................................................................................................. 82
     How can I leave the setting mode if it was accidentally activated when switching on? ........................... 82
     Which holding position is suitable? ................................................................................................. 82
     Which sensor position is suitable? .................................................................................................. 82
     How do I recognize an inappropriate sensor position? ....................................................................... 82
     The optical biofeedback stays permanently on red or green, no matter what I do? ............................... 82
     What does the wandering blue LED light at the equator of the Qiu mean? ........................................... 83
     Why does the Qiu light up brightly when it turns on? ........................................................................ 83
     After the bright light when switching on the Qiu flashes recently red once again, why? ......................... 83
                                                                         5
                            Documentation for HRV-Scanner V 5.02 - copyright 2020 by BioSign GmbH
After the light comes on, the Qiu flashes red three times and then turns off, why? ............................... 83
      Does the time and date in the Qiu have to be reset after changing the battery? ................................... 83
      How can the subject change the batteries? ...................................................................................... 83
Possibilities of ECG derivation ...........................................................................84
   Derivation of a 1-channel ECG with clamp electrodes ..........................................................84
   Derivation of a 1-channel ECG with adhesive electrodes ......................................................85
   Derivation of a 3-channel ECG (only HRV scanner hardware plus) .........................................85
Technical Manual ..............................................................................................86
   PC Hardware PC Requirements .........................................................................................86
   Maintenance and Servicing...............................................................................................86
   Copyright.......................................................................................................................86
   Liability .........................................................................................................................86
   Warranty .......................................................................................................................86
Technical details ...............................................................................................86
Appendix - Literature ........................................................................................87
   Literature SD2/SD1 ratio .................................................................................................87

                                                                           6
                              Documentation for HRV-Scanner V 5.02 - copyright 2020 by BioSign GmbH
Foreword
Thank you for your interest in our HRV-Scanner system. BioSign has been active in the area of heart rate
variability (HRV) and the analysis of the vegetative nervous system for over 20 years. The HRV-Scanner
software as a major part of our HRV concept reflects our know-how gained over the years and is therefore quite
extensive in some areas. We would be happy to answer any questions you may have and we would be pleased
to assist you with our product.

Online training / support via TeamViewer
When purchasing a HRV-Scanner, or when using our free demos, we offer you online support or training via
TeamViewer®. All you need is a PC with internet access on which the HRV-Scanner software is installed and a
telephone. If you are interested, make an appointment with us. In addition, we offer seminars and full-day
trainings. You can find more information on our homepage at www.biosign.de

Questions about interpretation
You have questions about the technical quality of your HRV measurement, or how to interpret the results?
Please contact our free support by e-mail (info@biosign.de). For a fast and competent support, we have
installed an export possibility of measurements in the HRV-Scanner. So we can look at the measurements and
give you tips and interpretation aids.

Status of the documentation
This documentation represents the status of the HRV-Scanner software when printing the copy in your hands.
However, since we also do some scientific research and always make an effort to integrate the current state of
science into our products, there are always changes and innovations in the software. All of our new features are
fully accessible via our online software update system. Changes in the software also lead to a need to update
this documentation from time to time. Therefore you will always find a current version of this documentation as
a PDF file together with the updates in your software under "Help".

Newsletters
Would you like to be kept up-to-date? We would be glad to send you our newsletter. This usually happens
automatically when you buy one of our systems. You will receive our newsletter without obligation. You can
unsubscribe at any time. The newsletter provides information about new software features or other important
innovations for HRV-Scanner users.

Information for patients/clients
Do you need information material for your patients/clients? We offer flyers, posters, info brochures, info maps
and much more. You can find more information in our online shop at www.biosign.de

Our HRV concept
In addition to the HRV-Scanner, we also offer HRV biofeedback devices for your patients/clients. This enables
us to provide you an HRV monitoring concept for objective monitoring your therapy or intervention. The
measurement data are accessible in the terminals or via an Internet cloud and trends can be calculated.

 Please note that not all features listed in this documentation are available in the
                             HRV-Scanner lite software.

                                                       7
                      Documentation for HRV-Scanner V 5.02 - copyright 2020 by BioSign GmbH
General

Setup of the HRV-Scanner software (HRV-Scanner and HRV-Scanner lite)

Please download the current setup from our homepage (www.biosign). The setup can be found under: HRV-
Scanner -> Downloads ->

                                                            Run the HS_Setup.exe program. To avoid
                                                            problems with Windows user administration, we
                                                            recommend an installation in a directory as
                                                            proposed in the setup (C: \HRVScanner)

Uninstall the software
Uninstall the HRV-Scanner software by using the Windows Control Panel.

Licensing the software
The software license is located on the blue HRV-Scanner dongle, which must be connected to USB to run the
software. Alternatively, there is the option of an online license via the Internet. Note: You can install the
software on any number of PCs. The software runs where the blue HRV-Scanner dongle (license) is attached.

Update license
The HRV-Scanner software runs without time-limits. When you buy a system, you get 365 days of update
license. This allows you to benefit from all further developments of the HRV-Scanner software free of charge.
The software checks, at intervals (to be defined in the system control of the HRV-Scanner software), whether
new updates are available and then downloads them from the BioSign server and installs them.

An extension of the update license after expiration is possible at any time. Use the order option in the HRV-
Scanner software.

Connecting the hardware
Connect the HRV-Scanner hardware to your PC using delivered the USB cable. The HRV-Scanner software
should not be started. Wait for the drivers of Windows to be installed and until Windows says, that the device
can be used now.

Start software
First plug your HRV-Scanner dongle into a free USB port. If you do not have a free USB port, we recommend
using a USB hub (included with the HRV-Scanner). Start the HRV-Scanner software by double clicking with the
mouse on the HRV-Scanner symbol. Depending on which version you have received you can either run only the
HRV-Scanner lite software or the HRV-Scanner and the HRV-Scanner lite software.

HRV-Scanner software                        HRV-Scanner lite software
Full version with all features              Starter version for Windows Tablet and PC

Tip: At the beginning, the lite version can make the entry much easier since the user is guided by the software
through measurements.

Append new examiner
When you first start the HRV-Scanner software, you must first create a new examiner. Enter the data for the
new examiner. The password is optional and should be entered if a data record is to be protected against
unauthorized access. After recording a new examiner, it appears in the login window. Press "OK" to log in to the
system.

                                                        8
                       Documentation for HRV-Scanner V 5.02 - copyright 2020 by BioSign GmbH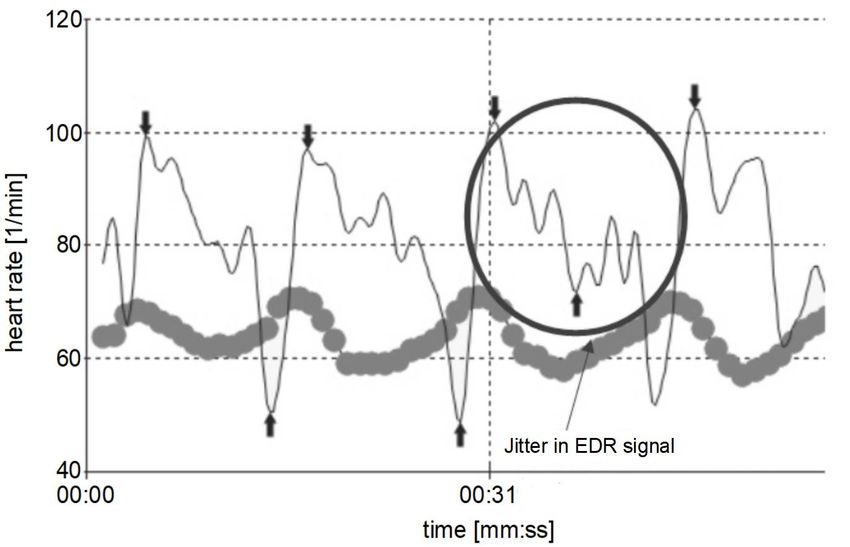
Append new subject
Before a measurement can be performed, the subject data must first be entered. To do this, go to the main
menu and press "Subject" and then "Append new subject". After recording a subject, you can perform the first
measurement.

The main window
After logging in to the examiner, you enter the main window of the HRV-Scanner. From here you can reach all
other program features.

Status display in the main window
The status display is shown in the main window at the bottom right

                                                         Version of the HRV-Scanner Software (Compact,
                                                         Professional or Study)

                                                         Software version

                                                         Serial number of your Dongle or info about
                                                         online license

                                                         Remaining days for updates from the internet.
                                                         Are there new updates available?

                                                         Local or network mode

You will also see in the status line below which examiner is logged in, whether you are in the subject or study
mode, and the current percentage size of the software scaling.

Possible system configurations

Network mode
It is possible to run the HRV-Scanner software in network mode. This allows data to be stored centrally and
used by several clients (examination room, meeting room, ...)

GDT Connection
A transfer of the patient data from a doctor's office software is possible via GDT.

Language selection
The HRV-Scanner software is available in several languages. Select the desired language in the system
settings.

Your logo or information in the reports
You can include your logo and other information in the header of the reports

                                                         9
                       Documentation for HRV-Scanner V 5.02 - copyright 2020 by BioSign GmbH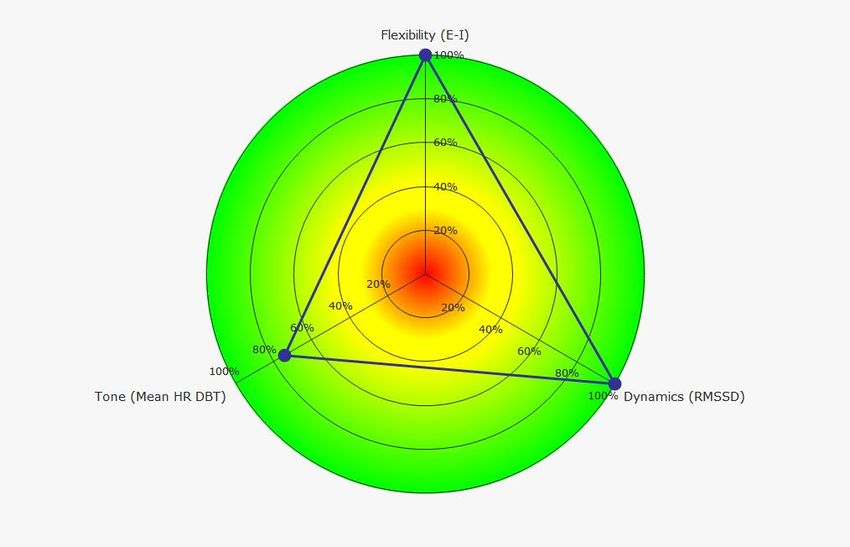
Other important functions
Data backup
We recommend to regularly back up the data. There is a separate function in the HRV-Scanner software.
Tip: we also recommend to save the entire HRV-Scanner directory, including all subdirectories, to an external
data medium from time to time.

Import/Export
The HRV-Scanner software has an export/import system, which allows the export of measurements including all
information on the subject. You can use this for data exchanged between several HRV-Scanner systems and
also for the support. You can send measurements with anonymous test data by e-mail to us and write any
questions.

FAQ - common problems and questions

I made a measurement accidentally for the wrong subject
                                         Measurements can be moved to another subject. Use the
                                         function "Move to subject" in the title menu of the "Test and
                                         analysis" window.

                                               In the displayed window, select the subject to which the
                                               measurement should be moved.

I forgot my access password
Please contact us by e-mail and send us the file "HRVScanner.mdb" from the HRV-Scanner directory by e-mail.
We can read the encrypted file and give you your password.

When I start the HRV-Scanner software, I am asked to enter a license code
Is your USB dongle connected to the PC? Possibly the dongle is not recognized. This problem can often be
solved by using the included USB hub.

I connected the hardware to the PC, but the status is "USB offline"
                                                     Did you select the right hardware before starting the
                                                     measurement?

My HRV-Scanner hardware no longer shows ECG
Do you still have a device from the first generation (battery compartment on the bottom). Then replace the
batteries with new and charged batteries.

                                                      10
                     Documentation for HRV-Scanner V 5.02 - copyright 2020 by BioSign GmbH
Signal acquisition with the HRV-Scanner hardware during the
measurement
The HRV-Scanner software is compatible with several devices for signal acquisition. Devices are used via USB
and Bluetooth. This chapter explains the acquisition of a 1-channel ECG and the pulse wave using the HRV-
Scanner hardware.
Note: We recommend that you take care for a good biosignal while measuring.
This avoids the post-processing during the analysis.
Connect the hardware elements, as shown in the picture. If the banana plugs cannot be inserted into the
brackets, please turn the top wheel upwards. Plug the USB cable into an available USB port on your PC. If no
free USB port is available, please use the included USB hub.
The drivers are installed when connecting the hardware to the PC for the first time. Please wait until this
process is finished!
Apply the ECG clamp electrodes to the subject. In contrast to the picture above, in most cases the red cable
should go on the right hand. Important is that the R-wave in the ECG points upwards. If the wave is pointing
downwards, the ECG clamp electrodes should be replaced right/left. The ECG paper should be moistened with
water and laid under the ECG clamp electrodes. Alternatively, electrode gel can also be used.
Note: If you do not get a sufficiently large R-wave with lead I (right wrist against left wrist), you should try
lead III (right wrist against left wrist). To do this, place the clip from the left wrist to the left ankle. In most
cases, one of the two leads brings a large R-wave and thus saves post-processing. (see also chapter:
Possibilities of ECG derivation)
11
Documentation for HRV-Scanner V 5.02 - copyright 2020 by BioSign GmbHPlace the ear clip as shown in the picture. Attach the silver holding clip of the cable at the shirt collar or
neckline of the subject's clothes.
Two kinds of biosignals are basically recorded by the HRV-Scanner software. The ECG (taken off with clamps or
electrodes) and the pulse wave (taken off with the ear clip). When using alternative hardware, depending on
what hardware you are using, either both or only one of the two signal sources are available. E.g. the HRV-
Scanner hardware records ECG and pulse wave, the Faros 180 only ECG, the Qiu and the myQiu hardware only
pulse wave.
Here is an example of an optimal ECG signal. The sharp R-waves are clearly visible and directed upwards. The
baseline of the ECG is slightly noisy and the R-waves are clearly distinguished in size from the rest of the
signal. The vertical bar in the R-waves indicates that the software has detected and marked a heartbeat.
12
Documentation for HRV-Scanner V 5.02 - copyright 2020 by BioSign GmbHThe shape of the ECG with its sharp R-wave makes it possible to set the time of a heartbeat very precisely. The
pulse wave is a rather soft, vibrating signal. Here, setting the time of a heartbeat is more difficult and
somewhat inaccurate. Furthermore, the pulse wave also is influenced by the regulation of the vessels, which
may additionally increase the deviation compared to the accuracy of the ECG.
As a result, the ECG (and possibly in addition the pulse wave) should be used for HRV measurements (Deep
Breathing Test, Short-Term HRV). The accuracy of the pulse wave alone is sufficient for the HRV biofeedback.
Also because of the simpler application in practice one can use the pulse wave without hesitation to the HRV
biofeedback.
Here is an example of a non-optimal ECG signal. The high and sharp R-waves are clearly visible but directed
downwards. This is called a wrong polarized ECG. This can be easily corrected by changing (left to right) the
electrodes.
Here is an example of an unusable ECG signal. The R-waves are no longer clearly visible and their height is only
slightly greater than the ground noise. One speaks here of a noisy ECG. The cause is either a source of
interference (e.g., a fluorescent lamp, a defective charger on a notebook) or an insufficient electrical
conductivity on the electrodes. To eliminate this, remove the source of interference (turn off the lamp, unplug
the charger from the notebook) and place the moistened electrode paper under the clips.
13
Documentation for HRV-Scanner V 5.02 - copyright 2020 by BioSign GmbHA good pulse wave should look like this. The signal is similar to a sine wave. The zero line is clearly visible. The
large vibrations correspond to the blood volume flow through the blood vessels. The blue vertical lines mark a
detected heartbeat.
Here is an example of a bad pulse wave. The signal is very small and the individual volume pulses cannot be
detected exactly. The ear clip should be positioned at a different location on the earlobe or to the other earlobe.
It may also be helpful to rub the earlobe slightly before applying the ear clip to increase blood flow.
Here is an example of a pulse signal, which was shaken by movement of the subject. To avoid this, the subject
should always keep the head calm during biofeedback/measurement. It also helps, when the cable with the
silver clip is fixed at the shirt collar.
14
Documentation for HRV-Scanner V 5.02 - copyright 2020 by BioSign GmbHNotes on improving data quality during analysis
The registration of heart rate variability (HRV) provides valuable information about the state of the autonomous
regulation. However, a requirement is a very high quality of the measurement, e.g. a very clean detection of
the heart rate curve. There is hardly a medical method that is as sensitive to disturbances and artefacts as the
HRV analysis. Even a single artefact in a 5 minute short term HRV may corrupt certain HRV parameters (e.g.,
RMSSD) by more than 100%.
For this reason, the accurate control of the heart rate curve and, if necessary, careful removal of all artefacts is
the basis for a valid HRV evaluation. The following procedure has proved successful:
Step 1: Visual control of heart rate curve and biosignal
Step 2: Optimal automatic determination of the heartbeat in the biosignal
Step 3: Manual editing in biosignal
Step 4: Graphic filtering
Step 5: Adjust plausibility check and heart rate filters
Step 1: Visual control of heart rate curve and biosignal
Both in the ECG and in the pulse wave signal, the heartbeat leads to characteristic signal fluctuations, which
allow an accurate time determination of the heart activity. In the ECG, it is the R-wave, in the pulse wave the
beginning of the steep rise
The HRV-Scanner indicates detected R-waves or detected pulse waves by a small orange (ECG) and blue
(pulse wave) circle (see figure). It is recommended to scale some areas and confirm the correct position of the
marks visually. You can scale by simply dragging a frame, with the left mouse button pressed, around the area
of interest. The original scale can be restored by pressing the following buttons:
15
Documentation for HRV-Scanner V 5.02 - copyright 2020 by BioSign GmbHIf the marks are incorrectly flagged, this leads to sudden jumps of the heart rate trace, which can be easily
detected visually (see figure).
Step 2: Optimal automatic determination of the heartbeat in the biosignal
When the marks are systematically wrong or missing, re-running the automatic detection of heartbeats might
fix the problem. Observe the lower figure: you will see that in addition to the correct detected R-wave, the T-
waves have also been flagged.
This results in a wrong heart rate of over 200 beats per minute! Obviously, the sensitivity of automatic
heartbeat detection is set too high. To change the sensitivity, you can adjust the settings for signal size and
sensitivity (see picture).
Change the settings for the biosignal you want to edit here. The ECG auto detection is activated by default. If
this does not provide a satisfactory result, you should disable auto detection and manually adjust the
amplification and QRS sensitivity settings.
16
Documentation for HRV-Scanner V 5.02 - copyright 2020 by BioSign GmbHNote: You must press the button with the magnifying glass symbol in order to run a complete re-analysis of the heartbeats with the changed settings! Check the result visually and repeat the procedure, if necessary, until you cannot improve the quality of the data in this way. In this case, go to the next step and work out the remaining artefacts manually. Step 3: Manual editing in biosignal For shorter measurements (
Such    jumps     should   always   be   a   reason   to  look   more   closely   at   the   corresponding
biosignal. Press the left mouse button and drag a frame around the jump in heart rate to scale the diagram
(see figure).

Now double-click on the point of interest . It doesn't matter whether you click in the biosignal diagram or in
heart rate diagram. The double click starts the biosignal editor.

With the biosignal editor you can set and delete marks manually. Use the arrow buttons to move through the
signal, until the vertical line in the middle is aligned with the point of interest. In the example above the T-wave
is obviously marked as heartbeat. Here we have scrolled through the signal until we reached the incorrect mark
(see figure).

                                                        18
                       Documentation for HRV-Scanner V 5.02 - copyright 2020 by BioSign GmbH
If the centre line is over a marked beat the “Delete beat” button will be enabled. Press this button to remove
the mark. The artefact is now cleared.
The second artefact, with the downward deflection, can be solved in the same manner. Scale the area of
interest and start the editor (see figure).
19
Documentation for HRV-Scanner V 5.02 - copyright 2020 by BioSign GmbHUnlike the first example, we see here a more or less confused signal without any marks. It is impossible to
detect the R-waves reliably. This explains the apparent downward jump: the time interval between the last
detected R-wave before the disturbance and the first detected R-wave after it is several seconds long. This gap
translates into a very low heart rate (remember: the heart rate of a single pair of heartbeats is computed by
the formula 60 divided by the inter-beat interval, in seconds). In order to remove this kind of an artefact we
insert a ”break” somewhere inside the signal disturbance. A “break” instructs HRV-Scanner not to calculate a
heart rate for this time interval.
Now look at the diagrams. You can see the break is marked by a vertical line in the signal diagram. In the heart
rate trace a dotted line indicates the break area. There is also a fine grey line, which signals how the heart rate
trace would have looked without correction.
20
Documentation for HRV-Scanner V 5.02 - copyright 2020 by BioSign GmbHWith these two manual editing steps of all of this measurement’s quality problems can be corrected. The test is
now ready for computing the HRV parameters.
Note: An artefact caused by a signal disturbance is not always the reason for sudden jumps of the heart rate. It
might also be the case that the biosignal is correctly recorded, and the marks are all on the right positions. In
this case the presence of the jumps may indicate an arrhythmia. It is not unusual to find occasional ectopic
beats, which can be treated as artefacts. If the arrhythmia is too frequent, the HRV measurement becomes less
reliable. In the case of atrial fibrillation, for instance, the HRV measurement is of no value.
Step 4: Graphic filtering
Graphic filtering
A HRV analysis should only include heartbeats that are under
the control of the vegetative nervous system. Heartbeats that
occur as a result of rhythmic disturbances distort HRV and
usually lead to excessive HRV values, which can be
mistakenly misinterpreted as a well-functioning
neurovegetative regulation. A good way to separate "good"
from "bad" heartbeats is to use the Poincare diagram.
Neuroregulation-induced heartbeats are arranged along the
bisector lines in the Poincare diagram, whereas heartbeats
due to rhythm disturbances have an irregular pattern.
21
Documentation for HRV-Scanner V 5.02 - copyright 2020 by BioSign GmbHExample:
There have been some irregular heartbeats in
the heart rate pattern, so-called extra-systoles,
recognizable by the sudden changes in heart
rate (red mark).
In the corresponding Poincare diagram the irregular heartbeats can be seen even more clearly:
Heartbeats as a result of vegetative regulation arrange
themselves as point cloud along the bisector (green ellipse).
Irregular heartbeats differ from this distribution pattern and can
easily be identified (red circles). The special feature of the
Poincare diagram, to distinguish regular from irregular
heartbeats, allows for optimal filtering of the heart rate.
Poincare based filtering
To remove the irregular heartbeats,
simply drag an ellipse around the point
cloud that is formed by the regular
heartbeats.
Click the "Exclude" button to remove all
heartbeats outside the ellipse.
With the "Include" switch, you can
record heartbeats back into the HRV
analysis if accidentally excluded regular
heartbeats.
Note: "Auto-Filter" takes the drawing of the ellipse and automatically calculates which heartbeats should be
marked as artefacts and excluded during the evaluation. "Include All" causes an undoing of the graphic filter.
22
Documentation for HRV-Scanner V 5.02 - copyright 2020 by BioSign GmbHStep 5: Adjust plausibility check and heart rate filters
For longer measurements, it may be very time-consuming to process each individual artefact manually. For
example, the following measurement contains numerous artefacts in approximately 30 minutes of
measurement time.
Since this is an import of a RR interval based measurement, there is no biosignal in which the automatic
heartbeat detection could be optimized (as described in step 1). In the case of shaky measurements with poor
signal quality, such heart rate sequences can also be obtained, even with optimized heart rate detection.
It is recommended to adjust the plausibility check of the HRV-Scanner.
Because the heart rate fluctuates between 90 and 55 in the example, a very good result is already achieved
with plausibility values of 50/100.
23
Documentation for HRV-Scanner V 5.02 - copyright 2020 by BioSign GmbHFor the changed settings to take effect, press the Recalculate Heart Rate button.
As can be seen in the picture, the adaptation of the plausibility check has already been sufficient in the example
in order to produce a good data quality.
What happens during plausibility checks? In the plausibility check, the HRV-Scanner compares for each interval
between two heartbeats whether the resulting heart rate is above or below the set limit values. If this is the
case, the HRV-Scanner sets a "break" in this RR interval. "Breaks" we already know from step 2, they prevent
the calculation of the heart rate from a RR interval provided with a "break".
Note: If artefacts persist despite the plausibility check, these can be corrected manually (see step 2).
24
Documentation for HRV-Scanner V 5.02 - copyright 2020 by BioSign GmbHLimits of HRV determination
Heart rate variability, as the name implies, determines the variability of the heartbeat. This means that all kinds
of artefacts (wobbling in the ECG due to movement, interference signals, ...) and heart rhythm disturbances
(irregular heart beats, atrial fibrillation, ...) lead to an increased HRV. However, since this regulation does not
come from the sinus node innervated by the parasympathetic nervous system, we cannot evaluate such heart
rate profiles without first removing all artefacts and all heartbeats not from the sinus rhythm (excitation from
the sinus node and not from accessory pacemaker cells).
Example 1: many irregular heart beats (marked in orange)
This shows the high variability in the heart rate curve due to the almost regularly occurring irregular heart
beats (3 normal QRS complexes as signs of excitation from the sinus node, then always an irregular heart beats
with compensatory pause afterwards).
The heart rate after automatic filtering in the Poincaré filter. After exclusion of the irregular heart beats (pink
dyed), approximately 50% of the heart rate (green) remain for the evaluation. For a 5 minute Short-Term HRV
measurement, this is just sufficient to determine the HRV.
25
Documentation for HRV-Scanner V 5.02 - copyright 2020 by BioSign GmbHExample 2: Atrial fibrillation
At first glance, a regular ECG is available. One would assume here only one extra heart beat. However, a very
disordered rhythm is observed when the heart rate curve is considered. This can be seen in the present atrial
fibrillation. In the ECG, the missing P-waves are also seen as a sign of a non-regular atrial innervations.
The heart rate after automatic filtering in the Poincaré filter. After exclusion of the irregular heart beats (pink
dyed), nothing of the original heart rate curve remains for the evaluation. Thus, a determination of the HRV is
not possible or useful in the case of present atrial fibrillation.
The detection of such rhythm disturbances often requires some experience. If you have any doubts, please feel
free to use our support.
A good quality ECG is always important for a reliable analysis. Only with this it is possible to get a more
detailed picture of the present rhythm disturbances. This is not possible either with the pulse wave or with an
RR distance-based HRV measurement (chest belt without ECG).
26
Documentation for HRV-Scanner V 5.02 - copyright 2020 by BioSign GmbHHRV concept "Tone, Flexibility, Dynamics"
The concept in the HRV-Scanner "Tone, Flexibility, Dynamics" should help to structure the confusing
amount of HRV parameters. It also facilitates evaluation and interpretation later on, and thus helps to better
understand HRV measurements.
If you are dealing with a large number of variables
that give a rather confusing picture in their entirety,
it makes sense to reduce the large number of
variables to a few, which are the central components
of the data set.
Such a data reduction can be achieved by means of
factor analysis, which searches for the underlying
factors in a pool of many variables and groups the
individual variables according to their contribution to
the respective main factor.
We applied such a factor analysis to the HRV
measurements of more than 1000 people and found
that the many HRV parameters can be reduced to
essentially three main factors, which we will take a
closer look at below.
Let's start with the factor on the right in the table. As you can see, it essentially describes the heart rate, since
only the two parameters heart rate and mean RR distance, i.e. the distance between two heartbeats in
milliseconds, contribute to this factor. We call this factor "Tone" because it describes, so to speak, the basic
tone of the autonomic nervous system with which cardiovascular regulation takes place.
The second factor groups parameters that are primarily related to the rate of change, i.e. the dynamics of the
heart rate curve. The ratio of slow heart rate changes to fast changes in heart rate, the SD2 to SD1 quotient, as
well as the autocorrelation coefficient and the alpha1 value of the detrended fluctuation analysis, which also
express how high the proportion of rapid changes in the Heart rate is. The SD1 value itself, that is, the mean
change in heart rate from heartbeat to heartbeat, also has a comparatively high factor of 2. For short
measurements, such as the one-minute determination of respiratory sinus arrhythmia, the RMSSD value is
often used instead of SD1 . However, RMSSD and SD1 both express the same thing, namely how the heart rate
changes from one beat to the next and differ only in their amount. They can also be easily converted into one
another.
Similar to SD1 and SD2, the power values are calculated using a spectral analysis. The Power HF is comparable
to the SD1 and RMSSD, and the LF / HF ratio, similar to the SD2 to SD1 quotient, expresses whether the heart
rate curve is composed of slow or fast changes in the heart rate. Overall, our second main component obviously
has a lot to do with dynamics, which is why we gave the underlying factor the name "Dynamics".
Now let's look at the first factor. We see that those parameters have a high impact on this factor, which
express the amplitude of the heart rate changes, such as the standard deviation SDNN, the coefficient of
variation or the total power. The parameters that primarily quantify slow changes in heart rate, such as SD2
and low frequency power, can also be assigned to factor 1. So factor 1 obviously evaluates the amplitude of the
heart rate change. We have therefore chosen the term "Flexibility" for this factor. The flexibility expresses the
adaptability of our cardiovascular system and describes the actual range of heart rate changes when
disturbances to the inner homeostasis occur.
27
Documentation for HRV-Scanner V 5.02 - copyright 2020 by BioSign GmbHYou can also read