The GINSENG System for Wireless Monitoring and Control: Design and Deployment Experiences
←
→
Page content transcription
If your browser does not render page correctly, please read the page content below
The GINSENG System for Wireless Monitoring
and Control: Design and Deployment Experiences
TONY O’DONOVAN
University College Cork
JAMES BROWN
Lancaster University
FELIX BÜSCHING
Technische Universität Braunschweig
ALBERTO CARDOSO and JOSÉ CECÍLIO
University of Coimbra
JOSE DO Ó
Petrogal, S.A.
PEDRO FURTADO and PAULO GIL
University of Coimbra
ANJA JUGEL
SAP AG
WOLF-BASTIAN PÖTTNER
Technische Universität Braunschweig
UTZ ROEDIG
Lancaster University
JORGE SÁ SILVA and RICARDO SILVA
University of Coimbra
CORMAC J. SREENAN
University College Cork
VASOS VASSILIOU
University of Cyprus
THIEMO VOIGT
Swedish Institute of Computer Science
LARS WOLF
Technische Universität Braunschweig
ZINON ZINONOS
University of Cyprus

Contact author’s address: C.J. Sreenan, Dept. of Computer Science, University College Cork,
Ireland.

Permission to make digital/hard copy of all or part of this material without fee for personal
or classroom use provided that the copies are not made or distributed for profit or commercial
advantage, the ACM copyright/server notice, the title of the publication, and its date appear, and
notice is given that copying is by permission of the ACM, Inc. To copy otherwise, to republish,
to post on servers, or to redistribute to lists requires prior specific permission and/or a fee.
 c 20XX ACM 1529-3785/20XX/0700-0111 $5.00

                          ACM Transactions on Sensor Networks, Vol. X, No. X, XX 20XX, Pages 111–154.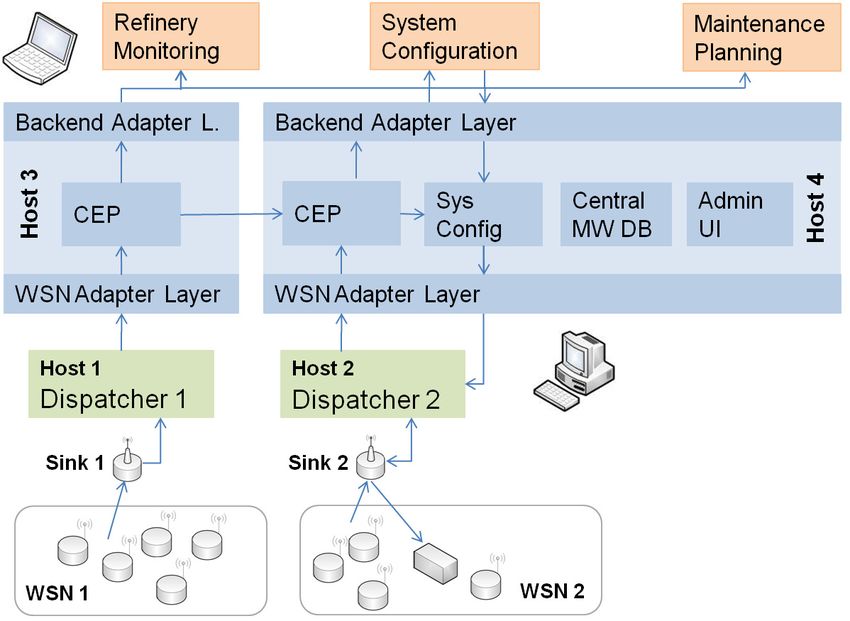
112      ·     Tony O’Donovan et. al.

Today’s industrial facilities such as oil refineries, chemical plants, and factories rely on wired sensor
systems to monitor and control the production processes. The deployment and maintenance of
such cabled systems is expensive and inflexible. It is, therefore, desirable to replace or augment
these systems using wireless technology, which requires us to overcome significant technical chal-
lenges. Process automation and control applications are mission-critical and require timely and
reliable data delivery, which is difficult to provide in industrial environments with harsh radio
environments. In this paper we present the GINSENG system which implements performance
control to allow us to use wireless sensor networks for mission-critical applications in industrial
environments. GINSENG is a complete system solution that comprises on-node system software,
network protocols, and back-end systems with sophisticated data processing capability. GIN-
SENG assumes that a deployment can be carefully planned. A TDMA-based MAC protocol,
tailored to the deployment environment is employed to provide reliable and timely data delivery.
Performance debugging components are used to unintrusively monitor the system performance
and identify problems as they occur. The paper reports on a real-world deployment of GINSENG
in an especially challenging environment of an operational oil refinery in Sines, Portugal. We
provide experimental results from this deployment and share the experiences gained. These re-
sults demonstate the use of GINSENG for sensing and actuation and allow an assessment of its
ability to operate within the required performance bounds. We also identify shortcomings that
manifested during the evaluation phase, thus giving a useful perspective on the challenges that
have to be overcome in these harsh application settings.
Categories and Subject Descriptors: C.4 [Computer Systems Organization]: Performance
of Systems—Reliability, availability, and serviceability; C.3 [Computer Systems Organiza-
tion]: Special-purpose and application-based systems—Real-time and embedded systems; C.2.0
[Computer Systems Organization]: Computer-communication networks—General
General Terms: Design, Experimentation, Performance, Reliability
Additional Key Words and Phrases: Oil refinery, Monitoring, Performance Control, Wireless
Sensor Network

1.    INTRODUCTION
Automation and control are fundamental tasks in industrial environments. Today
these are mainly based on wired analog communication, with most industries being
heavily automated. Cabled sensors are used for monitoring and communication of
sensor readings to a control room in which software is used for closed-loop control,
to raise alarms or for simple process observation. These operational systems are
proven to be efficient and reliable and are used even in the most critical scenarios
such as nuclear power industries and oil refineries. However, they present some
highly significant drawbacks regarding deployment and reconfiguration.
   The deployment of an entire system is very costly as it requires the installation
of thousands of cables which must comply with industry-specific regulatory stan-
dards. Further costs accumulate as the installation needs to be protected which
often requires the laying of cables underground. This severely limits installation
flexibility, making it very difficult to reconfigure the system should that be necessary
to accommodate new production processes.
   A wireless solution seems highly desirable to overcome the outlined limitations.
Wireless Sensor Networks (WSNs) are, in principle, the closest technology to offer
such an alternative. Nodes are readily deployed and system reconfiguration can
ACM Transactions on Sensor Networks, Vol. X, No. X, XX 20XX.
The GINSENG System for Wireless Monitoring and Control: Design and Deployment Experiences     ·   113

be carried out easily. The focus of WSN deployments in the research literature
has been on applications which are non-critical in terms of performance, such as
animal habitat or environmental monitoring. Various aspects of performance con-
trol for WSNs have been addressed, such as for real-time medium access control
and routing, but there is a lack of systems that offer performance assurances with
backend support and combine low energy consumption, high packet delivery rate
and closed-loop actuation. Consequently, and with some justification, industry has
shown a marked reluctance to embrace WSNs for mission-critical settings.
   In the recent past, several standards have become available that enable the
use of wireless communication to connect industrial devices to control systems,
mainly targeting remote equipment monitoring. Perhaps the most well-known is
WirelessHART, which was approved as a standard by the International Electrotech-
nical Commission (IEC) in April 2010. In Section 6 we discuss WirelessHART and
related systems in detail, providing a qualitative comparison with our work. Un-
fortunately, there appear to be no independent peer-reviewed publications that
evaluate the performance of these offerings in a real industrial deployment, and
in addition, many key features that affect performance are not specified in the
standards but left to individual vendors to implement. Furthermore, there are
key differences in the scope of these systems, such that, while these address many
key issues for wireless monitoring, our GINSENG solution stands alone as offer-
ing a complete solution that includes not just the network protocols and system
software, but also encompassing performance debugging and tight integration with
industry-grade middleware for complex event management.
   Our solution, GINSENG, stems from a multi-partner FP7 European project led
by University College Cork in which a performance controlled WSN has been de-
signed and evaluated. The current deployment is at the Petrogal oil refinery, lo-
cated at Sines, Portugal. This is the largest refinery in the Iberian peninsula and
stands among the largest in Europe. The Petrogal refinery is today completely
automated, but totally based on wired systems. Upgrades to the sensor/actuator
system are frequently needed, but sometimes they are impossible to perform or
extremely expensive. Therefore, within the scope of the GINSENG project and to
directly answer the needs of Petrogal, a real WSN has been deployed in the refinery.
We have studied and developed this network to assure the desired controlled per-
formance and consequently the desired reliability. To meet these requirements, we
performed several in-field evaluations. The results allowed us to assess the ability of
GINSENG to operate within the required performance bounds for sensing and ac-
tuation, and to identify shortcomings that manifested during the evaluation phase,
thus giving a useful perspective on the challenges that have to be overcome in these
harsh application settings. Furthermore, the experiments show that the GINSENG
system is able to provide performance debugging information which is necessary to
detect reliably problems and to provide data for system reconfiguration.
  Unlike most papers that report on wireless sensor network deployments, a special
aspect of our work is the opportunity to deploy in a real industrial environment and
use it to conduct on-site experiments. Towards this end, we make three key contri-
butions. The first contribution is to present the GINSENG system as an end-to-end
solution for industrial monitoring and control, highlighting the novel features of the
                               ACM Transactions on Sensor Networks, Vol. X, No. X, XX 20XX.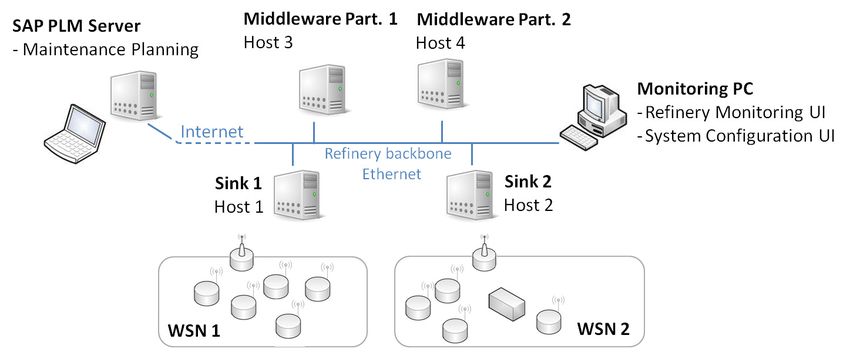
114     ·    Tony O’Donovan et. al.

design. By end-to-end we mean that it encompasses the backend software (middle-
ware and applications) in addition to protocol and system software. The second
contribution is to detail a real and challenging industrial application scenario and
our experiences in physically deploying the GINSENG system in that context. The
industrial setting we chose is deeply challenging, involving electromagnetic inter-
ference, obstacles to radio communication, explosive atmosphere, and difficulties
in physical access due to site security. The third contribution is to leverage that
deployment to gather valuable results from on-site experiments and analyse the
system performance. Our results show that our system is highly successful in that
it combines sensing and closed-loop actuation, high packet delivery rates, and low
energy consumption.
   The remainder of this paper is organised as follows. The next section specifies
the problem definition and sets the overall context by discussing the application
scenarios. Section 3 presents the GINSENG system architecture and details the key
elements of the system design. Section 4 describes the deployment of the complete
solution at an operational oil refinery, while Section 5 presents the experimental
results and analysis. Section 6 provides a summary and comparison with related
work, Section 7 offers key lessons from the deployment, and Section 8 concludes
the paper.

2.    APPLICATION SCENARIOS AND PROBLEM DEFINITION
The Petrogal oil refinery is a complex industrial facility that includes a wide range
of processes requiring careful monitoring and control of operations. There are cur-
rently 35, 000 sensors and actuators in use in the refinery to perform monitoring
of industrial operations such as leakage detection, measurement of pressure in the
pipes, the temperature of burners, and fluid levels of tanks. Sensor sampling periods
are generally in the order of a few seconds, with 3 s being a typical and acceptable
value. The system tolerates a few missing sampling points without causing prob-
lems. Such failures are indicated and maintenance for the sensor is scheduled. For
most sensors, set-point values can be defined that, when exceeded, trigger alarms to
be handled by control room operators. Some sensors are part of automated control
loops where actuators react automatically to sensor input. In practice it is usually
the case that such sensors and actuators are located in close proximity because the
points of observation and reaction are coincident.
   Figure 1 illustrates the current situation at the refinery where each of the sensors
is terminated in a wiring closet in a control building. In the long term, the ability to
replace most of these wired links with wireless has a multitude of benefits, including
cost reduction, increased flexibility in plant reconfiguration, and simplified control
room infrastructure.
2.1   Monitoring and Control System
The operations in place at the refinery utilise three systems for the monitoring and
control of the plant: the indicatory system, the semi-automatic control system,
and the automatic control system. Although this section describes the oil refinery
monitoring and control system, the three classifications of systems mentioned above
apply to any industrial plant. All plants have indicatory, semi-automatic control,
and automatic control systems and should have similar requirements as the systems
ACM Transactions on Sensor Networks, Vol. X, No. X, XX 20XX.
The GINSENG System for Wireless Monitoring and Control: Design and Deployment Experiences     ·   115

                        Fig. 1: I/O Cabinets and Wiring cabinet.

in the refinery. Therefore, it should be possible to apply the solutions found for
these scenarios to the more general cases.
   The indicatory system is used purely to provide the control centre with infor-
mation about the status and faults of equipment and generic aspects of the envi-
ronment. Within this system, information flows one way from the in-field sensors
to the control centre. It is assumed that data from sensors needs to arrive to the
control centre within a given time frame and with a given reliability. Reliability
and delay bounds in the indicatory system are not as strict as they are in the two
systems described next. Some delay between measurement and display of infor-
mation in the control centre is acceptable. According to the refinery requirements
acceptable values are delays of 3 s and a transmission reliability of 99 %.
   The semi-automatic control system is used to control different aspects of the
refinery. This system is similar to the previously described indicatory system but
includes actuators as well and information flows in both directions: from in-field
sensors to the control centre, and from the control centre to actuators. Upon data
arrival from sensors an operator may decide to send commands to in-field actuators.
Operators require instant feedback from sensors as actuators are used to modify
aspects of the environment. The same requirements that applied to the indicatory
system exist for this type of system as well, with the exception that it applies both
to upstream and downstream data.
   The automatic control system is used to deploy automated control loops within
the refinery. The system is similar to the previously described semi-automatic
control system but commands to actuators are sent automatically (by the control
system and not after operator intervention) upon receiving sensor data. Sensors
and actuators in this system are part of an automated closed loop system. However,
operators may be allowed to set parameters which influence the decision process.
For example, an operator might configure a control loop such that a valve closes
if pressure above an operator-defined threshold is measured. In this system it
is extremely important that data arrives at its intended destination in a timely
and reliable manner. Therefore, the required delay is significantly lower than the
indicatory and semi-automatic cases; round-trip delays of 2 s (1 s one-way delay
instead of 3 s) are typical values.
   In the following subsections we describe two refinery operation scenarios in more
                               ACM Transactions on Sensor Networks, Vol. X, No. X, XX 20XX.
116    ·     Tony O’Donovan et. al.

detail to better illustrate the system requirements. The first scenario describes a
production monitoring scenario while the second describes a production monitoring
and control scenario. The first example uses the indicatory system while the second
one requires the semi-automatic control system. The second example may use
elements of the automatic control system in cases where control is configured to
run without human intervention.
2.2   Example 1: Production Monitoring
This application scenario is an example of an indicatory system. Figure 2 shows a
small section of the plant that has a number of pipes that contain materials that
are pumped into a storage tank. In this scenario, sensors of two different types are
used to provide information to the control centre staff:
—Pressure is monitored within each pipe not only for safety reasons to keep pipe
 pressure within pipe tolerances, but also to detect leakage. Pressure is usually
 measured in Pascal (Pa). A typical pressure sensor has a Pmin and Pmax using
 32 bits as sample size. Pressure is typically sampled every second.
—Flow is monitored within each pipe to determine the rate at which product is
 flowing. Flow is measured in m3 /h every second using 32 bits as sample size.
—Level is monitored within storage tanks. Levels are measured in m every second
 using 32 bits as sample size.
   In this scenario all sensors are in close proximity (less than 50 m). However, due
to environmental conditions (a built-up environment with a lot of metal pipes) it
is expected that some nodes would have to fulfil two functions: sensing and data
forwarding. The required network lifetime, i.e. before maintenance needs to be
scheduled for changing node batteries, is at least 180 days.
2.3   Example 2: Production Monitoring and Control
This scenario is an example of the semi-automatic control system. Figure 3 shows
a small section of the refinery. The information is carried from sensors to the
control centre to allow technicians to make production-based decisions. With the
use of actuators technicians can alter aspects of production, such as the speed of
product flow, which is controlled via pumps. In addition to the sensors seen in the
previous scenario, actuators are also included that can configure pumps, mixers, or
open/close valves.
    This scenario includes three sensor types measuring temperature, pressure, and
filling levels. This information is sent to the control centre, which is monitored by
technicians. In addition to the three types of network devices seen in the previous
scenario, additional actuator devices are present. Technicians using this information
can manage production by controlling three types of plant objects via actuators.
These actuators are necessary to enable control of production. These actuators
include:
—Shut-off valves are integrated into pipes and are used to interrupt product flow
 during day-to-day operations and in the case of emergency.
—Pumps can operate at different speeds to increase or decrease the pressure and
 thus flow of product through the piping system. A 32 bit value is sufficient to set
ACM Transactions on Sensor Networks, Vol. X, No. X, XX 20XX.
The GINSENG System for Wireless Monitoring and Control: Design and Deployment Experiences                     ·   117

                                     FT

                                                                            FT                           FT
                                                                                  Line 4
                                                             PT                                   PT
             Storage          LT
              Tank
                        LT
            CE-T1A

                             FT

                                                     Sink                    Control Centre

                             Refinery Backbone Ethernet

                                                                 Key
                       FT                       PT                               LT
                                Flow                    Pressure                          Level
                             Transmitter               Transmitter                     Transmitter

                                Fig. 2: Production Monitoring Scenario.

                                                                       TT

                                                TT      PT                            LT
                  PT           VA

                                                                   Storage Tank
                                           PA   TT          PT
                  PT           VA                                                                 VA
                                                                                           PT
                                                                       CE-T1A
                                                             LT
                                           PA

                                                                       MA

                                                            In-Field Sink
                                                                            Refinery Backbone Ethernet

                                                              Key
                       PT                       TT                               LT
                             Pressure                    Pressure                         Level
                            Transmitter                 Transmitter                    Transmitter
                       VA                       PA                               MA
                              Valve                          Pump                           Mixer
                             Actuator                       Actuator                       Actuator

                                    Fig. 3: Production Control Scenario.

                                           ACM Transactions on Sensor Networks, Vol. X, No. X, XX 20XX.
118 · Tony O’Donovan et. al.
pump speed.
—Mixing Tanks can blend together products. When mixing is enabled the contents
of the tank is blended and forced out into the output pipe for continued processing
at another location. Actuators control the speed at which the mixers operate. A
32 bit value is used to set mixing parameters.
As described at the beginning of this section, commands need to reach an actuator
within 3s and with a reliability of 99 %. Again, in this scenario all sensors are in
close proximity (less than 50 m) and connection points to the refinery backbone
are available. The expected network lifetime is also at least 180 days.
3. GINSENG SYSTEM ARCHITECTURE AND DESIGN
The GINSENG system assumes that sensors and actuators can be organised in
relatively small wireless sensor networks which are connected to a wired backbone
infrastructure. It is assumed that highly performance-critical communication (i.e.
for control loops) is executed within a WSN and only communication with more re-
laxed performance requirements (i.e. for control room monitoring; for control loops
with slow cycles) extends into the backbone infrastructure. The GINSENG system
architecture follows these structural assumptions which allows us to provide a sys-
tem with the objective of assuring strict performance. These assumptions generally
fit production process configurations very well. Sensors and associated actuators
that are part of a tightly controlled production process are often found in close
proximity of each other (See Section 2). Furthermore, a dedicated wired backbone
infrastructure which connects production areas and contains central elements such
as the control room is generally present in larger facilities.
The GINSENG system uses a distributed middleware to facilitate application
data exchange among nodes in different wireless clusters and backend services.
Furthermore, the middleware provides a uniform Application Programming Inter-
face (API) for:
(1) implementing data monitoring and control loops;
(2) attaching user interfaces (e.g. to implement control room functionality);
(3) adding data storage (e.g. to implement data logging);
(4) adding external systems (e.g. maintenance management and supply chain man-
agement).
GINSENG communication in the backbone network assumes a network that is
able to provide deterministic performance, i.e. the network is able to give bounds
on data transport delay and reliability. In practice, a sufficiently provisioned best
effort network fulfils this requirement for most application cases (as we will show
in Section 5). GINSENG communication in the WSNs is based on a Time Division
Multiple Access (TDMA)-based Medium Access Control (MAC) protocol, called
GinMAC that provides strict bounds for message transport reliability and delay. A
number of additional modules that must work alongside a MAC aiming at provid-
ing performance guarantees are tightly integrated with GinMAC. These include,
for example, topology control, queue management, and performance debugging fa-
cilities.
ACM Transactions on Sensor Networks, Vol. X, No. X, XX 20XX.The GINSENG System for Wireless Monitoring and Control: Design and Deployment Experiences · 119
GINSENG applications running on sensor/actuator nodes and middleware com-
ponents involved in processing performance-critical messages are designed to pro-
vide bounds on processing times. Thus, given bounds provided by GinMAC or the
backbone network (if involved in the communication path) it is possible to imple-
ment a system that provides performance assurances. The adherence to strict delay
and reliability requirements is essential in the context of process automation and
control as it is a requirement for critical monitoring tasks and, in particular, control
loop implementation.
The GINSENG system monitors message timing in each part of the system.
When a time bound is exceeded an alarm is generated and a control engineer is
informed to take action. An interface for the specification of desired latency bounds
concerning processing and delivery in the WSN and backbone is provided. Latency
information is collected within messages as they travel through the system. When
the messages arrive at the middleware the information is evaluated against defined
bounds.
3.1 GINSENG System Components
A GINSENG system employs a number of software components which are located
either on nodes deployed in wireless clusters or on standard server systems within
the backend infrastructure. The next paragraphs describe the main components of
a GINSENG system. The system architecture is shown in Figure 4.
Config. Monitor Backend
Application Application Applications
GinSysInt GinSink GinApp GinFDS
GINSENG Node Platform
Data transfer between WSN and Application Application Fault
Middleware and WSN
Interface between
backend applications. process sink. process. diagnostics.
Middleware
Dispatcher
Config. API GinQueue GinTop GinPerf
GinSysMon Queue Topology Performance
Middleware Management. control. monitoring.
GinSysConf
Configuration performance
of node monitoring. GinSysMon
components. Middleware performance monitoring.
Fig. 4: GINSENG System Components.
GINSENG Middleware. The GINSENG system uses a middleware to facilitate
application data exchange among sensors and actuators in different WSNs and
among backend services. To scale for large industrial scenarios, the middleware
design enables the distributed deployment of the following components.
GinSysInt - The System Integration component facilitates data transfer between
WSNs and backend applications. Measurement data from sensors and additional di-
agnosis data (such as wireless network performance monitoring data) is fed into the
middleware, pre-processed and forwarded to all subscribed consuming applications.
Further, actuation commands and configuration data for sensors and actuators in
WSNs are passed from the middleware to WSNs.
ACM Transactions on Sensor Networks, Vol. X, No. X, XX 20XX.120 · Tony O’Donovan et. al. GinSysMon - The Performance Monitoring continuously controls the performance of the middleware during runtime. It extends and applies the data quality metrics and algebra presented in [Klein and Lehner 2009b] towards the GINSENG applica- tion scenarios. Secondly, whenever it detects a quality decrease or a user triggers a quality optimisation with regard to a specific performance metric, the Performance Monitoring component starts the quality-driven optimisation of the sensor stream processing [Klein and Lehner 2009a]. Finally, the performance monitoring enables the performance-driven load shedding [Klein et al. 2009] to avoid middleware over- load situations and enable reliable data processing. Essentially, this middleware element ensures that processing delays stay within required bounds. GinSysConf - The System Configuration enables the definition of commands that configure the data gathering and actuation via GinApp and GinSink, as well as the configuration of agents in the GinFDS (all described next). Such commands can be either defined manually by users or are automatically generated by backend applications for production control. The System Configuration component provides the Config API that exposes all configuration services to external applications, e.g., for user-defined commands, and interprets the user-input and derives appropriate command message(s) to be sent to all relevant nodes. A key feature is the ability to select one or more data sources to be used as input to actuation decisions. Dispatcher - Data is forwarded from a sink node to the Dispatcher software located on a host in the backbone which then feeds data into the middleware. Likewise, data is transmitted via the Dispatcher into a WSN. The Dispatcher em- ploys flow control mechanisms to avoid interfering with the strict TDMA schedule of the sink node. Furthermore, reliable communication is ensured by using Cy- cling Redundancy Checking (CRC) checksums, acknowledgements, and automatic retransmissions. The current implementation uses a USB/serial connection between sink node and PC, whereas a GINSENG system in full production would integrate the function- ality of the sink node and Dispatcher within an embedded system. GINSENG Node Platform. Sensor and actuator nodes are implemented using the popular Contiki operating system. Each node uses a TDMA based MAC protocol called GinMAC as the underlying communication protocol which ensures timely and reliable data delivery. A number of additional modules required in a perfor- mance controlled network are tightly integrated with GinMAC. These components are: topology control (GinTop), queue management (GinQueue) and performance debugging (GinPerf). GinMAC - GinMAC is a single channel TDMA protocol which uses exclusive slots for data transmission. Neighbouring wireless clusters are required to use different transmission channels in order to prevent collisions. GinMAC provides redundant slots to compensate for potential packet losses. GinMAC accepts packets from the upper layers (e.g. GinApp and GinSink), which are queued and then transmitted by the radio at the appropriate time. GinTop - A GINSENG system uses a tree topology envelope specified before network deployment for network organisation. GinTop is responsible for assigning nodes to a position in the logical network topology such that the resulting topology fits within the provisioned topology envelope. ACM Transactions on Sensor Networks, Vol. X, No. X, XX 20XX.
The GINSENG System for Wireless Monitoring and Control: Design and Deployment Experiences     ·   121

   GinQueue - GinQueue is called by GinMAC for packet scheduling decisions. Sen-
sor data and actuator data is queued with high priority while other data such as
configuration data or performance debugging data is queued with low priority.
   GinPerf - GinPerf is used to monitor the performance of the wireless networks.
It is used to collect performance related information on nodes, to process this data
and to forward processing results and raw information to the middleware via the
sink node where it can be further analysed and combined with data from other
WSNs.
   GinApp - Each node in a WSN carries this component which is responsible to
poll periodically sensor data and/or to initiate actuation if required. GinApp can
be configured (e.g. polling frequency, actuation parameters, etc.) using the Config
API offered by the GinSysConf component. For example, sensor and actuator
behaviour can be configured via a control centre using the Config API provided by
the GinSysConf component.
   GinFDS - The Fault Diagnosis and Supervision component is based on a multi-
agent hierarchical architecture, located at node level, in order to guarantee the
quality of the acquired data and fault tolerance in closed-loop control systems. Each
agent is configurable and is responsible for specific tasks, such as, monitoring sensors
readings, outliers filtering, and handling communication faults (in the forward link)
on the control system.
   GinSink - The sink node in a wireless cluster carries this component which has
two functions. Firstly, GinSink is the bridge between wireless cluster and backbone
infrastructure. GinSink is used to pass received messages from the wireless network
to the backbone infrastructure. Secondly, GinSink can be used to implement con-
trol functionality. Incoming sensor messages can be processed and messages with
actuation commands can be generated as a result, which are then distributed to
actuators within the wireless cluster. GinSink can be configured, for example, to
set forwarding filters and control loop parameters.
3.2   The GINSENG Data Path
The GinApp process running on the sensor nodes reads and pre-processes sensor
data and then decides if data must be forwarded. In addition, the GinFDS compo-
nent may be used to perform outlier detection to ensure data quality (more details
on outlier detection will be given in Section 5). All data is routed via the sink node
in a WSN as this is a property of the employed GinMAC protocol.
   A task on the sink node then processes the data and may, as a result, generate
commands to be sent to actuators within the same wireless cluster. Alternatively,
the data may be forwarded by the sink node to a system in the backbone infras-
tructure. Data is forwarded from the sink node via USB/serial connection to the
Dispatcher software which then forwards data to systems in the backbone. A combi-
nation is as well possible whereby data is forwarded to the backbone infrastructure
while command messages for actuators in the WSN are generated. In particular the
last option allows us to implement control loops with strict performance require-
ments while monitoring messages travelling through the backbone infrastructure
may have more relaxed performance requirements.
   Middleware components in the backbone are also likely to process incoming data
from sensors. In this case, input data from multiple WSNs and input from ad-
                               ACM Transactions on Sensor Networks, Vol. X, No. X, XX 20XX.
122 · Tony O’Donovan et. al. ditional sources (e.g. process/risk management servers) can be used in decision- making. Command messages for actuators located in WSNs that are closely linked to the middleware servers or for other secondary systems may be the result. Ob- viously, if control loops are constructed this way, data transport delays in the backbone infrastructure and the WSNs must be taken into account. Thus this particular approach may not be suitable for very performance critical systems. Sensor and actuator data have to be treated with priority. Other data such as system maintenance messages, debugging information, and control messages must be transported by the system without interacting negatively with application data delivery. 3.3 GINSENG Resource Provisioning In a monitoring scenario data has to be delivered within time T from the sensor nodes to the backend-application which presents the data. The time T can be broken down into the time TW required for the WSN (reading sensor data, delivering the data upstream to the sink node and forwarding this data to the middleware) and time TB required for data transport and processing in the middleware of the backend system. The GINSENG system must be designed such that for each data source the required deadline T can be met. Within each WSN the time TW is determined by the TDMA schedule length F . GinMAC is designed such that it is ensured that data from all nodes can be delivered to the backend system within this time frame. Inside the backend systems the time TB is determined by the software systems as well as the intermediate wired networks and the server hardware. 3.3.1 Backbone Infrastructure. As said, dimensioning of the backend system depends on a number of factors. Thus, a generic description of how to determine TBmax cannot be given, without assuming specific technologies for real-time net- works in the backend and real-time operating systems on the servers. More pragmatically, it is possible to put the backend systems through a load test to determine a worst-case delay for data transport and processing delays observed during the load test (see Section 5.2). While the numbers obtained in those tests are not strict delay bounds, we have observed that the maximum observed TB is at least one order of magnitude lower than TW in our system. Therefore, we do not attempt to enforce strict real-time in the backend. Due to the significant differences in the order of the measured delay we assume that the processing time in the backend TB does not increase into the same order of magnitude as the time the WSN takes to transport the data into the backend system TW for reasonable numbers of events per second. The assumption is verified by the measurements presented in the Evaluation Section 5. Furthermore, if necessary, over-provisioning of both the backend network as well as the backend servers can serve to further distance the observed delays from the acceptable delays. 3.3.2 Wireless Sensor Network. A network dimensioning process is carried out before the network is deployed. The input for the dimensioning process are network and application characteristics that are known before deployment. The output of the dimensioning process is a TDMA schedule with frame length F that each node ACM Transactions on Sensor Networks, Vol. X, No. X, XX 20XX.
The GINSENG System for Wireless Monitoring and Control: Design and Deployment Experiences                                                                              ·   123

                                                                                                                              Level 0
                                                                                                                    N-0-0-0
                                                                                                                    (SINK)

                                                                                                                              Level 1 (O=4)   Sink
                                 N-1-0-0                                                     N-2-0-0
                                                                                                                                              Possible node position

             N-1-1-0             N-1-2-0             N-1-3-0             N-2-1-0             N-2-2-0             N-2-3-0
                                                                                                                              Level 2 (O=3)   Sensor in deployment

                                                                                                                                              Actuator in deployment
                                                                                                                              Level 3 (O=2)
   N-1-1-1   N-1-1-2   N-1-2-1   N-1-2-2   N-1-3-1   N-1-3-2   N-2-1-1   N-2-1-2   N-2-2-1   N-2-2-2   N-2-3-1   N-2-3-2

                       Fig. 5: Example topology with NA = 2 actuators and NS = 10 sensors.

has to follow. The GinMAC protocol is detailed in [Suriyachai et al. 2010]. However,
to understand the evaluation presented in the next section we give a brief summary
of the protocol details here in this section.
   The GinMAC TDMA frame consists of three types of slots: basic slots, additional
slots and unused slots. First, the frame contains a number of basic slots which are
selected such that within frame length F each sensor can forward one message to
the sink and the sink can transmit one message to each actuator. Second, the
GinMAC frame uses additional slots to improve transmission reliability. Finally,
the frame may contain unused slots which are purely used to improve the duty cycle
of nodes.
   The above types of slots within the GinMAC frame must be designed such that
the delay, reliability and energy consumption requirements are met. However, it
may not always be possible to find a frame that simultaneously fulfils all three
requirements. If that is the case, some dimensioning assumptions must be relaxed.
   To determine the number of basic slots required in a GinMAC frame, a topology
envelope is assumed. This topology envelope is specified as a tree rooted at the sink
and described by the parameters: maximum hop distance H and fan-out degrees
Oh (0 ≤ h ≤ H) at each tree level h; we define O0 = 1. The topology envelope can
                                                   PH Qn
accommodate a maximum number of N max = n=1 m=1 Om nodes. However,
in the actual deployment a number of nodes N ≤ N max may be used. Nodes
in the later deployment can take any place in the network and even move their
topological location as long as the resulting deployed topology stays within this
topology envelope, of course subject to the requirement that the node’s application
message demands are consistent with those assumed for dimensioning purposes.
The maximum number of sensor nodes NSmax and actuator nodes NAmax (with
N max = NSmax + NAmax ) must also be known.
   To determine the number of additional slots needed for reliability control, the
worst-case link characteristics in the deployment area must be known. As the
network is deployed in a known environment, it is possible to determine this value
by measurement. The configuration of basic and additional slots determines an
energy consumption baseline of nodes. Adding unused slots within the GinMAC
frame can improve upon this baseline.
   The allocation of basic slots for the example given in Figure 5 is depicted in
Figure 6. The total number of slots in F needed to forward data to the sink in the
                        up
example topology is SB     = 100. (see [Suriyachai et al. 2010] for generic formulae
to determine required slot numbers in generic topologies). The required number of
downstream slots in the topology shown in Figure 5 where there is a maximum of
NAmax = 2 actuators in the network is SB   down
                                                = 34
                                                                         ACM Transactions on Sensor Networks, Vol. X, No. X, XX 20XX.
124 · Tony O’Donovan et. al.
S1 S2 S3 S4 S5 S6 S7 S8 S9 .........
N-1-1-1
N-1-1-2
N-1-2-1
N-1-2-2
N-1-3-1
N-1-3-2
N-2-1-1
N-1-2-2
N-3-0-0
N-3-0-0
N-3-1-0
N-3-1-0
N-3-2-0
N-3-2-0
N-3-3-0
N-3-3-0
N-4-0-0
N-4-0-0
N-4-1-0
N-4-1-0
N-4-2-0
N-4-2-0
N-4-3-0
N-4-3-0
N-1-1-0 N-1-2-0 N-1-3-0 N-1-0-0 N-1-2-0
UPSTREAM SLOTS DOWNSTREAM SLOTS
Fig. 6: Transmission slot allocation for the topology shown in Figure 5.
To determine the number of additional slots, we first need to choose a worst-case
link reliability that GinMAC will support. The deployed system will use a topology
that fits into the topology envelope and uses only links with reliability better than
the selected worst-case link reliability. These links are called good links and are
determined before deployment. A good link is defined by burst lengths. A good link
must not have more than Bmax consecutive transmission errors and must provide
at least Bmin consecutive successful transmissions between two bursts [Munir et al.
2010].
In a scenario where good links can be characterised with short Bmax and long
Bmin , it is possible to efficiently add additional retransmission slots on the same
link to deal with losses. Consider node N-1-1-0 in the example shown in Figure 5,
Bmax = 2 and Bmin = 2. The node requires 3 basic slots for upstream transmis-
sions, and in a worst case any 2 of the 3 transmissions might be lost. However,
if 4 additional transmission slots are allocated, all 3 packets are guaranteed to be
delivered within the 7 slots provided that the channel conforms to chosen Bmax
and Bmin .
4. GINSENG DEPLOYMENT
Deploying a wireless sensor networks in an operational oil refinery poses a number
of challenges that serve to distinguish the solution from more benign contexts. In
this section we describe our deployment and explain key challenges we encountered
when establishing the deployment used for scientific evaluations.
4.1 System Set-up
The GINSENG deployment comprises a complete end-to-end solution for produc-
tion control and automation based on wireless sensor networks. Therefore, the
deployment also includes an advanced middleware back-end as well as front-end
applications. Figure 7 depicts the components of the deployed scenario.
We have deployed two adjacent wireless networks Network 1 and Network 2 in the
refinery, comprised of 12 nodes each. Our sensor nodes are compatible with the well-
known TelosB design. The networks differ in topology, physical layout, connected
sensors and the operational network channel. Our primary motivation for deploying
two networks is twofold: firstly to demonstrate and evaluate the integration and
interoperability of different networks. Secondly, to demonstrate and evaluate closed-
loop control between different networks, where the sensor is in one network and the
actuator is part of another network. The relatively small size of the networks
is determined in consideration of the latency bounds required in the application
scenarios. GINSENG sensor networks are limited in scale by virtue of having to
assure message latency and thus having to bound the number transmissions on the
ACM Transactions on Sensor Networks, Vol. X, No. X, XX 20XX.The GINSENG System for Wireless Monitoring and Control: Design and Deployment Experiences · 125
Fig. 7: The GINSENG deployment set-up also includes middleware, back-end and front-end ap-
plications.
path from each node to the sink. In the GINSENG approach, scaling to larger
deployments is achieved by linking together multiple sensor networks using the
GINSENG middleware.
Figure 7 depicts that we have also deployed four server hosts in the GINSENG
control room in a portable office located in the heart of the water treatment zone
(a restricted-access area) and a monitoring PC at the refinery control room in a
building outside the water treatment zone. We have deployed two sinks, one for
Network 1 (Host1) and one for Network 2 (Host2). The GINSENG middleware
is distributed on two hosts (Host3 and Host4) to validate its scalability for large
application scenarios. The PC at the control room runs two applications. First, the
Refinery Monitoring application that compares GINSENG’s performance with the
performance of the existing wired analog system. Second, the System Configuration
front-end to send user-defined commands to the WSNs. All machines run Linux
and are connected to the refinery backbone via IEEE 802.3 Ethernet Cat6e STP
cables.
Finally, we deployed a application that interfaces with a SAP Product Lifecy-
cle Management (PLM) server that enables predictive maintenance planning of
WSNs and other refinery equipment. The machine hosting the PLM service host
is located at the SAP Research Center in Dresden, Germany, thus demonstrating
interoperability with remote and complex back-end applications.
4.2 Middleware and Application Deployment
Figure 8 illustrates the deployment of the GINSENG middleware and connected
applications in more detail. The Dispatcher software installed at Host1 and Host2
processes packets from the sensor networks that arrive at Sink1 and Sink2 and for-
wards them via a TCP/IP connection towards the GINSENG middleware. Further-
more, it transfers system configuration commands that emanate in the middleware
to individual sensor nodes.
As stated in Section 3, the middleware was designed for a distributed deployment
scaling up to large numbers of connected data sources and back-end applications,
and hence requires high data rates at high reliability. To validate the distributed de-
ACM Transactions on Sensor Networks, Vol. X, No. X, XX 20XX.126 · Tony O’Donovan et. al.
sign, we deployed the middleware at two servers, Host3 and Host4. Host4 comprises
the central middleware database that stores all related configuration information.
This includes the number of deployed agents and connection parameters, the admin
user-interface to manage these configurations, the system configuration component
to derive commands, e.g., for cross-WSN actuation, and the system integration
component connected to Host2, (i.e., Network 2). Host3 runs the second system
integration partition, that connects to Network 1.
In both system integration partitions there are key elements: (i) The WSN
adapter layer for downwards connectivity, (ii) the back-end adapter layer with var-
ious adapter agents to connect different back-end applications (like the Refinery
Monitoring application in the refinery control room or the SAP PLM server for
maintenance planning) and (iii) a Complex Event Processing (CEP) agent to ag-
gregate and analyse incoming sensor data.
Fig. 8: Distribution of GINSENG middleware in the deployment.
4.3 Network Design and Topology
Following from the discussion of network dimensioning, a hierarchical topology is a
natural choice to achieve scalability. The physical constraints of the testbed were
the dominating factor in determining the actual topology chosen. While Network 1
follows a 3-3 hierarchical topology, the Network 2 is based on a 3-1-2 configuration.
Figure 9 illustrates the physical topology of both networks relative to the GINSENG
control room that is located between the two networks. Figure 10 and Figure 11
detail the logical topology of each network individually. Both networks also include
actuators that control valves.
The choice of sensor nodes to be attached to transducers and to actuators are
dependent on the location of the measurement points and control equipment (see
ACM Transactions on Sensor Networks, Vol. X, No. X, XX 20XX.The GINSENG System for Wireless Monitoring and Control: Design and Deployment Experiences · 127
WSN
1
(28.5
x
18.1
m)
103
102
110
105
113
108
109
106
104
112
111
107
101
Control
Room
WSN
2
(47.5
x
31.3
m)
1
10
m
4
7
11
10
5
2
6
3
8
12
9
13
Fig. 9: Physical topology of the networks.
Figure 9). The hierarchical topology and the additional relaying nodes were care-
fully chosen to obtain good network performance. The process followed a me-
thodical empirical approach based on visual inspection of each node’s location and
measurements of radio communication between nodes.
As a logical tree, a balanced tree was chosen in which we can use Bmax = Bmin =
1 which has one re-transmission slot per message and enables a schedule that meets
the desired delivery times (more details on dimensioning and schedule construction
are provided in the next section).
The node identifiers in the Figure (also used later in explaining the logical topol-
ogy) are unique to each node.
4.4 Deployment-specific Challenges
The refinery environment is highly challenging with respect to wireless communi-
cation. Huge metal structures and machines operating non-stop cause a high noise
level, which might seriously affect the system performance. In general however
the radio environment, while noisy, was observed to usually be fairly stable, with
reliability levels on individual links lying within well-defined ranges.
The deployment of a network in a sensitive environment such as an oil refinery
poses many new challenges. Like other heavy industrial sites, the refinery has
ACM Transactions on Sensor Networks, Vol. X, No. X, XX 20XX.128 · Tony O’Donovan et. al.
101
FT-5147 FT-5170
107 109 FT-5141 111
110 102 108 105 112
112 113 103 106 104
FT-5147 PT-5170 FT-5141 FT-5130 FT-5130 FT-5130 PT-5100 PT-5100 FT-5100
Mote 802.15.4 Link
FT-NNN Flow Sensor PT-NNN Pressure Sensor
Fig. 10: Logical topology of network 1.
1
FT-4003 FT-4004
4 7 FT-4005 11
10 5
112 8
FT-4006 FT-4007 n.a.
2 6 3 12 9 13
n.a. n.a. n.a. n.a. n.a. n.a.
Mote 802.15.4 Link n.a. Not Available
FT-NNN Flow Sensor PT-NNN Pressure Sensor
Fig. 11: Logical topology of network 2.
very strict rules regarding the movement and management of personnel within
certain areas. Several areas are classified as ATmosphère EXplosive (ATEX) areas,
restricting access by personnel and requiring that electrical equipment, including
sensor nodes, be encased within ATEX-certified enclosures.
The use of ATEX enclosures raised concerns regarding an expected impact on
wireless signal attenuation. Our previous research had demonstrated the benefits of
using an antenna that is located outside an ATEX enclosure [Boano et al. 2009]. In
ACM Transactions on Sensor Networks, Vol. X, No. X, XX 20XX.The GINSENG System for Wireless Monitoring and Control: Design and Deployment Experiences · 129
fact this was essential because the specification of the ATEX enclosures necessary in
the refinery was such that all wireless communication using the on-board (internal)
antenna on the TelosB nodes was blocked. We first tried relatively low-cost external
antennas with 1 dB gain. These antennas enabled communication but only at very
low packet delivery rates. In addition, the initial 1 dB antenna, a standard WLAN
external antenna, had corroded to an alarming degree within only two weeks at
the refinery due to the operating environment. As a result, we studied alternative
antennas, concluding that the best option would be a ceramic white 45.72 cm
antenna, with 9 dB of gain, capable to assure maximum performance, quality and
durability. It was not just a question of power but also a question of resistance and
durability in these corrosive environments. While operating with these antennas
in the refinery we realised that although the clamps became corroded, the ceramic
antenna has never shown any problem. The 9 dB of gain were also a key point in
this choice, allowing extended transmission range [Raman and Chebrolu 2008].
Naturally these resulted in an additional per-node cost - approximately e125 for
each ATEX enclosure and e220 for each antenna. In different settings the deploy-
ment constraints will differ and the features and costs of the required enclosures and
antennae may be higher or lower than these values. For example, low-end ATEX
enclosures are available for under e10, and low-end external antennae for tens of
Euro.
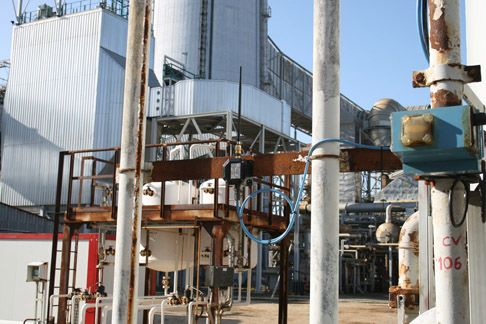
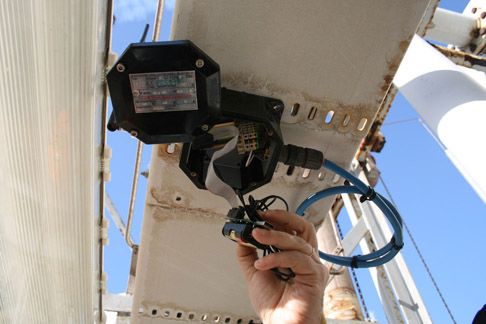
Figure 12 shows some of the sensor locations, the portable office with the GINSENG
control room, as well as one of the deployed nodes within the ATEX enclosure and
an attached 9 dB antenna.
In the next section, we show some experimental results that demonstrate the
importance of channel selection. Those experiments revealed that the selection of
an appropriate IEEE 802.15.4 channel significantly increased packet delivery rates.
A deeper analysis on coverage and radio interference in the refinery can be found
in [Tran et al. 2011].
4.5 Channel Selection
In order to achieve reliable and energy-efficient communication, we conducted some
preliminary experiments to demonstrate the importance of selecting appropriate
IEEE 802.15.4 channels. In the experiment, a node sends 200 packets in one hop to
the sink node with an inter-packet transmission time of 200 ms. The sink extracts
the received signal strength indicator (Receiver Signal Strength Indicator (RSSI))
and the message ID to calculate the Packet Reception Rate (Packet Reception Rate
(PRR)) measured from source to sink without retries. We performed measurements
with both types of external antennae, i.e., with gain of 1 dB and 9 dB respectively.
As expected, the 9 dB antenna performed significantly better, so we omit the results
for the 1 dB antenna.
Our results are shown in Figure 13. Channels 13 to 18 exhibit good results with
almost no packet losses and an RSSI between -60 and -63 dBm. Channels 25 and
26 also show a good PRR but with a lower RSSI. These results serve to emphasise
the need to conduct experiments at the site to avoid choosing a bad channel.
Figure 13 shows that channel 21 would lead to significantly worse performance
than the other channels and should be avoided. The reason for this behaviour is
technically unknown. We can only hypothesise that some equipment at the refinery
ACM Transactions on Sensor Networks, Vol. X, No. X, XX 20XX.130 · Tony O’Donovan et. al.
Fig. 12: Sensor nodes deployed in the refinery.
was generating interference at this particular frequency in that area of the plant.
From our field experience we have learnt that in the refinery channels performance
changes from area to area depending on the structures and operations running
locally, which cause different types of noise and radio interference. Hence, for each
deployment we concluded that not only a previous spectrum analysis is needed, but
also that it must be repeated periodically during the network lifetime, as part of a
maintenance regime, to guarantee that the spectrum interference has not changed.
ACM Transactions on Sensor Networks, Vol. X, No. X, XX 20XX.The GINSENG System for Wireless Monitoring and Control: Design and Deployment Experiences · 131
0 1
−10 0.98
−20 0.96
RSSI (dBm)
−30 0.94
PRR
−40 0.92
−50 0.9
−60 0.88
−70 0.86
10 12 14 16 18 20 22 24 26 28
RF Channel
Fig. 13: Performance of the 802.15.4 channels.
5. EVALUATION
In this section we present and analyse results obtained from the evaluation of the
GINSENG system in the Petrogal refinery at Sines. As GINSENG provides a com-
plete solution for wireless monitoring and control, a large number of experiments
were performed to capture the performance of the network and of other system com-
ponents. Focused, short-duration experiments, were designed to evaluate individual
components of the system. The results were consistently positive, with targets for
delay and reliability being easily achieved, and demonstrating that the network
works properly and is well provisioned during this time. To capture the general
characteristics of the system, a longer-term experiment was running continuously
for a two week period.
Given the focus of the research, the key metrics of interest are delay and re-
liability of message delivery. The performance of the wireless sensor networks is
investigated in detail as it is the dominant factor in determining overall system per-
formance. However, the performance of the backend infrastructure is analysed as
well, including its scalability. System performance in the context of monitoring-only
applications and also applications with automated control loops is investigated. Fi-
nally, a comparison of data obtained from the installed cabled monitoring system
with data obtained through GINSENG is carried out to show that GINSENG is a
valid alternative to the existing cabled system.
5.1 System Setup for Evaluation
The network setup as described in the previous section was used for evaluation. For
the two WSNs (Network 1 and Network 2) channels 16 and 14 respectively were se-
ACM Transactions on Sensor Networks, Vol. X, No. X, XX 20XX.132 · Tony O’Donovan et. al. lected as they provided a relatively clean communication environment as explained in Section 4.5. Then, for both networks a topology was selected that allowed us to employ a GinMAC schedule with Bmax = 1 and Bmin = 1 to support end-to-end reliability of 99 %. These resulting logical topologies were shown in Figures 10 and 11, while the physical topologies can be seen in Figures 14 and 15. In GINSENG it is always desirable to identify topologies that require few retransmission slots in order to minimise end-to-end delivery latencies. Other topologies are possible of course but may require a higher number of retransmission slots within the sched- ule. Unlike the node identifiers used in the previous section that served simply to uniquely distinguish nodes, the node identifiers used in this section are topological, explicitly giving the location within the network tree in terms of branch and level, and thus facilitating an easier interpretation of the results. In both networks, nodes are programmed to generate application data messages once every second. A subset of nodes in each network are configured to work as actuators as well as sensors. A minimum GinMAC schedule was devised for both networks which provides the necessary time for transmission of upstream and downstream messages and maintenance messages, such as for time synchronisation. The schedule also allows sufficient time for application processing - in these slots no communication takes place and processing cycles are ensured to be available at every node for application tasks. Network 1 contains 12 nodes along with a sink node that is connected to a sink PC. It is a 3-3 network as shown in Figure 10, with each child of the sink having three children of its own. There are three branches: Branch 1 consists of nodes 1-0, 1-1, 1-2 and 1-3 with node 1-0 forwarding messages from nodes 1-1, 1-2 and 1-3 to the sink, 0-0. Branch 2 consists of nodes 2-0, 2-1, 2-2 and 2-3 with node 2-0 forwarding messages from nodes 2-1, 2-2 and 2-3 to the sink, 0-0. Branch 3 consists of nodes 3-0, 3-1, 3-2 and 3-3 with node 3-0 forwarding messages from nodes 3-1, 3-2 and 3-3 to the sink, 0-0. In Network 1, it was convenient to use a single node, Node 1-0, as both a sensor and an actuator. Sensor data generated by Node 1-0 is transmitted via the network and delivered as input for actuation, just as it would if the sensor and actuating functions were on different physical nodes. To support the communication requirements a GinMAC schedule employing 92 slots in one TDMA epoch is used in Network 1. Each slot has a duration of 10 ms leading to an epoch duration of 920 ms. The slot allocation does not follow the strict layout given in Section 3 in order to allow for optimisation for the control loop. The first 2 slots in the epoch are reserved for application processing. In these slots all nodes generate sensor data that has to be transported. Next are 2 dedicated upstream slots for node 1-0 to transmit the sensor data necessary as input for the control loop. Thereafter 16 slots for sensor data from nodes in Branch 1 are provisioned. Next are 2 unicast downstream slots for actuator messages directed to node 1-0. Thereafter 4 slots for broadcast downstream traffic are provided. These slots can be used to carry sensor node configuration commands (e.g. to switch sensing on or off). These are followed by 4 slots used for time synchronisation of the network. Then 28 upstream slots for sensor data from Branch 2 and Branch 3 ACM Transactions on Sensor Networks, Vol. X, No. X, XX 20XX.
You can also read