GRANDMA Observations of Advanced LIGO's and Advanced Virgo's Third Observational Campaign
←
→
Page content transcription
If your browser does not render page correctly, please read the page content below
GRANDMA Observations of Advanced LIGO’s and
                                               Advanced Virgo’s Third Observational Campaign

                                                S. Antier1 , S. Agayeva2 , M. Almualla3 , S. Awiphan4 , A. Baransky5,6 , K. Barynova5,6 ,
                                               S. Beradze7,8 , M. Blažek9 , M. Boër10 , O. Burkhonov11 , N. Christensen10 , A. Coleiro1 ,
                                               D. Corre12 , M. W. Coughlin13 , H. Crisp14 , T. Dietrich15 , J.-G. Ducoin12 ,
                                               P.-A. Duverne12 , G. Marchal-Duval12 , B. Gendre14 , P. Gokuldass16 H. B. Eggenstein17 ,
arXiv:2004.04277v2 [astro-ph.HE] 23 Jun 2020

                                               L. Eymar10 , P. Hello12 , E. J. Howell14 , N. Ismailov2 , D. A. Kann9 , S. Karpov18 ,
                                               A. Klotz19,20 , N. Kochiashvili7 , C. Lachaud1 , N. Leroy12 , W. L. Lin21 , W. X. Li21 ,
                                               M. Mašek18 , J. Mo21 , R. Menard1 , D. Morris16 , K. Noysena19,20 , N. B. Orange22 ,
                                               M. Prouza18 , R. Rattanamala23 , T. Sadibekova11,24 , D. Saint-Gelais1 M. Serrau1 ,
                                               A. Simon25 , C. Stachie10 , C. C. Thöne9 , Y. Tillayev11,26 , D. Turpin24 ,
                                               A. de Ugarte Postigo9 , V. Vasylenko25 , Z. Vidadi2 , M. Was27 , X. F. Wang21 ,
                                               J. J. Zhang28 T. M. Zhang29 X. H. Zhang21

                                               Accepted XXX. Received YYY; in original form ZZZ

                                                                               ABSTRACT
                                                                               GRANDMA is a network of 25 telescopes of different sizes, including both photometric
                                                                               and spectroscopic facilities. The network aims to coordinate follow-up observations of
                                                                               gravitational-wave candidate alerts, especially those with large localisation uncertain-
                                                                               ties, to reduce the delay between the initial detection and the optical confirmation.
                                                                               In this paper, we detail GRANDMA’s observational performance during Advanced
                                                                               LIGO/Advanced Virgo Observing Run 3 (O3), focusing on the second part of O3; this
                                                                               includes summary statistics pertaining to coverage and possible astrophysical origin of
                                                                               the candidates. To do so, we quantify our observation efficiency in terms of delay be-
                                                                               tween gravitational-wave candidate trigger time, observations, and the total coverage.
                                                                               Using an optimised and robust coordination system, GRANDMA followed-up about
                                                                               90% of the gravitational-wave candidate alerts, i.e. 49 out of 56 candidates. This led
                                                                               to coverage of over 9000 deg2 during O3. The delay between the gravitational-wave
                                                                               candidate trigger and the first observation was below 1.5 hour for 50% of the alerts.
                                                                               We did not detect any electromagnetic counterparts to the gravitational-wave candi-
                                                                               dates during O3, likely due to the very large localisation areas (on average thousands
                                                                               of degrees squares) and relatively large distance of the candidates (above 200 Mpc for
                                                                               60% of BNS candidates). We derive constraints on potential kilonova properties for
                                                                               two potential binary neutron star coalescences (GW190425 and S200213t), assuming
                                                                               that the events’ locations were imaged.
                                                                               Key words: methods: observational – Stars: neutron – Gravitational waves:

                                               1   INTRODUCTION                                               et al. 2017a; Abbott et al. 2020a) and black holes (BHs) (Ab-
                                                                                                              bott et al. 2019a), providing unprecedented new insights into
                                                                                                              these objects.
                                               Gravitational-wave (GW) signals detected by Advanced
                                               LIGO (Aasi et al 2015) and Advanced Virgo (Acernese et al          During the first and second Advanced LIGO and Ad-
                                               2015) since 2015 have revealed the existence of compact bi-    vanced Virgo observing runs, O1 and O2 (2015-2017, Ad-
                                               nary mergers which included neutrons stars (NSs) (Abbott       vanced Virgo joined at the end of O2), GWs from ten binary

                                               © 2020 The Authors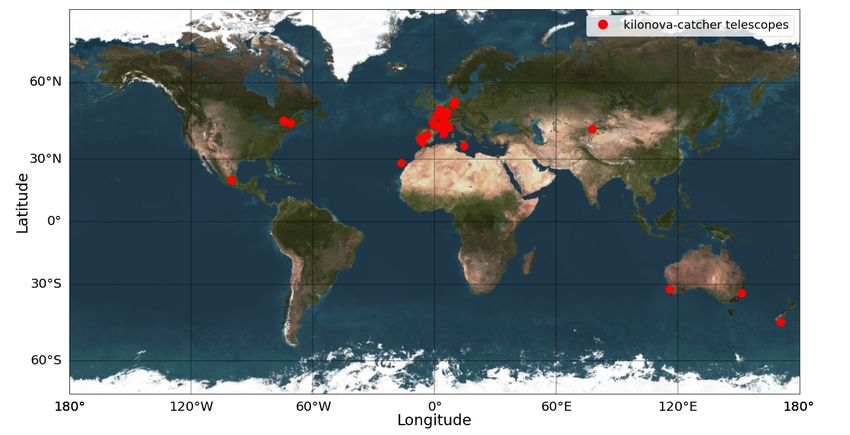
2     GRANDMA collaboration
BH (BBH) systems and a binary NS system (BNS) were de-            field-of-view is optimal. However, there is a delicate bal-
tected (Abbott et al. 2019a, 2017a). Additional events pro-       ance; large credible regions are often the result of more dis-
duced by BBHs were also claimed by other groups analyzing         tant sources observed at relatively lower signal-noise-ratio
the LIGO/Virgo data (Zackay et al. 2019). The GW obser-           (SNR) – but sources at greater distances are more acces-
vations of these compact binary sources have allowed gravity      sible to larger diameter telescopes. It is both technically
to be probed in the ultra-strong field regime (Abbott et al.      and financially challenging to have a large aperture tele-
2016), and have yielded new ideas on the formation channels       scope capable of covering a large field-of-view. This has
of the systems (Abbott et al. 2019c).                             motivated the use of multiple telescopes working in unison
     The first GW observation from a coalescing BNS,              within global networks for the purpose of identification and
GW170817 (Abbott et al. 2017a) and the joint observations         characterisation of counterparts; see for example (Coughlin
of GRB 170817A by the Fermi/GBM and INTEGRAL/SPI                  et al. 2020b). In addition to GRANDMA (Global Rapid Ad-
ACS gamma-ray detectors (Goldstein et al. 2017; Savchenko         vanced Network Devoted to the Multi-messenger Addicts),
et al. 2017) firmly established the association between BNS       the heterogeneous telescope network described in this pa-
mergers and short duration gamma-ray bursts (GRBs). The           per, other networks such as the Global Relay of Observato-
estimation of the source location of GW170817 and its             ries Watching Transients Happen (GROWTH, Coughlin et
subsequent identification at a distance of 40 Mpc (Coul-          al. 2019c), MASTER-Net (Lipunov et al. 2010) and KMT-
ter et al. 2017) initiated a ground-breaking electromagnetic      Net2 have also been conducting counterpart searches during
(EM) follow-up campaign from the X-ray to radio bands.            O3, supported by a host of individual facilities such as Pan-
These EM observations provided evidence that a successful         STARRS1 (Flewelling et al. 2016), ATLAS (Tonry 2011),
jet was launched and that the initial gamma-ray emission          DECam (Herner et al. 2017), MeerLICHT (Bloemen et al.
were from a structured jet viewed approximately 20 degrees        2016), DDOTI (Watson et al. 2020), and GOTO3 (O’Brien
off-axis (Mooley et al. 2018; Ghirlanda et al. 2019).             2018). The O3 campaign has also seen the emergence of a
     Furthermore, optical, ultraviolet and infrared observa-      variety of new tools and multi-messenger platforms to coor-
tions of the optical counterpart AT 2017gfo (Coulter et al.       dinate and optimise the follow-up: galaxy ranking can be op-
2017) monitored the glow of a “kilonova,” produced by the         timised through the online catalogue MANGROVE (Ducoin
radioactive decay of r-process elements in the neutron-rich       et al. 2020a); the GWEMOPT open software can be used
ejecta (Lattimer & Schramm 1974; Li & Paczynski 1998;             to schedule GW follow-ups (Coughlin et al. 2018a); and the
Kasen et al. 2017) and showed that the source evolved from        GW TreasureMap (Wyatt et al. 2020) is a system to report
blue to red over a week (Abbott et al. 2017b; Arcavi 2018).       and visualise the progress of searches for EM counterparts
The impact of this discovery motivated a large number of          to GW events.
small aperture telescopes to systematically scan the credi-            In a previous paper (Antier et al. 2020), we published
ble regions provided by LIGO/Virgo GW candidate event             the GRANDMA results obtained during O3a. This current
triggers during subsequent LIGO/Virgo observational runs.         paper continues in a similar vein through the study of can-
The most recent run, O3, which began in April 2019, was           didate events from O3b. The paper is organised as follows:
split into two parts to allow for a commissioning break: O3a      Section 2 outlines the GW candidate alerts received during
(2019 April – 2019 September) and O3b (2019 November –            O3, and Section 3 describes the new telescopes that joined
2020 March 27; somewhat more than a month earlier than            the GRANDMA collaboration for O3b. Section 4 provides
planned because of the COVID-19 pandemic).                        details on the adopted observational strategies. Section 5
     Since the discovery of the EM counterpart of GW170817        presents details on the GRANDMA observations, focuses
no other counterpart associated with a GW candidate event         on some specific events, and provides new constraints on the
has been observed despite significant coordinated efforts by      GW progenitors. We finish by presenting our conclusions in
numerous observing groups, e.g. Coughlin et al. 2019c; Hos-       Section 6.
seinzadeh et al. 2019; Goldstein et al. 2019; Andreoni et al.
2020a; Ackley et al. 2020; Brunn et al. 2019.
     The potential BNS sources1 reported so far by the
LIGO/Virgo network in O3 (a sample of five with a BNS             2   OVERVIEW ON THE THIRD
source probability of > 50%) have median estimated dis-               OBSERVATIONAL CAMPAIGN O3
tances in the range ∼ 157 − 241 Mpc with only one source,         The third observational campaign organized by LIGO and
GW190425 (Abbott et al. 2020a), within 200 Mpc.                   Virgo, O3, started 2019 April 1 at 15:00 UTC (LIGO Sci-
     Additionally, the 90% confidence intervals of the sky lo-    entific Collaboration & Virgo Collaboration 2019a). After
calisations for this sample cover the range 1131 − 24226 deg2 .   a month-long commissioning break in October, the second
The combination of large credible regions coupled with the        period of the campaign finished on 2020 March 27 at 17:00
dimmer optical counterparts expected at such large dis-           UTC, for a total of 330 days, short of the goal of a full 365
tances have made searches for EM counterparts a highly            days, cut short by the COVID-19 pandemic. For comparison,
challenging (and ultimately unsuccessful) endeavour during        the second observational campaign lasted 269 days and the
O3.                                                               first observational campaign lasted 129 days (Veitch et al.
     When conducting searches of large GW sky localisa-           2015).
tions with a single instrument, a telescope with a large

                                                                  2 https://kmtnet.kasi.re.kr/kmtnet-eng/
1 Note that we make the assumption in this paper that any com-    3 Currently operating with one operational site, with funding ap-
pact object component with mass < 3M is a NS.                     proved for an additional node in Australia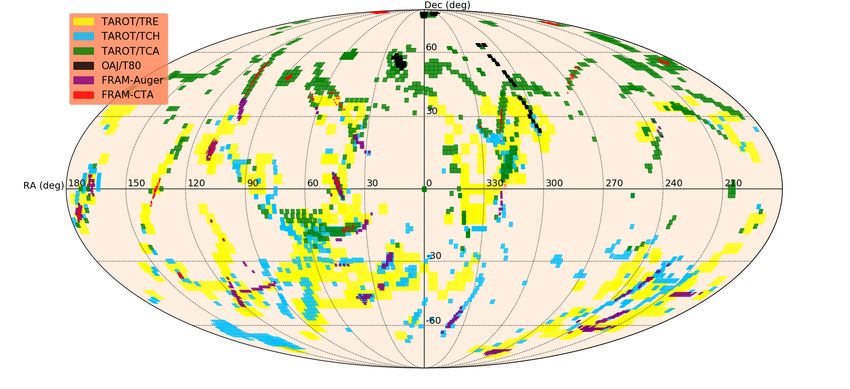
Observations of O3 alerts by GRANDMA                        3
2.1   O3 alerts                                                  have information on their distance derived from the GW
                                                                 binary coalescence signal modeling. The final event classifi-
During O3, the LIGO Scientific Collaboration and the
                                                                 cation can differ from the low latency analysis due to the
VIRGO Collaboration (LVC) sent 80 alerts to the astro-
                                                                 further study subsequently conducted. This is especially the
nomical community (and about 100 in total for the O1, O2
                                                                 case for low-mass binaries with one object close to the lower
and O3 observational campaigns combined). Among them,
                                                                 or upper bound of the 3 − 5M gap that can be reclassified
24 were false positives resulting in retractions due to data
                                                                 “NSBH”, “BBH”, or “Mass Gap”: S190814bv was given a final
quality issues (see for instance LIGO Scientific Collabora-
                                                                 classification of 99% “NSBH” (LIGO Scientific Collaboration
tion & Virgo Collaboration 2019p, 2020b,f) and 56 are still
                                                                 & Virgo Collaboration 2019j,k), and S190728q as 52% Mass
considered as potential signals. 52 were classified as GW
                                                                 Gap (LIGO Scientific Collaboration & Virgo Collaboration
signals with a probability higher than 50%4 via the GCN
                                                                 2019h,i). In addition, the indication regarding probability to
platform (Gamma-ray burst Coordinates Network5 ) thanks
                                                                 be of astrophysical origin has also evolved for some of the
to a new dedicated alert system developed by the LVC 6 .
                                                                 GW candidates: S190426c and S190510g now have a prefer-
The alert system was still being debugged for the first two
                                                                 ential origin of being “Terrestrial” (LIGO Scientific Collab-
months (April and May), producing a large delay of dozens
                                                                 oration & Virgo Collaboration 2019b,c,l); On the contrary,
of minutes between the alert delivery and the GW trigger
                                                                 S190727h is now considered as an astrophysical event with
time (the event UTC time). The delay was typically less
                                                                 92% “BBH” (LIGO Scientific Collaboration & Virgo Collab-
than 10 minutes for the remainder of the run, although some
                                                                 oration 2019g); S200105ae is still classified as 97% “Terres-
exceptional delays did occur for non-technical reasons, i.e.
                                                                 trial” but the LVC reported that the low false alarm rate
S200219ac (LIGO Scientific Collaboration & Virgo Collab-
                                                                 for this trigger was due to only one detector (LIGO Liv-
oration 2020j), S200105ae (LIGO Scientific Collaboration &
                                                                 ingston) responding to the event and offline analysis is likely
Virgo Collaboration 2020a) and S191105ae (LIGO Scientific
                                                                 to increase its significance (LIGO Scientific Collaboration &
Collaboration & Virgo Collaboration 2019n) during O3b.
                                                                 Virgo Collaboration 2020a,c).
     The GW alerts were distributed with three different
                                                                      The localisation area for GW alerts also differs from
types of GCN/LVC notices with different distribution de-
                                                                 the initial to the updated analysis for some events (for ex-
lays: preliminary (within 5 minutes), initial (within 30 min-
                                                                 ample, due to the inclusion of Virgo data in the analysis for
utes, produced after human vetting), and update notices
                                                                 S200225q, LIGO Scientific Collaboration & Virgo Collabo-
(within 2 to 4 days, produced after a refined parameter
                                                                 ration 2020k). These issues will be discussed in section 2.2.
estimation analysis). The notices contain information such
                                                                 Note that the reports for the distance estimate can also vary
as the trigger time, the online pipeline that generated the
                                                                 (e.g. S200219ac, LIGO Scientific Collaboration & Virgo Col-
trigger, the event false alarm rate, a link to the sky lo-
                                                                 laboration 2020j), but we will not discuss this distance anal-
calisation probability map (Bayestar, Singer & Price 2016
                                                                 ysis in this paper.
or LALInference, Veitch et al. 2015), and the estimate of
the distance to the source. The alert also contains differ-           Figure 1 displays the most recently issued 90% cred-
ent source classification information if available for compact   ible localisation region produced for a GW candidate ver-
binary searches: a BNS [p(BNS)], a BHNS [p(BHNS)], or            sus its most recently updated luminosity distance (poste-
terrestrial noise [p(terrestrial)] (Kapadia et al. 2020), and    rior mean distance and posterior standard deviation of dis-
an indicator to estimate the probability of producing an EM      tance): all detailed numbers can be found in Antier et al.
signature considering the candidate is of astrophysical origin   (2020) for O3a and Section 5 for O3b. We split the dia-
[p(HasRemnant)] (Chatterjee et al. 2019). The GW trigger         gram into four sections, one for each of the O1, O2, O3a,
can be also classified as “MassGap,” completing the possible     and O3b observational campaigns. We indicate the names
classifications. In the case of a Mass Gap event, the initial    of detected events and candidates if their error boxes are
estimate is that at least one of the compact objects has a       smaller than 30 square degrees containing one confirmed
mass of 3 − 5M , implying it is unclear whether it is a neu-     BNS event (GW170817, Abbott et al. 2017a, 2019a), a NS-
tron star or a black hole. The other object can be a lighter     BH candidate (S190814bv, LIGO Scientific Collaboration &
neutron star or a more massive black hole. Up to the time        Virgo Collaboration 2019k), and two BBH candidate events
when this paper was written, only the “superevent” S190425z      (S200225q, LIGO Scientific Collaboration & Virgo Collabo-
has been confirmed as a real astrophysically produced GW         ration 2020k, and S200208q, LIGO Scientific Collaboration
event, GW190425 (Abbott et al. 2020b).                           & Virgo Collaboration 2020g).
     Out of the 52 GW candidates detected in O3, 36 have              For each kind of event, a cumulative distribution func-
been classified as likely being emitted from a BBH merger,       tion on the distance can be constructed by approximating
five from mass gap mergers, five from BHNS mergers, five         each measured distance and error bar with a Gaussian func-
from BNS mergers, and one was a GW “burst” type trigger          tion. The combined distribution is shown in Figure 2, along
(unmodeled search) of unidentified origin (LIGO Scientific       with the predictions provided by the LVC (Abbott et al.
Collaboration & Virgo Collaboration 2020d; Klimenko et al.       2018a). There is a clear separation between the BNS and
2016). Except for the case of the burst GW signal, the rest      BBH distributions. This is due to the much higher rate of
                                                                 BNS mergers compared to BBH mergers7 (Abbott et al.
                                                                 2019a), and to the much smaller distance at which BNS
4 See https://gracedb.ligo.org/superevents/public/O3/ for more   mergers can be detected by GW detectors compared to BBH
information.
5 see https://gcn.gsfc.nasa.gov/ for more information
6 see   the LIGO/Virgo userguide for more information            7The GWTC-1 catalogue gives 110 − 3840 events Gpc −3 y −1 for
https://emfollow.docs.ligo.org/userguide/                        BNSs and 9.7 − 101 events Gpc−3 y −1 for BBHs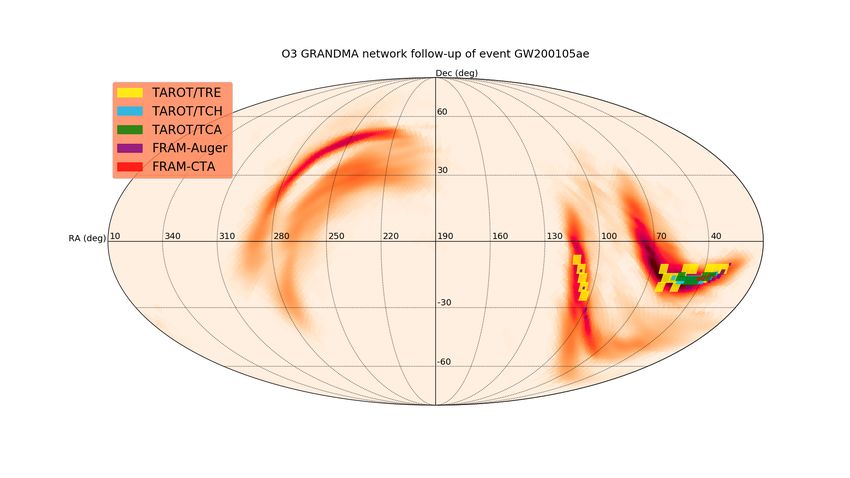
4     GRANDMA collaboration

Figure 1. The most recently updated 90% credible region area versus the most recently updated luminosity distance (posterior mean
distance and posterior standard deviation of distance) for all LIGO/Virgo GW events/candidates of runs O1, O2, O3a and O3b. Vertical
red dotted lines are the expected limiting distances to detect binary neutron star mergers (BNS) by the LIGO/Virgo detectors. BBH
(binary black hole mergers), MG (mass gap mergers), NSBH (neutron star - black hole mergers) are represented in different colours.
Four candidates for run O3 are indicated by open symbols corresponding to a predominantly terrestrial classification (above 50%) and
the classification indicated in these plots is the second most likely.

mergers. Hence, BBH mergers are detected often at large dis-              The 90% credible region areas can be combined to ob-
tances where the large volume compensates for the low rate.          tain a cumulative distribution function for the localisation
In particular, there is no BBH candidate or event detected           area. This is shown in Figure 3 and compared with the
below 200 Mpc.                                                       predictions provided by the LIGO/Virgo collaboration (Ab-
                                                                     bott et al. 2018a). For BBH mergers, the localisation area is
     The observed distances are larger than the prediction
                                                                     on average a factor 2 larger than predicted. Similar to the
by approximately a factor 2 for BNS and BBH event types.
                                                                     distance distribution, the difference could be due to larger
This could be due to the conservative detection threshold
                                                                     masses and smaller network SNR of the signals detected as
on network SNR of 12 used in the prediction described in
                                                                     opposed to those from the simulations, as both properties
Abbott et al. (2018a) and by masses for the binary system
                                                                     are expected to reduce localisation performance. For BNS
being larger than those used in the simulations. The study
                                                                     mergers the discrepancy with the prediction is larger by a
of this discrepancy is beyond the scope of this paper. In
                                                                     factor of 10. This is more difficult to explain, but we note
particular, the median distance of BNS candidates in the
                                                                     that three out of eight BNS candidates have a significant
run O3 is 200 Mpc, 5 times further than GW170817. As a
                                                                     probability (above 50%) of being Terrestrial. GW190425 is
consequence, the apparent magnitudes of kilonovae associ-
                                                                     the only confident detection from O3 announced by the LVC
ated with the BNS events of the run O3 are expected to be
                                                                     so far (Abbott et al. 2020b), but it was observed by only two
∼ 3.5 mag fainter than for GW170817, assuming the same
                                                                     GW detectors and with a very low signal-to-noise ratio in
intrinsic lightcurve.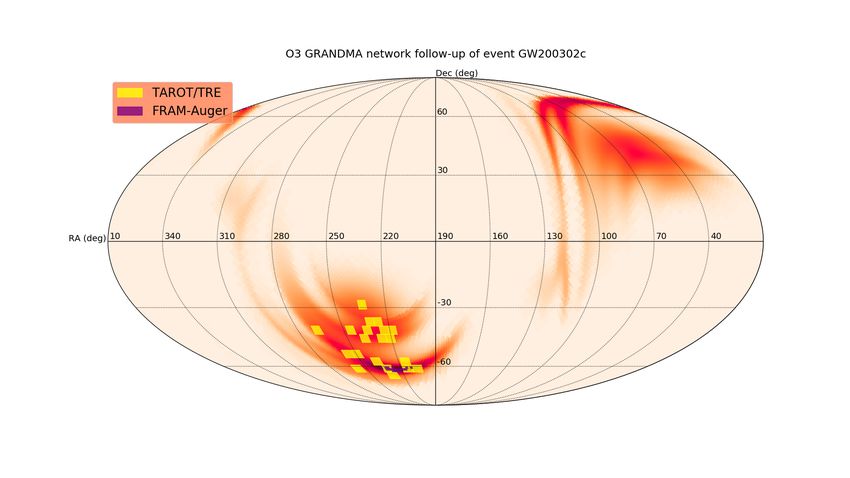
Observations of O3 alerts by GRANDMA                        5

                                                                      Table 1. Statistics for each GW candidate/event source type
                                                                      during O3, see main text for further details.

                                                                            Type    Detections   Mean D L    Volume           Rate
                                                                                                  Mpc         Gpc3     events yr−1 Gpc−3
                                                                         BNS           5           206        0.037           152
                                                                        NS-BH           5          366        0.205            27
                                                                       Mass gap        5           737        1.675            3.3
                                                                         BBH           36         1649        18.77            2.1

                                                                      ume that it represents, and estimate an event rate. To do
                                                                      this, we divide the number of GW candidates during the
                                                                      observational period by its duration, and divide that result
                                                                      by the volume determined for the type of event as presented
                                                                      in Table 1. A Monte Carlo study shows that this method
                                                                      yields, on average, the correct rate estimate if all events of
                                                                      the same type can be detected up to the same limiting dis-
Figure 2. The cumulative distribution function of all                 tance (i.e. there is no large dispersion in the chirp masses).
LIGO/Virgo GW events and candidates in O3 with a Terrestrial          This is approximately true for BNS events, but for BBH sys-
indicator below 50% versus the distance is shown in solid lines,
                                                                      tems there is a wide distribution in masses which will lead
compared to the predictions for these distribution from Abbott
                                                                      to a large systematic error (Abbott et al. 2019a). We cannot
et al. (2018a) shown in dashed lines.
                                                                      quantify this bias as the chirp mass of the systems are not
                                                                      yet publicly distributed.

                                                                      2.2     Localisation and observational constraints
                                                                      In order to give insight into the O3 campaign, it is useful
                                                                      to quantify the possibility of observing during the nights
                                                                      following the detection, as well as the benefit of observing
                                                                      after the initial sky localisation is released but before the
                                                                      updated sky localisation is available. Due to factors such
                                                                      as high airmass and the Sun’s altitude, the possibility of
                                                                      observing from a certain location may be different than oth-
                                                                      ers, and so it is important to take this into consideration
                                                                      when attempting to follow up candidate events. Both initial
                                                                      and updated sky localisation areas are available for 41 candi-
                                                                      dates. Figure 4 displays the cumulative distribution function
                                                                      for the observable probability within the localisation from
                                                                      three representative locations (Palomar, The Cerro Tololo
                                                                      Inter-American Observatory, and Hawaii) for all candidate
Figure 3. The cumulative distribution function of all                 events during O3. As can be seen in the figure, around 20%
LIGO/Virgo GW events and candidates in O3 with a Terrestrial          of events were not observable at all from at least one of
indicator below 50% versus the 90% credible localisation area is      the three locations in the week following detection. We also
shown in solid lines, compared to the predictions for these distri-   find that a further ∼ 16% of candidates had / 4% of the
butions from Abbott et al. (2018a) shown in dashed lines.             probability observable from all three locations; all of these
                                                                      transients have 90% credible regions spanning less than 300
                                                                      square degrees (except for S190602aq, LIGO Scientific Col-
one of them, which explains its poor sky localisation. In com-        laboration & Virgo Collaboration 2019d, for which it spans
parison with O2, the sky localisation areas of the eight BNS          ∼ 750 square degrees) and were classified to very likely be
candidates produced during the run O3 are spread over a               BBH mergers (aside from S190924h, LIGO Scientific Collab-
median value of 4500 deg2 (i.e. 10% of the sky), 300 times            oration & Virgo Collaboration 2019m, which was classified
larger than for GW170817, which was observed by three GW              as a mass gap candidate at > 99%). Additionally, 20% of
detectors.                                                            candidates had more than 40% observability from only one
     The large GW alert rate in O3 provides motivation for            of the three sites, demonstrating the utility of coordinating
a first estimate of the rate at which each classification of          network-level telescope observations to obtain large cover-
event (BNS, NS-BH, MassGap, and BBHs); see Abbott et al.              age of the localisations. The importance of obtaining such
(2019a, 2018a) for a discussion giving a more sophisticated           observations at significant depth and coverage (regardless of
approach. Our method is as follows: for each type of event            whether an EM counterpart is ultimately discovered) can-
we calculate the mean distance for which they are detected.           not be overstated, as it has a direct impact on the ability
Next, from this distance we can determine the enclosed vol-           to constrain the ejecta mass and binary parameters for the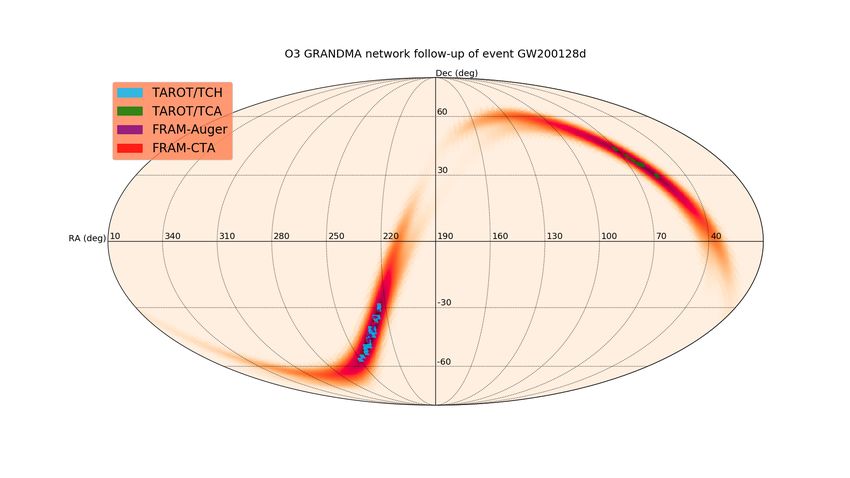
6     GRANDMA collaboration

Figure 4. Probability contained within the observable region          Figure 5. Overlap ratio between the initial and the most up-to-
of the sky localisation for all GW candidates during O3; this         date 90% credible regions of all GW candidate events during O3
is shown from three different locations (Palomar (33.3563◦ ,          (given that both sky localisations were available). Note that the
−116.8648◦ ), CTIO (−30.1691◦ , −70.8062◦ ), and Hawaii (19.8968◦ ,   overlapping regions can be discontinuous.
155.5828◦ ); the LALInference sky localisation was used as long as
it was available for the candidate/event in question.
                                                                      3     UPDATE OF THE GRANDMA
                                                                            COLLABORATION
                                                                      GRANDMA, a world-wide telescope network, was presented
                                                                      in Antier et al. (2020) in the context of O3a. Recently, new
                                                                      groups have joined the collaboration, as will be described be-
event if it is truly astrophysical in origin (Coughlin et al.         low; also presented are updates on the observation strategies
2020b).                                                               and results of certain subgroups. To date, GRANDMA is
     Figure 5 presents the distribution of the percent over-          composed of 25 telescopes with both photometric and spec-
lap between the 90% credible regions of the initial Bayestar          troscopic facilities, with a large amount of time allocated
(Singer & Price 2016) and the updated LALInference (Veitch            for observing transient alerts as a telescope network (see
et al. 2015) sky localisation areas for 41 candidate events           Figure 6, Table 2 and Table 3). The GRANDMA collabo-
from O3. To find the percent overlap, we compute the in-              ration includes 20 observatories, 29 institutions and groups
tersection in pixels between the two maps and then sum                from twelve countries.
the probability contained in that region using the LALIn-                  For each of the observatories we provide a 5σ limit-
ference sky area. From the results, we find that the events           ing magnitude as an estimate of the faintness of sources
fall into one of two possible categories: a low percentage            that can be reliably discovered by our system. The 5σ limit
overlap (∼0%-30%) or a high percentage overlap (close to              is the usual choice of most astronomical surveys (LSST,
100%). Around 27% of the events belong to the first cate-             LSST Science Collaboration et al. 2009; SDSS, York et al.
gory, showing that a significant number of candidates expe-           2000; PanSTARRS, Chambers et al. 2016, etc.) as well as
rience a large shift in their two-dimensional probability dis-        other GW follow-up efforts (e.g., GROWTH, Coughlin et al.
tribution. This shift is likely due to a variety of factors. For      2019c, and GOTO (O’Brien 2018)), and it implies that only
one, some multi-instrument detections did not factor in data          one out of 1.7 million sources above this threshold would be a
from one of the GW detectors when generating the initial              false detection. However, since in our case we are just look-
Bayestar skymap (e.g. S190720a, LIGO Scientific Collabo-              ing for point-like sources in images with well-known point
ration & Virgo Collaboration 2019f), and for other events,            spread functions (PSFs), our system is capable of filtering
the sky area decreased significantly between the two sky lo-          out many of these sources (which do not have stellar PSFs)
calisations (e.g. S200225q, LIGO Scientific Collaboration &           and significantly reducing the number of false positives. Our
Virgo Collaboration 2020k, with the inclusion of Virgo, and           current neural network system (see Sect. 4) has shown to be
S190630ag, LIGO Scientific Collaboration & Virgo Collabo-             able to reduce the number of false positives by a factor of
ration 2019e). In addition, disagreement between the time-            several thousand. This makes the 5σ limit provided here a
delays of the detected signals for the event and the results          conservative one.
of the parameter estimation, as well as unanticipated issues
(for example, the occurrence of scattered light glitches in
                                                                      3.1    Canada-France-Hawaii Telescope
some of the detectors in the case of S191213g, LIGO Sci-
entific Collaboration & Virgo Collaboration 2019o, which              Twelve hours of observing time have been awarded (PI:
possibly affected the sky position) may have led to the low           A. Coleiro) on the Canada-France-Hawaii 3.6-m world-class
percentage overlap for some events.                                   telescope (CFHT) for period 2020A in order to trigger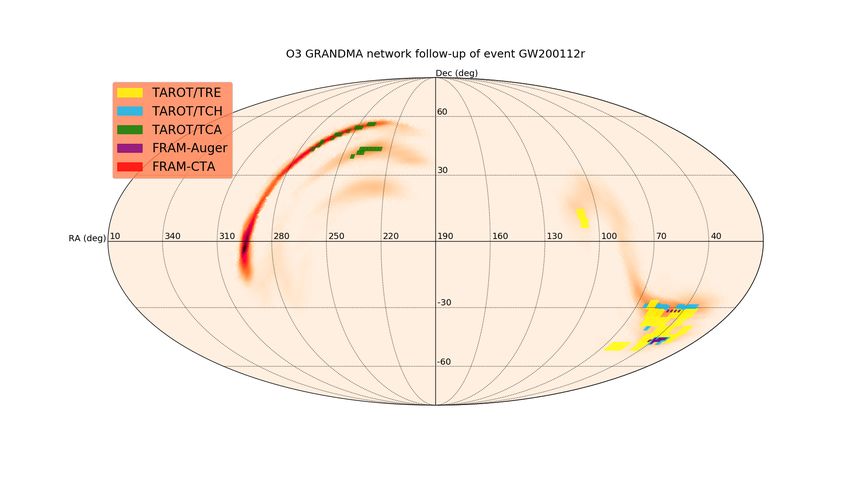
Observations of O3 alerts by GRANDMA 7
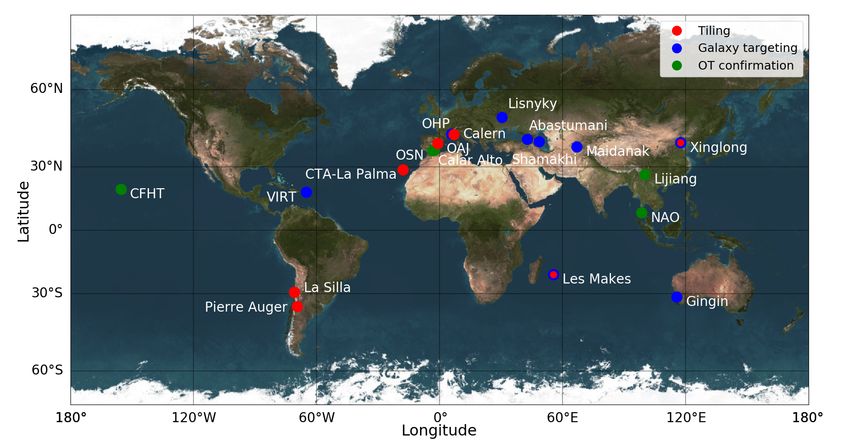
Figure 6. Locations of the 20 observatories involved in the GRANDMA network. The colour encodes the observation strategy followed
by telescopes at a given observatory: red for tiling, blue for targeting galaxies, green for following-up candidates.
Telescope Location Aperture FOV Filters Typical lim mag Maximum Night slot
Name (m) (deg) (AB mag) (UTC)
TAROT/TCH La Silla Obs. 0.25 1.85 × 1.85 Clear, g0r 0 i0 18.0 in 60s (Clear) 00h-10h
FRAM-Auger Pierre Auger Obs. 0.30 1.0 × 1.0 BV RC IC , Clear 17.0 in 120s (RC ) 00h-10h
CFHT/WIRCAM CFH Obs. 3.6 0.35 × 0.35 JH 22.0 in 200s (J) 10h-16h
CFHT/MEGACAM CFH Obs. 3.6 1.0 × 1.0 g0 r 0 i 0 z 0 23.0 in 200s (r 0 ) 10h-16h
Thai National Telescope Thai National Obs. 2.40 0.13 × 0.13 Clear, u0 g0r 0 i0 z 0 22.3 in 3s (g0 ) 11h-23h
Zadko Gingin Obs. 1.00 0.17 × 0.12 Clear, g0r 0 i0 IC 20.5 in 40s (Clear) 12h-22h
TNT Xinglong Obs. 0.80 0.19 × 0.19 BV g0r 0 i0 19.0 in 300s (RC ) 12h-22h
Xinglong-2.16 Xinglong Obs. 2.16 0.15 × 0.15 BV RI 21.0 in 100s (RC ) 12h-22h
GMG-2.4 Lijiang Obs. 2.4 0.17 × 0.17 BV RI 22.0 in 100s (RC ) 12h-22h
UBAI/NT-60 Maidanak Obs. 0.60 0.18 × 0.18 BV RC IC 18.0 in 180s (RC ) 14h-00h
UBAI/ST-60 Maidanak Obs. 0.60 0.11 × 0.11 BV RC IC 18.0 in 180s (RC ) 14h-00h
TAROT/TRE La Reunion 0.18 4.2 × 4.2 Clear 16.0 in 60s (Clear) 15h-01h
Les Makes/T60 La Reunion. 0.60 0.3 × 0.3 Clear, BV RC 19.0 in 180s (RC ) 15h-01h
Abastumani/T70 Abastumani Obs. 0.70 0.5 × 0.5 BV RC IC 18.2 in 60s (RC ) 17h-03h
ShAO/T60 Shamakhy Obs. 0.60 0.28 × 0.28 BV RC IC 19.0 in 300s (RC ) 17h-03h
Lisnyky/AZT-8 Kyiv Obs. 0.70 0.38 × 0.38 U BV RC IC 20.0 in 300s(RC ) 17h-03h
TAROT/TCA Calern Obs. 0.25 1.85 × 1.85 Clear, g0r 0 i0 18.0 in 60s (Clear) 20h-06h
FRAM-CTA ORM 0.25 0.43 × 0.43 Clear, BV RC z 0 , 16.5 in 120s (RC ) 20h-06h
IRIS OHP 0.50 0.4 × 0.4 Clear, u0 g0r 0 i0 z 0 18.5 in 60s (r 0 ) 20h-06h
T120 OHP 1.20 0.3 × 0.3 BV RI 20.0 in 60s (R) 20h-06h
OAJ/T80 Javalambre Obs. 0.80 1.4 × 1.4 r0 21.0 in 180s (r 0 ) 20h-06h
OSN/T150 Sierra Nevada Obs. 1.50 0.30 × 0.22 BV RC IC 21.5 in 180s (RC ) 20h-06h
CAHA/2.2m Calar Alto Obs. 2.20 0.27 / u 0 g0 r 0 i 0 z 0 23.7 in 100s (r 0 ) 20h-06h
VIRT Etelman Obs. 0.50 0.27 × 0.27 U BV RI, Clear 19.0 in 120s (Clear) 22h-04h
Table 2. List of telescopes of the GRANDMA collaboration and their photometric performance when using their standard setup.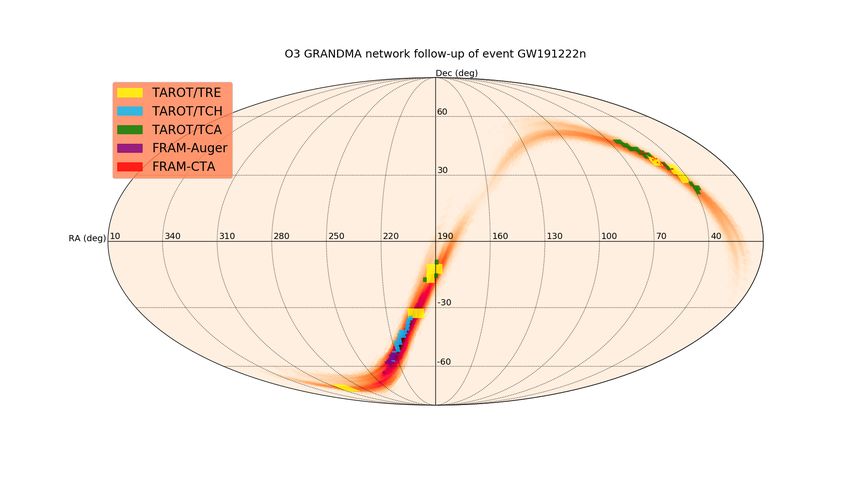
8     GRANDMA collaboration
            Telescope/Instrument           Location           Wavelength range        Spectral resolution λ/∆λ     Limiting mag
           2.2m CAHA/CAFOS             Calar Alto Obs.      3200-7000/6300-11000                  400                 20   in   1h
                ShAO/T2m               Shamakhy Obs.              3800 − 8000                    2000                 17   in   1h
           Xinglong-2.16/BFOSC          Xinglong Obs.             3600 − 9600                    1000                 18   in   1h
             GMG-2.4/YFOSC               Lijiang Obs.             3400 − 9100                    2000                 19   in   1h
                   GTC                       ORM           3630 − 7500/7330 − 10000           1018/2503               24   in   1h

Table 3. List of telescopes of the GRANDMA collaboration with spectroscopic capabilities.

target-of-opportunity photometric observations. The tele-                        Competitive time was obtained at the Observatorio de
scope is located on top of the Mauna Kea summit in Hawaii                 Javalambre (OAJ) for further observations with the T80
and is equipped with two imaging instruments: a 1◦ × 1◦                   telescope to obtain tiling observations (Proposal #1900160,
field-of-view optical camera, MegaCam, complemented by a                  PI: Kann, see Antier et al. 2020 for further details). Once
20 0 × 20 0 field-of-view near-infrared detector, WIRCam. By              again, the proposal was to observe 1.4◦ × 1.4◦ fields with
providing high-sensitivity and wide field-of-view optical (i 0 ,          an exposure time of 180 s each, reaching a typical limit-
r 0 and z 0 ) and near-infrared (J, H and Ks ) data, CFHT is an           ing magnitude of r 0 > 21.0 mag. In this proposal, based
essential element of the GRANDMA network, allowing for                    on the lessons learned from O3a, the requested time was
a fast identification of the EM counterpart and/or its phys-              increased to 12.46 hours (up to 100 tiles), including late-
ical characterisation. To strengthen their scientific impact,             time re-observations for image-subtraction purposes. The
we asked all data to be made freely available to the whole                second part of the proposal, multi-colour KN follow-up, was
community when delivered to the GRANDMA team. How-                        dropped as GRANDMA has access to facilities that are bet-
ever, due to the premature end of the scientific operations of            ter suited for such deep, narrow-field, targeted observations.
both CFHT and the GW observatories at the end of March                           The Gran Telescopio Canarias8 (GTC) is the
2020, no observations were triggered on CFHT during period                world’s largest single-aperture optical telescope, a 10.4m
2020A.                                                                    RitcheyâĂŞChrétien telescope with a segmented mirror lo-
                                                                          cated at 2267 m altitude at Roque de los Muchachos ob-
                                                                          servatory, La Palma, Canary Islands, Spain, at 28◦ 45 0 24 00 N,
3.2    FRAM network
                                                                          17◦ 53 0 31 00 W. It is equipped with a large suite of instruments.
FRAM (F/(Ph)otometric Robotic Atmospheric Monitor) is                     The following three are part of the proposal.
a series of small robotic telescopes primarily designed for a                    The Optical System for Imaging and low-Intermediate-
continuous atmospheric monitoring of astronomical sites in                Resolution Integrated Spectroscopy (OSIRIS) is a multi-
order to measure atmospheric transparency with high spatial               purpose imager and spectrograph mounted on the Nasmyth-
or temporal resolution. The original FRAM (Prouza et al.                  B focus. It is equipped with SDSS u 0 g 0r 0i 0 z 0 filters and mul-
2010) has been operated at the Pierre Auger Observatory in                tiple grisms and volume-phased holographic (VPH) gratings
Argentina for more than a decade, while three more FRAMs                  allowing for different spectral resolutions. We generally em-
(Janeček et al. 2019) are prepared to be used for a real-                ploy the R1000B (wavelength range 3630−7500 Å, resolution
time atmospheric monitoring at Cherenkov Telescope Array                  1018 at 5455 Å) grism and the R2500I (wavelength range
(CTA) locations. Two of the FRAM sites are equipped, in                   7330 − 10000 Å, resolution 2503 at 8650 Å) VPH grating,
addition to primary wide-field telephoto lenses, with larger              as well as g 0r 0i 0 z 0 imaging. To obtain spectra with sufficient
diameter traditional telescopes, with larger diameter tradi-              SNR, exposures of different integration times are employed:
tional telescopes intended for a follow-up and monitoring                 4×1200 s if the target has r 0 > 22 mag, 3×900 s for r 0 ∼ 20−22
observations of a wide range of astrophysical transient ob-               mag and 2 × 900 s if r 0 < 20 mag.
jects (gamma-ray bursts, variable stars, comets, etc). These                     The Especrografo Multiobjeto Infra-Rojo (Infrared
two telescopes are used for GRANDMA network observa-                      Multi-Object Spectrograph, EMIR), installed at the
tions. The first is a 30 cm f/6.8 telescope located at Pierre             Nasmyth-A focus, is a multi-channel IR imager and medium-
Auger observatory, Malargue, Argentina, and equipped with                 resolution spectrograph. For spectra, it can achieve a SNR
B, V, R and I filters, with a field-of-view of 60 0 × 60 0 and            of 7 for a 21 mag source with 4800 s of exposure in the Y J
pixel scale of 0.00 92/pix. The second is a 25 cm f/6.3 tele-             grism. In imaging, limiting AB magnitudes at 5σ of Y > 24.2,
scope located at Observatorio del Roque de los Muchachos,                 J > 23.6, H > 23.1 and KS > 22.2 mag can be achieved with
La Palma, Canary Islands, Spain, and is equipped with B,                  exposure times of 180 s, 240 s, 420 s, and 600 s, respectively.
V, R and z 0 filters, with a 26 0 ×26 0 field-of-view and 1.00 52/pix            Finally, for the purpose of observing the host galaxy
pixel scale.                                                              of a GW event in 3D, an application was made for time
                                                                          to use the Multi-Espectrógrafo en GTC de Alta Resolución
                                                                          para Astronomı́a (High-Resolution Multi-Spectrograph for
3.3    HETH group at IAA                                                  Astronomy at GTC, MEGARA) in Integral Field Unit (IFU)
The HETH (High-Energy Transients and their Hosts) group                   mode, covering a field of 12.00 5 × 11.00 3 with a spaxel size of
at the Instituto de Astrofı́sica de Andalucı́a (IAA) in                   0.00 62. Two grisms would be used to cover the spectral lines
Granada, Spain, continues to obtain competitive time at                   Hα, [N ii], and [S ii] as well as Hβ and [O iii].
multiple telescopes. The programmes at the Observatorio                          An award was made (Proposal 118-MULTIPLE-3/20A,
de Sierra Nevada (OSN, PI: Blažek) and the Centro As-
tronómico Hispano en Andalucà a (CAHA, PI: Kann) con-
tinue as detailed in Antier et al. (2020).                                8   http://www.gtc.iac.es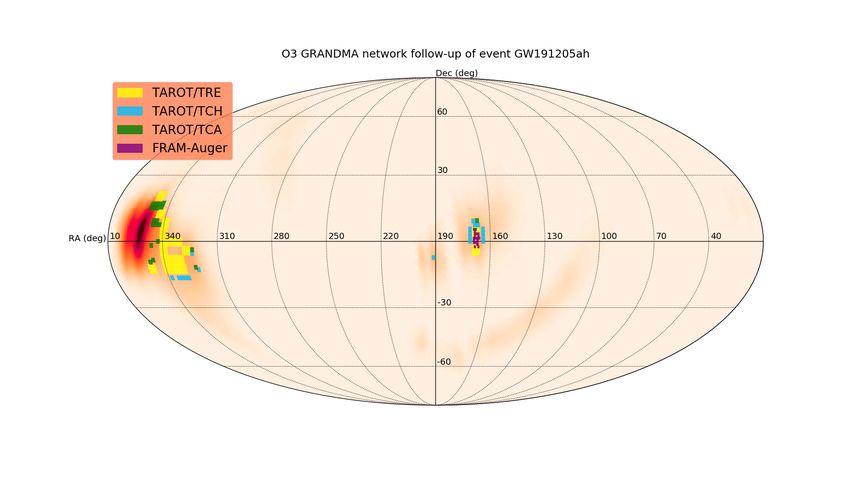
Observations of O3 alerts by GRANDMA                         9
PI: Kann) 8 hr of time with OSIRIS, 5 hr with EMIR, and          of the amateur telescopes, we coordinated their observations
2 hr with MEGARA, ranked “A”. The proposal was geared            with a strategy based on targeted searches for optical tran-
toward obtaining detailed observations of a single confirmed     sients located in promising host galaxies. From these two
EM counterpart of a GW event, and not meant for classi-          citizen observational campaigns, we obtained 57 follow-up
fying candidates. The observing time was valid for the last      images in total. A detailed description of the amateur ob-
two months of O3, in March and April 2020; however the           servation strategy and results can be found in Section 5.
worldwide COVID-19 pandemic caused GTC to be closed              GRANDMA is unique with this global initiative of citizen
down already in mid-March, shortly thereafter followed by        observers. O3 illustrated the huge potential for GW astron-
the end of O3b; no observations were ever triggered.             omy to vitalise sky observations and EM counterpart candi-
                                                                 dates, while also highlighting the need of training and coor-
                                                                 dinated joint analysis.
3.4   Thai National Telescope
The Thai national telescope located at Doi Inthanon Na-
tional Park is the main facility for the National Astronom-      4   UPDATE FOR THE ALERT
ical Research Institute of Thailand (NARIT). It is s 2.4 m           INFRASTRUCTURE, OBSERVATION
diameter, Ritchy-Chrétien telescope with an f /10 ratio, pro-       STRATEGY AND WEB INTERFACE AND
viding a plate scale of 8.00 6/mm at the two Nasmyth foci. The       DATA ANALYSIS USED IN GRANDMA
telescope system is an alt-az mount that can slew at a speed     We use a similar infrastructure – ICARE (Interface and
of 4°/s; therefore, it can track or acquire optical transient    Communication for Addicts of the Rapid follow-up in multi-
sources rapidly with a pointing accuracy at less than 3 00 ,     messenger Era) – for conducting coordinated observations of
and can track targets without autoguiding for ten minutes        GW alerts to that discussed in Antier et al. (2020). ICARE
or more with a pointing error of less than 0.00 5. There are     relies on the automatic reception of a GW alert, creation
many scientific instruments that can be used upon request        of an automatic observation plan that is then sent to the
for specific observations such as ULTRASPEC (Dhillon et al.      telescopes of the network, a central database, and cloud ap-
2014) with SDSS filters ranging from 330 to 1000 nm, spec-       plications to monitor the full network. Similar tools and in-
trographs varying from low to high resolution, and different     frastructure have been developed by other teams for a sim-
types of scientific cameras.                                     ilar purpose, i.e. the GROWTH Marshal (Kasliwal et al.
     The telescope was chosen to be built at the summit of       2019). In this section, we will outline some improvements
the highest mountain in Thailand (Lat. 18.57372E°, Long.         since the end of the O3a run, and in particular, during the
98.48219E°, Alt. 2457 m). Its observational area and see-        break between O3a and O3b. We are going to focus on work
ing conditions ensure dark skies for B = 21.5 and V =            done for the daily use version of ICARE that ran during
21.9 mag/arcsec2 , and the median seeing is stable through-      O3b9 . These modifications introduced some minor negative
out the night at ≈ 0.00 9.                                       impacts on the productivity of the collaboration at the level
                                                                 of the end-user communication (i.e. mostly with regard to
                                                                 the preparation of GCNs), which had no effect on observa-
3.5   VIRT
                                                                 tions, nor results reported in this manuscript.
The Virgin Islands Robotic Telescope (VIRT) is the primary            The python-based alert distribution system used by
research telescope at the University of the Virgin Islands and   GRANDMA during O3a remained mainly the same. Upon
is located at the Etelman Observatory on the island of St.       receiving a GW candidate alerts through a GCN, the cov-
Thomas in the US Virgin Islands (USVI). The facility is at       erage of the sky localisation region was generated for the
an elevation of 381 meters, latitude of 18.3N and longitude      GRANDMA collaboration telescopes (Table 2). For BBH
of 64.9W. The VIRT is a 0.5 m Schmidt-Cassegrain tele-           type events, only large field-of-view instruments were in-
scope with a Finger Lakes Instrumentation (FLI) Proline          cluded, while all instruments were involved for NSBH or
4240 back illuminated midband camera with a FLI John-            BNS type events if the posterior mean distance was below
son/Bessel UBV RI filter set. Typical seeing at the site is      300 Mpc. The resulting observation plans were then sent via
1.00 5 − 2.00 0.                                                 VOEvent as soon as the computation of a single plan was
                                                                 done using Comet10 . We improved this system for O3b by
                                                                 introducing a forwarding of the retraction notice to avoid
3.6   The kilonova-catcher citizen science program               unnecessary observations.
Since the beginning of O3, GRANDMA has developed a cit-               Our observation plan algorithm benefited from the
izen science program called kilonova-catcher (Antier et al.      continuous improvements of the GWEMOPT11 telescope
2020). It allows non-professional astronomers to add their       scheduling software (Coughlin et al. 2018a). Its latest version
observational capabilities to the GRANDMA network in or-         includes slicing sky localisations in right ascension to sepa-
der to perform optical follow-up of GW candidates on a best-     rately schedule different lobes in multi-lobed maps (Cough-
effort basis. During the O3b run, 33 kilonova-catcher users      lin et al. 2019a), and automatically determining fields capa-
around the globe registered to the GRANDMA GW alert              ble of being observed multiple times by several telescopes
stream. In Figure 7, we show the locations of the telescopes
they could operate during the O3b run.                           9 There is a more “universal version” of ICARE under develop-
     During the O3b campaign, the kilonova-cather program        ment now that O3 has ended
was active during the follow-up of two BNS merger candi-         10 https://comet.transientskp.org/en/stable/

dates S191213g and S200213t. Because of the narrow FoV           11 https://github.com/mcoughlin/gwemopt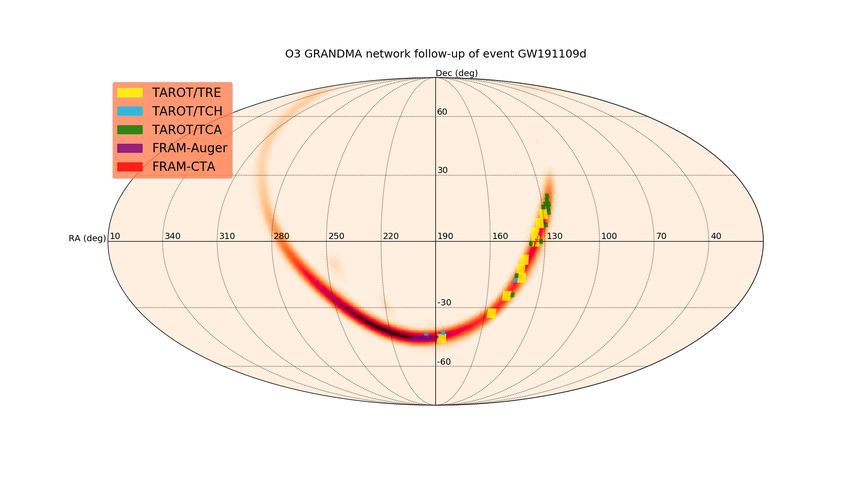
10       GRANDMA collaboration

Figure 7. Locations of the 34 telescopes involved in the GRANDMA citizen science program: kilonova-catcher. Some citizen astronomers
can operate several telescopes represented in this Earth map and also external remote facilities like the iTelescope Network (https:
//www.itelescope.net/), not represented here.

(Almualla et al. 2020). In doing so, the coverage of all             The detected sources are cross-matched to different cata-
our instruments, and especially the wide field-of-view tele-         logues (Pan-STARRS, Gaia, USNO-B1) using Xmatch, the
scopes, was improved. Our galaxy targeting strategy, i.e.            CDS cross-match service, to discard already known objects.
when small field-of-view telescopes were utilised to survey          A crossmatch with known Solar system objects is also per-
known galaxies) was also revised using the dedicated MAN-            formed using SkyBoT (Berthier et al. 2006). Particular at-
GROVE galaxy catalogue presented in Ducoin et al. (2020a).           tention is paid to the photometric calibration so that mag-
We adopted the selection of preferential galaxies based on           nitudes are expressed in the AB system. Image substrac-
dependence on galaxy stellar mass. The most problematic              tion with a reference image is performed using HOTPANTS
issue in Galaxy Targeting Mode from O3a, however, that               (Becker 2015), where Pan-STARRS stacked images can be
has since been addressed was the re-imaging of tiles when            used as reference. A Convolutional Neural Network algo-
observations were executed. In short, this issue arose from          rithm is trained to identify stellar sources and discard most
an avoidance of considering whether or not a given galaxy            of the cosmics, bad pixels or artefacts coming from the sub-
requested for observation resided in the field-of-view of a          traction process. In practice, during O3b Gmadet was used
preceding observation. As such, it resulted in an inefficient        to detect transient candidates in parallel to individual stan-
management of telescope observing time, and reduced the              dard online image processing made by the groups. The re-
area covered by our collaboration. This improvement addi-            sults presented in this work correspond for Gmadet only for
tionally benefited our strategy, as it led to extra time avail-      the OAJ observations of S200213t. The other results use the
able for observing the most promising events.                        individual image processing described in Antier et al. (2020)
     The start of the O3 run demonstrated the need for a             to allow for a direct comparison of our results against those
standard data reduction pipeline in order to homogenise the          for O3a. In case of gravitational-wave alert observations en-
photometry within the network. First, we still use individ-          gaged by GRANDMA, each individual image was processed
ual online image processing developed by the various groups          with a search for point sources detected at the 5-sigma or
such as TAROT and FRAM (Noysena et al. 2019). Secondly,              greater level. All the false positives which were deemed to
we continue the development of a common detection pipeline           be artifacts or cosmic rays, were eliminated by human in-
Gmadet 12 adaptable for each telescope: it makes use of the          spection.
popular AstrOmatic13 software (SCAMP, SWarp, PSFEx,
SExtractor) to perform the astrometric calibration, align
and stack images, estimate the PSF and extract sources.

12   https://github.com/dcorre/gmadet
13   https://www.astromatic.net
Observations of O3 alerts by GRANDMA 11
5 GRANDMA ELECTROMAGNETIC
FOLLOW-UP CAMPAIGN OF O3A AND O3B
100 O3a
5.1 Observational summary of GRANDMA for
O3b
Cumulative number of alerts (%)
O3a and O3b
80 Total
Over the eleven months of observations of the O3 cam-
paign, GRANDMA followed-up 49/56 candidate events :
27/33 for O3a and 22/23 for O3b. The observation efficiency 60
for GRANDMA is therefore ∼ 82% for O3a and 96% for
O3b. This high cadence is possible due to the organization 40
of the GRANDMA collaboration and the automated infras-
tructure discussed above. It is significantly above the re-
ported observational rate of other ground-follow-up teams, 20
aside from MASTER-Net (Lipunov et al. 2010) that reports
GCNs for every alert based on their automated observations. 0 0.4 0.8 1.5 3.0 6.0 12.0 50.0
Based on the GCN traffic, GRANDMA can be compared to Delay between the first GRANDMA obs and GW trigger time (hours)
GROWTH (about 30 % of alerts, Coughlin et al. 2019c),
GOTO (about 15% of alerts, O’Brien 2018), ENGRAVE
(about 5 % of alerts, Ackley et al. 2020), GRAWITA (about Figure 8. Cumulative distribution of the delay between the GW
25% of alerts, Salmaso et al. 2019), J-GEM (about 7% candidate/event trigger time and the first observation done by
GRANDMA. The minimal delay is about 15 min obtained with
of alerts, Kaneko & J-GEM Collaboration 2020), NOWT
both the TAROT and FRAM networks. About 50% of the sky lo-
(about 4% of alerts, Zhu et al. 2019), SAGUARO (about calisation areas of GW candidate/event alerts have been observed
11% of alerts, Lundquist et al. 2019), and SVOM (about with a minimal delay of 1.5 hours.
30% of alerts, Xin et al. 2020).
As shown in Figure 8, GRANDMA performed its first
observation at most 1.5 hours after the GW trigger time for mal coverage for a single alert was for S191204r, a BBH
more than half of the alerts, and at most 30 minutes for candidate event, at 550 deg2 , representing 90% of the sky
15 % of the alerts during O3. The minimal delay between localisation area. The lowest coverage was only 10 % of the
the GW trigger time and the first GRANDMA observation candidate S200225q’s most updated sky localisation area;
is 15 min, which includes the ∼ 5 min delay for sending the although the event was well localised, with a 90% credible
alert by LIGO/Virgo, ∼ 5 min for computing the observation region of 22 deg2 as seen in Appendix 7 and LIGO Scien-
plan, and ∼ 5 min for scheduling by the telescope. This has tific Collaboration & Virgo Collaboration (2020k), the vast
been achieved for both the TAROT and FRAM networks. majority of this region was behind the sun at the time of
Moreover, we see some improvement in terms of the rapid the event. In Figure 10, we can see the total sky coverage
response by GRANDMA between O3a and O3b: this is due of GRANDMA over the full O3 campaign. There is a clear
to improvements not only from the LIGO/Virgo infrastruc- distribution of northern and southern hemispheres among
ture system (Abbott et al. 2019b) but also the GRANDMA the different telescopes due to the global coordination (see
infrastructure improvements discussed above. This demon- Section 4). In total, we covered 9218 deg2 with six wide field-
strates once more the need for a heterogenous network of of-view telescopes, with multi-epoch observations for most
telescopes sharing joint tools to face the challenge of follow- of the fields. Our near real-time analysis did not find any in-
up of GW triggers and their requirement of rapid EM ob- teresting kilonova candidates (see Section 5 and Antier et al.
servational responses. Indeed, Metzger (2019) and references 2020).
therein, predict different light curve evolutions for the first According to Figure 2, the median distance of O3 BNS
hours after the merger of two compact objects (Arcavi 2018) merger candidates is ∼ 200 Mpc, corresponding to a dis-
depending on the properties of the initial binary system. tance modulus DM = 36.5. The median distance of BBHs
Early time observations after the merger (less than two hours is ∼ 1.3 Gpc (DM = 40.6). Considering an apparent limiting
and in different passbands if possible) might have provided magnitude of 17, this corresponds to approximate absolute
important constraints on properties of the fast ejecta com- magnitude non-detection limits of −19.5 for BNSs and −23.6
ponents, the composition of the ejected material, and the for BBHs. Figure 11 displays the absolute magnitude limit
heating rate for the unbound material. Other contribution based on the distance of each GW event versus the observed
channels or kilonova-precursors powered by free neutron de- area, and in Figure 12, versus the time of the first optical ob-
cay can also be ruled out by early observations (Metzger servations. It shows that only 12 GW events were observed
et al. 2015). by GRANDMA covering more than 80% of the error box.
GRANDMA covered 213 ± 173 deg2 on average for the The names of these events are indicated in the Figure 11. Es-
GW alerts during O3. As shown in Figure 9, more than 100 sentially only BBH events have full coverage of the credible
deg2 of the sky has been observed by the GRANDMA net- region; this is due to a combination of the statistical rate of
work for more than half of the alerts. We do not see major observability (see section 2.2), GRANDMA coverage capac-
differences in terms of sky coverage between O3a and O3b; ity (∼ 200 deg2 ), and the poor localisation of NSBH or BNS
however, improvements in the network-level scheduling as events. S190814bv, with a current classification of NSBH,
discussed in Coughlin et al. (2019a) in June 2019 led to a remains the exception. In conclusion, the disparity of alerts
significant increase of the maximum coverage reachable by during O3 in terms of localisation and their observational
GRANDMA (typically by a factor of 2). The total maxi- accessibility, the evolution of the localisation over time, as12 GRANDMA collaboration
5.3 The binary neutron star merger candidate
S191213g
100 O3a The GW candidate S191213g was detected on 2019-12-
O3b
Cumulative number of alerts (%)
13 04:34:08 UTC (LIGO Scientific Collaboration & Virgo
80 Total
Collaboration 2019o). The trigger was identified by Virgo,
LIGO-Hanford, and LIGO-Livingston with a reported false
60 alarm rate of 1.12 per year. It has a non-negligible proba-
bility of 23% of being of terrestrial origin, but assuming its
40 origin is astrophysical, the GWs were likely emitted from
a BNS (BNS 77%). Using the low-latency analysis (Ka-
padia et al. 2020), if it is astrophysical, it has more than
20 99% chance to have a remnant. The low-latency localisation
analysis (Singer & Price 2016) gave an estimated distance
0 of 195 ± 59 Mpc, and a 90% credible sky area localisation
0.0 10 50 100 200 300 400 500 1000 of 1393 deg2 (LIGO Scientific Collaboration & Virgo Col-
Joint coverage of the GRANDMA network per alert (in degree squares) laboration 2019o). The next day, the off-line analysis per-
formed by LALInference (Veitch et al. 2015) gave a distance
Figure 9. Cumulative distribution of the total sky coverage of of 201 ± 81 Mpc and a poorer localisation with a 90% sky
the GRANDMA network (in deg2 ) engaged for each GW candi- area of 4480 deg2 (LIGO Scientific Collaboration & Virgo
date/event alert. The distribution depends on the sky localisation Collaboration 2019q). As S191213g is considered a poten-
area size of the alerts and observability constraints, as discussed tial BNS event, several teams performed follow-up in both
in Section 2. neutrino and EM domains. Concerning neutrinos, no candi-
dates were found by IceCube (IceCube Collaboration 2019),
ANTARES (Ageron et al. 2019), or the Pierre Auger Obser-
well as the possible nature of candidates, shows a clear need vatory (Alvarez-Muniz et al. 2019). Concerning photons, at
for monitoring of routine observations of the alerts and calls high energies, INTEGRAL (Gotz et al. 2019), MAXI (Sugita
for rapid reactions at all times. In this way, by observing et al. 2019), AGILE (Verrecchia et al. 2019; Casentini et al.
all alerts during O3, GRANDMA has gained training and 2019), Fermi/GBM and LAT (Wilson-Hodge et al. 2019;
experience and is ready to observe a large number of alerts Cutini et al. 2019), Swift (Barthelmy et al. 2019), CALET
during the subsequent GW observation campaigns, starting (Marrocchesi et al. 2019), AstroSat (Shenoy et al. 2019) and
with O4. Insight-HXMT(Xiao et al. 2019) did not detect any tran-
sients in the 90% credible region. In the optical, ZTF pub-
lished two lists of nine and ten candidates, respectively (An-
dreoni et al. 2019; Stein et al. 2019). All of them were ruled
5.2 Report summary of GRANDMA observations out after spectroscopic vetting or looking at archival data
during O3b from wide field-of-view telescopes.
Specifically for O3b, we report our observations for the BBH
candidates in Table 4, and for the systems potentially con-
taining at least one NS in Table 5. The unmodeled GW
5.3.1 GRANDMA follow-up of the GW alert for S191213g
burst candidate S200114f is listed in Table 6. All the sky
localisation coverage are shown in Appendix 7. Observation plans were sent to 17 GRANDMA telescopes
We have similar observational results during O3b as in as the event distance enables the search for counterparts lo-
O3a in terms of coverage; at least 30% of the error boxes cated close to interesting galaxies. Unfortunately, the time
of the GW candidate events (using the most recently up- of the event was relatively close to the end of the European
dated sky localisation areas) were observed in 63% of the night, and combined with the minimal coverage possible,
cases. The TAROT network followed and reported search mostly constrained to the Northern hemisphere; rapid ob-
results (Noysena et al. 2019) for all of the GW alerts sent servations by GRANDMA were not an easy task. Due to
by GRANDMA, and FRAM only missed one of them. We the low significance of the event, we preferred not to en-
note also the participation of the OAJ telescope for the gage our ToO time and instead concentrated our effort on
BNS candidate S200213t (LIGO Scientific Collaboration & following up some possible EM candidates reported by oth-
Virgo Collaboration 2020h; Blazek et al. 2020a). The par- ers. Two of our robotic telescopes performed observations
ticipation of the narrow field-of-view telescopes has been re- to follow up the event: FRAM-CTA-N and TCA. FRAM-
duced in O3b to host galaxy targeting searches due to a CTA-N started observations 53 min after the GW trigger in
low number of GW candidates with a most probable lu- the Rc band and TCA started 2858 min after the GW trig-
minosity distance below 300 Mpc; this consisted of three ger with no filter. These observations covered about 3.4%
events (LIGO Scientific Collaboration & Virgo Collabo- of the cumulative probability of the Bayestar sky localisa-
ration 2020h, 2019o, 2020a). However, we can highlight tion area created at 2019-12-13 04:36:53 (UTC), representing
the participation of the Lisnyky and Tingshua groups for only 1% of the most recently updated LALInference localisa-
S191213g, the UBAI group for S191213t, and the VIRT tion (LIGO Scientific Collaboration & Virgo Collaboration
group for S200213t. We also highlight the participation of 2019r). No significant transient candidate was found during
amateur astronomers for S191213g and S200213t. our real time analysis. We also note that none of the candi-Observations of O3 alerts by GRANDMA 13
Table 4. Summary of the GRANDMA observations during the last five months of O3 for BBH candidates. Observations are not
necessarily continuous during the time interval. S191110x S191213ai, S191120at, S191124be, S191212q, S191225aq, S200108v, S200303ba,
were retracted by the LVC due to data quality issues in the detectors. 90% c.r. corresponds to the 90% credible region of the latest
sky localisation area sent by LIGO-Virgo ( a , when only the “Bayestar sky localisation” is available), δ t to the delay with respect to
the trigger time, ∆ T to the duration of the observations, Prob (%), Area (deg2 ) to the coverage of GRANDMA compared to the latest
revision of the sky localisation area in percentage and in squares degrees. Limiting magnitudes are computed from 5σ threshold for
source extraction.
Alert Time Type Dist 90% c.r. Telescope δt ∆T Lim. mag Prob Area
(UTC) (Mpc) (deg2 ) (h) (h) (%) (deg2 )
GRANDMA 49.0 16.2 17-18 64.1 289
FRAM-Auger 57.6 1.6 16.8 3.6 19
FRAM-CTA 58.7 1.5 15.9 0.2 4
S191105e 14:35:21 BBH (95%) 1183 ± 281 643
TCA 56.1 6.4 18 1.1 25
TCH 57.4 7.9 18 33.6 46
TRE 49.0 8.47 17 57.3 242
GRANDMA 0.4 31.2 17-18 18.0 263
FRAM-Auger 5.7 1.8 16.0 2.8 19
FRAM-CTA 0.4 2.7 16.0 0.5 5
S191109d a 01:07:17 BBH (>99%) 1810 ± 604 1487
TCA 1.0 26.0 18 2.1 43
TCH 29.5 2.2 18 1.0 11
TRE 20.2 2.5 17 12.3 191
GRANDMA 10.6 49.1 18 27.9 130
FRAM-Auger 11.3 2.2 16.2 6.1 17
S191129u 13:40:29 BBH (100%) 742 ± 180 852
TCA 10.6 5.5 18 4.6 63
TCH 10.7 49.0 18 21.9 63
GRANDMA 0.9 58.6 18 89.1 550
FRAM-Auger 7.4 1.7 16.7 0.1 20
S191204r a 17:15:26 BBH (100%) 678 ± 149 103 TCA 0.9 57.1 18 0.8 68
TCH 7.5 30.4 18 18.2 68
TRE 1.0 47.8 17 72.9 417
GRANDMA 0.6 56.3 17-18 37.3 288
FRAM-Auger 5.0 1.4 16.7 2.1 20
FRAM-CTA 46.1 0.2 17.5 0.7 1
S191215w 22:30:52 BBH (>99%) 1770 ± 455 361
TCA 42.6 5.1 18 18.6 25
TCH 2.2 54.7 18 13.0 36
TRE 0.6 47.3 17 8.6 226
GRANDMA 3.8 162.1 17-18 42.8 85
FRAM-Auger 3.8 1.1 15.1 1.8 8
FRAM-CTA 21.6 1.5 17.4 4.4 5
S191216ap 21:33:38 BBH (99%) 376 ± 70 253
TCA 19.4 146.4 18 40.1 67
TCH 27.6 122 18 0.7 11
GRANDMA 0.4 51 17-18 23.8 292
FRAM-Auger 0.4 28.4 16.3 3.0 20
FRAM-CTA 0.7 1.5 16.6 0.3 5
S191222n 03:35:37 BBH (>99%) 2518 ± 679 1850
TCA 0.7 1.2 18 3.6 71
TCH 3.0 48.5 18 8.8 56
TRE 12.5 30.5 17 10.0 157
GRANDMA 0.3 58.8 17-18 16.9 500
FRAM-Auger 9.5 5.2 15.4 0.5 15
FRAM-CTA 13.5 25.6 16.6 0.7 5
S200112r 15:58:38 BBH (>99%) 1125 ± 289 4004
TCA 1.5 48.8 18 5.8 71
TCH 8.6 50.5 18 2.4 63
TRE 0.3 47.9 17 8.7 379
GRANDMA 0.3 166.3 17-18 14.8 278
FRAM-Auger 20.8 1.7 15.8 1.6 19
FRAM-CTA 15.3 1.5 17.4 0.4 5
S200115j 04:23:09 MassGap (>99%) 340 ± 79 765
TCA 12.9 153.8 18 3.8 71
TCH 0.3 164.9 18 6.5 68
TRE 11.7 28.8 17 7.4 174
GRANDMA 0.4 54.7 17-18 11.2 97
FRAM-Auger 0.45 5.6 17.8 2.6 20
FRAM-CTA 0.4 4.8 16.8 0.4 4
S200128d 02:20:11 BBH (97%) 3702 ± 1265 2293
TCA 19.1 3.2 18 1.5 22
TCH 2.6 52.5 18 8.7 67You can also read