Draft Regional Land Transport Plan 2015 2025
←
→
Page content transcription
If your browser does not render page correctly, please read the page content below
Draft Regional Land
Transport Plan
2015 - 2025

2014/EXT/1410
Contents
Section 1: Context of the Regional Land Transport Plan                   .........................................................................    2
          1.1               .....................................................................................................
                    Purpose of the Plan                                                                                                               3
  1.2 Responsibilities of Transport Organisations .......................................................................                             3
		1.2.1       Central Government .........................................................................................                            3
		    1.2.2   Regional and Local Government .........................................................................                                 3
  1.3 The National and Regional Policy Context .........................................................................                              4
		    1.3.1   Government Policy Statement on Land Transport 2015 (draft) ....................................                                         5
      1.3.2   New Zealand Energy Efficiency and Conservation Strategy 2011-2016 ........................                                              5
		    1.3.3   The One Plan .................................................................................................                          5
  1.4 Process for the Development of the Plan ..........................................................................                              5
                        .........................................................................................................
Section 2: The Strategic Context                                                                                                                      6
  2.1 Setting the Scene – The Manawatu-Wanganui Region .........................................................                                      7
		2.1.1         Geography .....................................................................................................                       7
		2.1.2         Population ......................................................................................................                     8
		2.1.3         Age Distribution ...............................................................................................                      9
      2.1.4     Socio-economic Factors ....................................................................................                           9
		2.1.5         Dwelling Occupancy .........................................................................................                          10
      2.1.6     Vehicle Ownership ...........................................................................................                         10
      2.1.7     Vehicle Kilometres Travelled ...............................................................................                          11
		    2.1.8     Regional Economy and its Impact on Transport Demand ..........................................                                        11
  2.2 The Issues .................................................................................................................                    13
		                  2.2.1      Integrated land use and transport planning to produce a more resilient network; and
			                            to provide a more structured roading hierarchy to accommodate anticipated future
			freight growth                                ..................................................................................................   14
		                  2.2.2      Improved linkages to other regions – of importance links to the south of the Region
			                            and to the north of the regional border between the Desert Road Summit and Taupo                             .......   15
		                  2.2.3      The need to maintain improvements to secondary strategic links that are playing an
                               increasing role as east-west links and alternative routes and for tourism/economic
			development purposes                                      ......................................................................................   16
		                  2.2.4      Anticipated population and economic growth in the Palmerston North and Manawatu
			                                                                               ...............................................
                               area, the impacts this will have on freight distribution                                                               17
		                  2.2.5      The need for continued improvements to road safety in the Region .............................                         18
                    2.2.6      Increasing pressure on the Regions rural roading network, particularly with increased
                               forest harvesting and agricultural use and potential increases in tourism traffic                  ...............     19
          2.3       Objectives ..................................................................................................................     20
Contents
          2.4        Strategic Priorities ......................................................................................................       21
                     2.4.1      Strategic Priority 1 Efficient road maintenance and delivery ......................................                    22
		                   2.4.2      Strategic Priority 2 Improved connectivity of key strategic routes ...............................                     22
		                   2.4.3      Strategic Priority 3 Plan for and proactively respond to demographic change and impacts
			                                  ..........................................................................................
                                of land use change                                                                                                     23
		    2.4.4    Strategic Priority 4 Increased focus on pedestrians and cycling ..................................                                      24
      2.4.5    Strategic Priority 5 Efficient, accessible and affordable public transport networks ...........                                         24
      2.4.6    Strategic Priority 6 An appropriate network of tourism routes .....................................                                     25
  2.5 Policies and Measures to Achieve the Priorities ..................................................................                               25
		2.5.1 Strategic Priority 1 Efficient road maintenance and delivery .......................................                                           26
		    2.5.2    Strategic Priority 2 Improved connectivity of key strategic routes ................................                                     27
			                             Strategic Priority 3: Plan for and proactively respond to demographic change and impacts
			                             of land use change ...........................................................................................         29
			                             Strategic Priority 4: Increased focus on pedestrians and cycling .................................                     30
                                Strategic Priority 5: Efficient, accessible and affordable public transport networks ...........                       30
                                Strategic Priority 6: An appropriate network of tourism routes .....................................                   32
Section 3: Funding the Plan ................................................................................................................           33
          3.1        Anticipated Revenue Sources ........................................................................................              34
          3.1.2      Revenue from the National Land Transport Fund         ................................................................            34
          3.1.2      Contribution of Road Policing Activity to the Horizons Regional Land Transport Plan...................                            35
          3.1.3      Local Revenue Sources ................................................................................................            35
          3.1.4      Other Sources of Revenue ............................................................................................             36
          3.2        Ten-year Forecast of Revenue and Expenditure .................................................................                    37
Section 4: Regional Programme of Transport Activities                   ..........................................................................     38
          4.1        Prioritised List of Activities .............................................................................................      39
          4.2        Full List of Activities .....................................................................................................     42
Section 5: Inter-regional Activities         .......................................................................................................   45
Section 6: Monitoring of the Plan          .........................................................................................................   48
Section 7: Appendices    .......................................................................................................................       50
          Appendix 1: Legislative Alignment with the LTMA ...........................................................................                  51
          Appendix 2: Key Findings of the 2010 Joint Transport Study .............................................................                     52
          Appendix 3: Legislative Requirements and Policy Framework ...........................................................                        56
          Appendix 4: Significance Policy ..................................................................................................           57
Draft Regional Land Transport Plan | 2015 - 2025 1
THE HORIZONS REGIONAL
                                                          LAND TRANSPORT PLAN
                                                         (THE PLAN) SETS OUT THE
                                                        STRATEGIC DIRECTION FOR
                                                         LAND TRANSPORT IN THE
                                                          MANAWATU-WANGANUI
                                                        (HORIZONS) REGION OVER
                                                            THE NEXT 10 YEARS.

    Section 1
    CONTEXT OF THE REGIONAL
    LAND TRANSPORT PLAN

2    Draft Regional Land Transport Plan | 2015 - 2025
1.1   PURPOSE OF THE PLAN
      The Horizons Regional Land Transport Plan (the Plan) sets out the strategic direction for land transport
      in the Manawatu-Wanganui (Horizons) Region over the next 10 years. It describes what our Region is
      seeking to achieve for the land transport system and how this will contribute to an effective, efficient and
      safe land transport system in the public interest as required under the Land Transport Management Act
      2003 (LTMA).

      The Plan also incorporates the Regional Land Transport Programme (RLTProgramme), which identifies
      the land transport activities the Region wishes to prioritise for inclusion in the National Land Transport
      Programme (NLTP) for subsequent funding subsidy. This is the first plan to combine the Regional Land
      Transport Strategy (RLTS) and Regional Land Transport Programme (RLTP) into one document which,
      under new LTMA requirements, replaces the former strategy and programme. The Plan has been
      developed by the Horizons Regional Transport Committee (RTC) on behalf of Horizons in collaboration
      with key regional transport partners and stakeholders, and in accordance with statutory requirements
      under the LTMA as outlined in Appendix 3.

1.2   RESPONSIBILITIES OF TRANSPORT ORGANISATIONS

1.2.1 CENTRAL GOVERNMENT
      The legal and policy framework for all transport activities in New Zealand is set by the Ministry of
      Transport, headed by its Minister.

      The Minister works through the Ministry of Transport to head the group of Central Government
      organisations which have responsibility for transport in New Zealand. The Ministry manages the interface
      with a number of Crown entities that have varied responsibilities for sectors of the transport system.

      These include:
      •   The New Zealand Transport Agency (the Transport Agency), which has responsibility for land transport
          planning; managing the state highway system; regulating access to and participation in, the land
          transport network; promotion of land transport safety and sustainability; and allocation of Government
          funding for land transport.
      •   Transport Accident Investigation Commission (TAIC). The principal purpose of TAIC is to determine the
          circumstances and causes of accidents and incidents with a view to avoiding similar occurrences in
          future. TAIC investigates significant aviation, rail, and marine accidents and incidents.
      •   Maritime New Zealand. The responsibilities of this organisation include maritime safety, security and
          marine environment protection.
      •   Civil Aviation Authority (including the Aviation Security Service) has responsibility for regulating civil
          aviation in New Zealand.
      •   The New Zealand Railways Corporation (trading as KiwiRail Group) is a State Owned Enterprise that
          is responsible to the Crown but operates as a commercial entity.

1.2.2 REGIONAL AND LOCAL GOVERNMENT
      At a local level, the territorial authorities of the Region are responsible for the management of local roading
      networks, while the regional council has statutory transport planning responsibilities through the RTC for
      the preparation of the Plan. The regional council is also responsible for the identification of essential public
      transport services and the provision of those services where necessary.

                                                                         Draft Regional Land Transport Plan | 2015 - 2025   3
1.3   THE NATIONAL AND REGIONAL POLICY CONTEXT
       The key to shaping the Plan is the requirements as set out in the LTMA as well as the Government’s
       objectives and priorities as expressed through the Government Policy Statement on Land Transport
       Funding 2015/16 – 2024/25 (GPS).

       A key priority focus of the Government is building a more productive and competitive economy, as
       articulated in the ‘Government’s Business Growth Agenda – Future Direction 2014’. The right of level of
       investment, infrastructure and delivery is crucial to achieving this, including a fast and efficient roading
       network connecting our regional economies.

1.3.1 GOVERNMENT POLICY STATEMENT ON LAND TRANSPORT 2015 (DRAFT)
       The Government has a strong focus on driving improved performance from the land transport system
       and investing in new transport infrastructure. This is primarily articulated through the draft GPS. The GPS
       sets out the strategic direction for land transport in New Zealand and outlines the results the Government
       wishes to achieve from allocation of transport funds from the National Land Transport Fund (NLTF). The
       Plan must be consistent with the GPS.

       The Government’s strategic direction for land transport is to pursue improved performance from the land
       transport system by focusing on three core priorities:
       •    economic growth and productivity
       •    road safety
       •    value for money

       The GPS also sets out national land transport objectives and the long term results the Government wishes
       to achieve under each objective. The objectives seek a land transport system that:
       •    addresses current and future demand
       •    provides appropriate transport choices
       •    is reliable and resilient
       •    is a safe system, increasingly free of death and serious injury
       •    appropriately mitigates the effects of land transport on the environment.

1.3.2 NEW ZEALAND ENERGY EFFICIENCY AND CONSERVATION STRATEGY 2011-2016
       The New Zealand Energy Efficiency and Conservation Strategy 2011-2016 (NEECS) is a companion
       strategy to the New Zealand Energy Strategy 2011-2021. It is specifically focused on the promotion of
       energy efficiency, energy conservation and renewable energy. NEECS sets out six objectives for six key
       sectors, including transport. The objective for transport is “a more energy efficient transport system, with a
       greater diversity of fuels and alternative energy technologies”. The strategy also sets out targets and the
       means by which these targets will be achieved. It is a requirement of the LTMA that NEECS is taken into
       account in developing regional land transport plans.

1.3.3 THE ONE PLAN
       The One Plan1 (as Amended by Environment Court Decisions) is the Region’s guiding policy document
       that defines how the natural and physical resources of the Region will be cared for and managed by the
       Regional Council, Territorial Authorities and the community. The One Plan combines the requirements for
       preparation of a Regional Policy Statement and a Regional Plan under the Resource Management Act
       1991. The LTMA requires the Plan to take into account the relevant regional policy statements or plans.

 4    Draft Regional Land Transport Plan | 2015 - 2025
1.4   PROCESS FOR THE DEVELOPMENT OF THE PLAN
      A significant amount of work went to producing the operative RLTS 2010-2040. While the operative RLTS
      was being developed, the Region commenced a Joint Transport Study (JTS) of the Palmerston North-
      Manawatu area, involving Horizons , the Transport Agency, Palmerston North City Council and Manawatu
      District Council. The aim of the study was to develop an evidence-based network hierarchy for the area,
      testing the validity of a number of proposals which have been promoted by these organisations over recent
      years. The recommendations from this study informed the operative RLTS for this area. The JTS formed
      a major component of the operative RLTS and the RTC considers that it is as relevant today as it was in
      2010. The Government’s focus on economic growth and productivity has largely remained unchanged over
      this period as well.

      Most of the recommendations of the JTS have yet to be actioned. The RTC considers it is not appropriate
      that the Plan should re-litigate the work of the JTS or the operative RLTS. Therefore development of
      the Plan was done in a way to refine the current RLTS rather than re-write it, while making sure that the
      Plan still gives effect to the new legislation underpinning it. The process for preparing the Plan began in
      early-2014 with two workshops that followed the Transport Agency’s Investment Logic Mapping (ILM)
      process identifying regional issues, possible performance indicators and measures aimed at addressing
      the identified issues.

      A Transport Issues document was then released in April 2014 for targeted consultation (local and central
      government agencies, the transport sector, and various interested organisations) to truth test the issues
      identified through the ILM process.

      Two issues affecting the Horizons Region were identified in the document:
      •       Uncertainty around land use and transport planning integration means it is increasingly difficult to
              maintain the roading asset; and
      •       Disjointed planning across the network means it is difficult to prioritise resilience and structural
              investment around freight routes.

      These two issues recognised that the majority of the Region’s population and economic growth is occurring
      in the Palmerston North and the Manawatu. In particular, urban growth on the north-eastern boundary of
      Palmerston North City is creating conflict conflict with activities in the North-East Industrial Zone which is
      likely to impact on the efficiency of freight transport trips. If potential issues are not addressed, Palmerston
      North’s efforts to become a central distribution hub for the lower North Island could be limited.

      However, feedback received through this targeted consultation confirmed that the issues in the operative
      RLTS have not changed significantly since it was published in 2010. Therefore the issues in section 2.2
      below largely reflect those of the operative RLTS as well as those raised through the Transport Issues
      document. A number of workshops of the Regional Advisory Group (an advisory committee to the RTC
      made up of representatives from the territorial authorities, the Transport Agency and Horizons) and further
      meetings of the RTC have:
      •       refined the Plan’s issues and objectives;
      •       developed a set of specific strategic priorities that the Plan will focus on over its lifetime;
      •       refined the policies and measures set out in the Plan as a means of addressing the Region’s transport
              issues and guiding development of the transport system for the next ten years;
      •       outlined how the Plan will be implemented; and
      •       considered likely funding sources over the life of the Plan.

      1
          As of April 2014 the current version of the One Plan is the Proposed Decisions. It is expected that the One Plan will be made fully operative before the end of 2014.

                                                                                                                 Draft Regional Land Transport Plan | 2015 - 2025                 5
THE MANAWATU-
                                                         WANGANUI REGION IS A
                                                         PREDOMINANTLY RURAL
                                                        REGION WITH A FEW MAIN
                                                        CENTRES OF POPULATION.

    Section 2
    THE STRATEGIC CONTEXT

6    Draft Regional Land Transport Plan | 2015 - 2025
2.1 SETTING THE SCENE – THE MANAWATU-WANGANUI REGION
The Manawatu-Wanganui Region is a predominantly rural region with a few main centres of population. It
lies in the lower central North Island and, because of its central location its has good land and air transport
connections to the rest of New Zealand.
While the Region is home to around 5% of New Zealand’s population, it only accounts for 4% of national
GDP and 4.9% of national employment2. However, economic outcomes vary across the Region.
Although the Region has not experienced the population and economic growth of some of the more
densely populated regions in New Zealand, it nevertheless has a number of unique features that contribute
to the way in which goods and people are transported through and around the Region. This has led to the
promotion of the Region’s involvement in the distribution industry, which is heavily dependent on a reliable
transportation network.
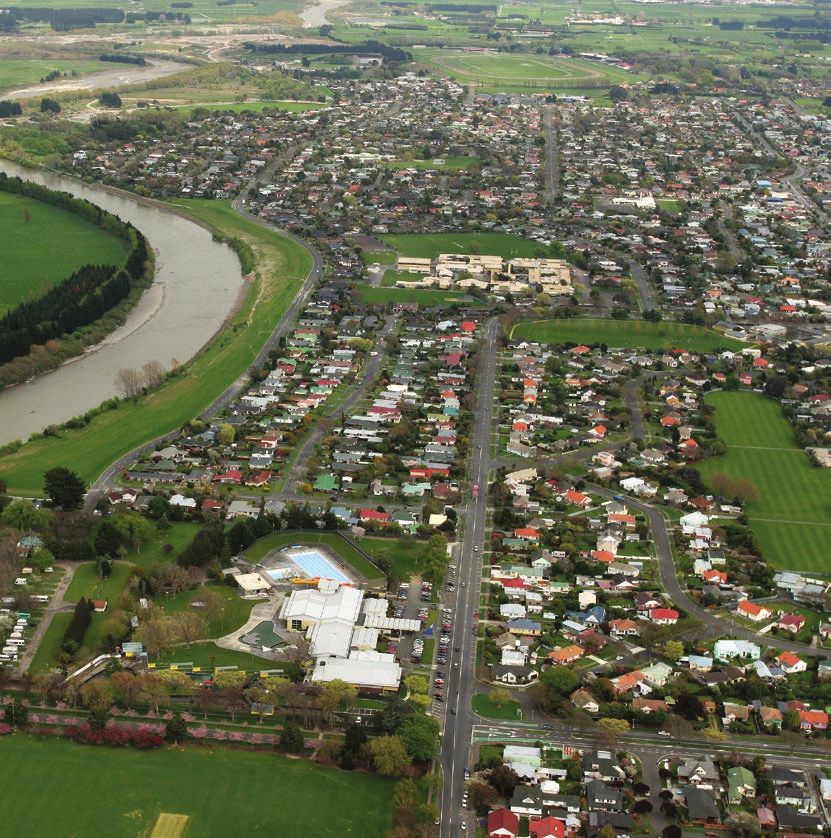
Palmerston North and Manawatu are now recognised as the hub of the growing freight distribution industry
because of their location in the central-lower North Island, connecting to the surrounding regions of
Taranaki, Hawkes Bay, Waikato and Wellington via the State Highway, rail and air networks. However, the
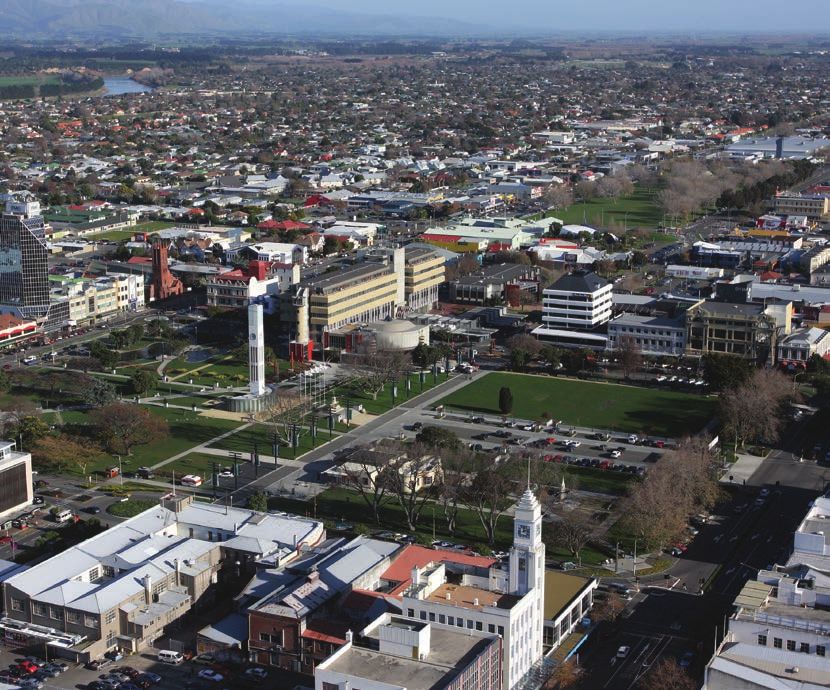
hubbing concept is not limited to Palmerston North. Wanganui also has a growing hubbing centre based
on the Heads Road Industrial Estate, and there is potential for future hubbing growth in the Horowhenua
District when the Wellington Airport to north of Levin Road of National Significance project is complete.
A goal of Horizons Region is facilitating regional economic growth and with this in mind the Ministries
of Business, Innovation and Enterprise, and Primary Industries have commissioned a Regional Growth
Study, focusing on agri-business, that will investigate ways to prioritise investment and economic growth
opportunities for all districts within the Region over the next 30 years. Transport is a key enabler of growth
so making sure the Plan and this Strategy synthesise is a key to unlocking potential growth.
2.1.1 GEOGRAPHY
The Region is the second largest local authority region in the North Island and the sixth largest in New
Zealand, with 8% of New Zealand’s land mass contained within its boundaries.
There are seven local authorities that are almost completely contained within the Region, with small
portions of Waitomo District, Stratford District and Taupo District also included within regional boundaries.3
The seven main districts are:
• Ruapehu • Wanganui
• Manawatu • Rangitikei
• Palmerston North City • Tararua
• Horowhenua
The Region’s physical geography is relatively varied, with the volcanic plateau to the north, the alluvial
plains of the Manawatu River to the south and the Ruahine and Tararua Ranges bisecting the length of the
Region. Both the Tasman Sea and the Pacific Ocean border the Region.
2
Regional Economic Activity Report 2014, Ministry of Business, Innovation and Employment.
3
Under a Memorandum of Understanding between Stratford District, Taranaki Regional Council and Horizons Regional Council, transport planning responsibilities for the
portion of Stratford District which lies in the Horizons Region are undertaken by Taranaki Regional Council.
Draft Regional Land Transport Plan | 2015 - 2025 7The Region’s climate is comparatively mild with greater extremes of temperature inland. Sunshine hours
are in accordance with the national average, with the exception of Palmerston North which experiences a
greater proportion of cloudy days. Rainfall is below the national average, with Palmerston North receiving
960 mm per annum. Rainfall through the rest of the Region varies between 1,000 mm and 2,000 mm
per annum.
2.1.2 POPULATION
The people of the Region, and more importantly where and how they live, will play a critical role in shaping
the needs of the transport system. Over the course of the Plan the population will become more urbanised,
older and will live in smaller households.
With the exception of the area now covered by Palmerston North City and Manawatu District, all the
territorial authorities are expected to experience population decline, although losses in Horowhenua District
are anticipated to be minimal. All are expected to see large increases in the proportion of the population
aged 65 and over and all will see average household sizes continue to decline. The transport needs of an
ageing population will also have to be considered as many people over the age of 65 become transport
disadvantaged and reliant on public transport (including taxis) and friends and family to meet their needs.
The increasing population of the area now covered by Palmerston North City and Manawatu District will
lead to pressures on the transport systems of these authorities, particularly with regard to commuter
movements between and within them. Conversely, population decline in the other parts of the Region will
bring about its own set of transport problems, such as a declining ratepayer base to fund transport projects.
However, some of this population loss will be offset by rates contributions from non-resident ratepayers
owning second and holiday homes in the Region, particularly in the Ruapehu and Horowhenua Districts.
At the 2013 Census, the Usually Resident Population of the Region was 222,672, which was an increase
of less than 0.1% on the 2006 population of 222,423.
Figure 1 below shows the estimated resident population of each district and population change since 1996.
ESTIMATED RESIDENT POPULATION AT 30 JUNE 1996, 2001, 2006, AND 2013 (2013 - BASE)
1996 - 2013 2006 - 2013
YEAR AT 30 JUNE 1996 2001 2006 2013 average annual average
change annual
change
Ruapehu district 17,300 15,000 14,050 12,450 -1.6% -1.7%
Wanganui district 46,000 44,400 43,800 43,500 -0.3% -0.1%
Rangitikei district 16,750 15,500 15,150 14,550 -0.7% -0.6%
Manawatu district 26,700 26,300 26,800 28,500 -0.3% -0.9%
Palmerston North city 77,100 77,100 80,800 83,500 -0.4% -0.5%
Tararua district 19,500 18,350 18,050 17,450 -0.6% -0.5%
Horowhenua district 30,800 30,600 30,600 31,200 -0.1% -0.3%
Horizons North-West 80,150 74,900 73,000 70,500 -0.6% -0.5%
Horizons South-East 154,100 152,350 156,250 160,650 -0.2% -0.4%
Manawatu-Wanganui Region 234,500 227,500 229,400 231,200 -0.1% -0.1%
New Zealand 3,732,000 3,880,500 4,184,600 4,442,100 -0.9% -0.9%
FIGURE 1: POPULATION CHANGE (CENSUS DATA)
Note: Due to a boundary change that ceded land to Palmerston North City from Manawatu District, the 2013 Census population of both territorial authorities are not comparable to
the 1996, 2001 and 2006 Census populations.
8 Draft Regional Land Transport Plan | 2015 - 2025Statistics New Zealand’s population projections, which are based on population estimates rather than
Usually Resident Population figures, indicate an expected overall 4.4% increase in the Region’s population
by 2031 (medium growth scenario).
2.1.3 AGE DISTRIBUTION
All territorial authorities within the Region will have a greater number of people aged over 65 years in
2031, when compared with 2011. This reflects the national trend of an ageing population and will see the
regional median age rise to 40.9 years by 2031 from 37.6 in 2011. This overall ageing of the population
will have a major influence on districts within the Region, with the greatest effects noticeable in the districts
that are likely to have the highest median ages. For example, Statistics New Zealand’s medium population
projection scenario for the Horowhenua District predicts a marginal decrease in population and a median
age of 51.5 years by 2031, up from 44.8 years in 2011. Such changes in demographic structure are likely
to have a significant impact on the transport needs of the population as the more elderly the population
becomes, the more dependent they become on others for their transportation needs. This results in less
need for private vehicles and a greater need for public transport such as buses or taxis.
2.1.4 SOCIO-ECONOMIC FACTORS
Income is a determinant of travel as the more people earn, the more they tend to travel. The median
personal income (half earn more, half earn less) of the Region at the 2013 Census was $25,000, which
is lower than the national median income of $28,500. Median personal incomes in the Region range from
$28,400 in Manawatu District to $21,800 in Horowhenua District. Historically, median personal incomes in
the Region have always been lower than the national average.
Closely related to this, median household incomes in the Region are well below the national median. At
the 2013 Census, the median household income was $50,000 while the national median was $63,800.
Only Northland had a lower median household income at the 2013 Census. Differing from the median
personal income data, the territorial authority with the highest median household income was Palmerston
North City with an income of $58,400. Horowhenua District had the lowest median household income at
$39,100. (This is unsurprising given the high rate of retired people living in Horowhenua on fixed incomes).
Historically the labour force participation rate in the Region has been slightly lower than the national
average. The graph below shows the regional trend compared to the national trend between March 2004
and March 2013. Higher employment rates tend to correlate to greater travel demand, as people generally
need to travel between their place of work and residence.
ANNUAL AVERAGE, %
74 74
72 72
70 70
68 68
66 66
64 64
62 62
60 60
58 58
MAR-04 MAR-05 MAR-06 MAR-07 MAR-08 MAR-09 MAR-10 MAR-11 MAR-12 MAR-13
MANAWATU-WANGANUI NEW ZEALAND
FIGURE 2: REGIONAL AND NATIONAL TRENDS IN THE EMPLOYMENT RATE, MARCH 2004 – MARCH 20134
4
Manawatu-Wanganui Quarterly Regional Labour Market Update March 2013, pg 3, Ministry of Social Development and Ministry of Business, Innovation and Employment.
Draft Regional Land Transport Plan | 2015 - 2025 9The rates of household ownership continue to drop across the Region. At the 2006 Census, 66.8% of
households in the Region were owned by the occupants or held in a family trust while at the 2013 Census,
this rate had dropped to 65.2%. The most likely reason for this is that younger generations are deferring
home ownership for other factors such as career entry, marriage and child bearing5. However the regional
rate is above the national rate as housing is much more affordable in the Region.
Manawatu District has the highest home ownership rate in the Region at 71.2%, which possibly reflects the
higher median incomes in the District, compared to regionally, as well as the close proximity of Feilding to
Palmerston North where household prices may be cheaper in Feilding, but still close enough to commute
to. Ruapahu District has the lowest rates of home ownership at 55%.
2.1.5 DWELLING OCCUPANCY
The number of people per dwelling is an important indicator of travel demand. As new dwellings tend to
increase urban sprawl in some parts of the Region, this leads to a dependence on private vehicle use as
new areas are often not well planned for public transport provision.
The Region’s average household size is 2.5 people per dwelling; this is less than the national average of
2.7. These numbers have not changed since the 2006 Census. Of note also is that the average household
size in Palmerston North has declined from 2.9 residents per household in 1991 to 2.6 in 2006. This has
had an impact on the number of new dwellings built in and around the city and environs. Palmerston North
City’s average household size is expected to continue to decline to 2.3 residents per household in 2031.
Across the Region, household size is projected to decline from 2.5 to 2.2 residents per household by 2031.
2.1.6 VEHICLE OWNERSHIP
In recent years there has been an increasing trend for households to have more vehicles, which runs
counter to the declining rate of household size. However the 2013 Census revealed a change in this
trend with fewer households, in percentage terms, now owing two or more vehicles in the Region. At the
2006 Census, 50.4% of households (40,869 households) owned two or more vehicles, while at the 2013
Census there was a slight decline to only 49.3% of households (40,917 households). Nationally 54.5% of
households own two or more vehicles. This was a slight increase from the 2006 Census where 54.1% of
households owned two or more vehicles.
In contrast, almost one in ten households in the Region has no access to a vehicle, a total of 7,602 (9.2%)
households at the 2013 Census. This is above the national average of 7.9% of households without access
to a vehicle.
While it is hard to speculate as to why these trends have appeared in the Region, household incomes
and age may be a contributing factor in the declining rate of vehicle ownership. As vehicle costs increase
households may begin to reduce the number of vehicles they own. An ageing population may also mean
that more and more drivers are hanging up their keys because they cannot drive, or cannot afford to own a
vehicle. As vehicle ownership rates have dropped, so too has vehicle kilometres travelled (VKT).
5
Centre for Housing Research (2008) The Falling Rate of Home Ownership in New Zealand, Research Bulletin no. 13.
10 Draft Regional Land Transport Plan | 2015 - 20252.1.7 VEHICLE KILOMETRES TRAVELLED
Since 2006 there has been a declining rate of vehicle kilometres travelled in the Region. Most of the
decline in VKT has occurred on the State Highway network, which suggests that people are doing less
long-distance driving. As a per capita measure the trend is also going down. Comparing the Census years
of 2006 with 2013 shows that in 2006 people in the Region drove on average 11,417km, while in 2013
people drove just 10,806km.
There are a number of possible reasons for this declining trend in VKT: demographic trends such as an
aging population which has both an age-related and income-related effect on travel; socio-economic
trends such as reduced attachment to private vehicles, or increased awareness of the negative health /
environmental outcomes of driving; technological developments such as the rapid uptake of smart phones
and other smart devices has reduced people’s need to travel; and trends in transport costs, most notably
sustained higher fuel prices but also cheap long-distance bus fares and reduced air fare costs also may
have contributed to this.
3000
2500
2000 LOCAL ROADS
VKT (M)
STATE HIGHWAYS
1500
TOTAL VKT
1000
500
0
2000/01
2001/02
2002/03
2003/04
2003/03
2004/05
2005/06
2006/07
2007/08
2009/10
2010/11
2011/12
2012/13
YEAR
FIGURE 3: REGIONAL VEHICLE KILOMETERS TRAVELLED 2000-2013
2.1.8 REGIONAL ECONOMY AND ITS IMPACT ON TRANSPORT DEMAND
The regional economy is largely based on the production of primary industries, and because of this, the
Region’s economy is reliant on the land transport network in transporting product from its point of origin
to its destination. A large proportion of the Region’s primary product eventually makes its way out of the
Region for either export overseas or to be redistributed to other parts of New Zealand. Therefore it is
critical to the economy of the Region that transport links are resilient.
Palmerston North, and to a lesser extent, Wanganui have become important freight distribution centers
recently, providing the primary sector with good road and rail transport routes to markets. In fact,
Palmerston North is now a major freight hub and has superseded Wellington in importance as a distribution
center. This is as a result of two important commodity flows:
• Palmerston North has become a key staging point for high value imported and domestic freight
between Auckland and Wellington or between Auckland and the South Island; and
• Palmerston North has good access to hinterlands that produce New Zealand export commodities and
provides the staging point for export of these out of the ports in Napier, New Plymouth and Wellington,
or even Auckland and Tauranga. In particular, it is the staging point between Fonterra output from the
Whareroa plant in Hawera and export ports in Napier, Tauranga and Auckland.
Draft Regional Land Transport Plan | 2015 - 2025 11Time criticality is important in freight distribution. A key component of ensuring suppliers meet time critical
deadlines is an efficient road transport network, as most time critical product is transported on the roading
network. The lower part of the Region is fortunate to have a resilient and efficient roading network in order
to meet the demands of time critical transport.
The Regional Growth Study, due for completion in 2015, will investigate ways to prioritise investment and
economic growth opportunities for all districts within the Region over the next 30 years. Transport is a key
enabler of growth and discussed below are some of the key sectors of the economy.
Agriculture (including: horticulture and fruit growing; sheep, beef and livestock farming; dairy farming;
other farming services to agriculture; and hunting and trapping) is the Region’s most important enterprise.
Around about 80% of the Region is fertile grassland. Farmland is used more intensively than in the past
which has led to increased dairy farming and more intensive livestock production. This intensification of the
land will have long-term implications for the Regions transport networks, with increasing numbers of heavy
vehicles servicing these industries.
The dairy supply chain is complex, with varying degrees of movement throughout the Region to processing
plants both within and outside the Region. Nationally, around 50% of dairy products are moved by rail.
However, in our Region this is higher due to the milk conveyed from the processing facilities at Oringi and
Longburn to the Whareroa plant in Hawera. There is also a large counter flow from Hawera to the Port of
Napier, with finished product being sent for export from Napier.
In 2015, Fonterra’s Pahiatua milk processing facility is expected to be upgraded with a new milk
powder dryer. All the milk produced in the eastern North Island from the Hawke’s Bay to Wellington will
be converted to milk powder at the Pahiatua facility, therefore negating the need for it to be transported
to Hawera.
There are a number of meat processing facilities in the Region that contribute to it having the largest
volume of stock movements in the country. About 44% of meat is conveyed by rail around New Zealand as
many meat processing plants have railway sidings. Most meat processed within the Region that goes for
export is trans-shipped to either the Ports of Tauranga or Napier.
Forestry is likely to contribute more to the economy in the years between 2020-2030 as much of the
Region’s forestry estate reaches its harvestable age, although when it gets harvested will generally depend
on its commodity price at the time. There are large plantations of forest in the Rangitikei, Ruapehu and
Wanganui Districts, accounting for more than 75% of the total land area planted with radiata pine in the
Region. Most of the logs will get transported via road, particularly local roads, but in some instances are
transported by rail. Most logs get exported via the Ports of Napier and Wellington (CentrePort).
The regional tourism industry is largely reliant on the domestic tourism market, with no international
airports or seaports in the Region. Most tourists will enter the Region via the land transport network rather
than by air or sea as free independent travellers rather than on organised tours.
The major tourist destination in the Region is Palmerston North. Due to its central location and ease of
access, it is a major domestic conference and sporting venue which accounts for a large amount of its
domestic tourism visits. International visitors are more important to the Ruapehu and Wanganui Districts,
where there are major recreational attractions such as the Volcanic Plateau and Whanganui National Park.
12 Draft Regional Land Transport Plan | 2015 - 2025The Ruapehu and Wanganui Districts also have two of the ‘Great Rides’, that comprise the national
cycleways network, Nga Haeranga: The Timber Trail and the Rivers to Sea cycle trails. The trails are the
‘premier’ rides on the network. In recent years the network of cycle routes has been expanded to include a
number of on-road cycle touring routes, with the long-term aim of developing a nationwide cycling network,
enabling locals and international visitors to explore all of New Zealand by cycle. All or part of the following
‘cycle touring routes’ are in the Region:
• Manawatu Cycleway
• Mountain to Sea Connection
• Tararua Traverse
• The Gentle Annie
• The OTT Trail
• Timber Trail Connection
2.2 THE ISSUES
Issues identify the pressures that the current regional land transport network is facing over the lifetime of
the Plan. The issues tend to be multi-faceted and there are generally no ‘quick fixes’ in order to address
them. They may take many years from start to finish to resolve. For example, roading projects from the
investigation and design phases to the construction phase can be years apart for a number of reasons,
including funding constraints and landowner negotiations.
The identified issues in the Horizon’s Region are:
• Integrated land use and transport planning to produce a more resilient network, and to provide a more
structured roading hierarchy to accommodate anticipated future freight growth;
• Improved linkages to other Regions – of importance, links to the south of the Region and to the north
of the regional border between the Desert Road Summit and Taupo;
• The need to maintain improvements to secondary strategic links that are playing an increasing role as
east-west links and alternative routes and for tourism/economic development purposes
• Anticipated population and economic growth in the Palmerston North and Manawatu area, the impacts
this will have on freight distribution;
• The need for continued improvements to road safety in the Region;
• Increasing pressure on the Regions rural roading network, particularly with increased forest harvesting
and agricultural use and potential increases in tourism traffic; and
• Mitigating adverse environmental effects from the regional transport system
Draft Regional Land Transport Plan | 2015 - 2025 132.2.1 INTEGRATED LAND USE AND TRANSPORT PLANNING TO PRODUCE A MORE
RESILIENT NETWORK; AND TO PROVIDE A MORE STRUCTURED ROADING HIERARCHY
TO ACCOMMODATE ANTICIPATED FUTURE FREIGHT GROWTH
The Region, largely due its central location, is well served by a strategic network of road, rail and air
links, with access to ports in neighboring regions. In order to ensure that sustainable economic and social
development of the Region is supported, it is vital to ensure that this network continues to function well
and promotes the Region’s increasingly important role as a center for the distribution of freight in
the North Island.
However, there are a number of vulnerable sections of the network, which will become subject to
increasing pressure over the coming years if traffic growth occurs. Of particular importance is the role
of freight and its predicted growth. Two of the most vulnerable sections in the Region are the Manawatu
Gorge (SH3) and Whirikino Trestle (SH1). These are important to the Region economically as the Gorge
is the most direct link from our region to the Port of Napier. The Whirikino Trestle is also important as
currently all High Productivity Motor Vehicles (HPMV) heading north or south have to take a detour through
a network of other routes.
The Joint Transport Study (JTS) undertaken in 2010 is still as relevant today as when it was developed
five years ago as most of the recommendations of the study have yet to be implemented. The aim of the
JTS was:
• to develop an integrated transport network for the study area, with a key focus on confirming a road
hierarchy; and
• to identify the road improvements and develop a programme of works to give effect to the proposed
road hierarchy.
The major deficiencies of the existing rural road network within the core study area were identified as:
• the State Highway 3 route between Sanson and the Manawatu Gorge passing through Palmerston
North is inefficient as an inter-regional route;
• the commuter route between Feilding and Palmerston North via Bunnythorpe requires this traffic to use
two level crossings of the North Island Main Trunk (NIMT) railway line;
• the need for an additional crossing of the Manawatu River;
• the lack of a clearly defined road hierarchy, particularly north and east of Palmerston North to provide
good access to the North East Industrial Zone (NEIZ) adjacent to the airport, the proposed eastern
residential growth area and the proposed New Upstream Bridge.
Also identified was the need for additional capacity along and across Tremaine Avenue within the urban
area of Palmerston North.
A number of proposals were developed to address these deficiencies. They are:
• A rural state highway route between Mt Stewart and the Manawatu Gorge via Bunnythorpe
• A New Upstream Bridge between Te Matai Road and Staces Road
• An Eastern Corridor between Bunnythorpe and the New Upstream Bridge
• A bypass of Bunnythorpe
• A Rural Ring Road around Palmerston North
14 Draft Regional Land Transport Plan | 2015 - 2025While most of these proposals are still relevant it is now unlikely that the Upstream Bridge will be
constructed within the next 20 years.
A rural roading hierarchy has been developed (see Appendix 2) which takes into account the existing
roading hierarchy of the Palmerston North City District Plan. In 2012, Palmerston North City’s Plan Change
7 brought the District Plan into line with the operative RLTS, and in 2014 Plan Change 50 of the Manawatu
District Plan did likewise.
However, during the development of the Plan there have been concerns raised that there is a mismatch
of land use planning and transport planning between the public and private sectors. The concern is that
the two sectors are not working as efficiently as possible in identifying areas for investment, as planning of
the land transport network goes hand in hand with private sector development. The protection of identified
heavy freight routes is one of the most important ways that the public sector can stimulate investment for
the private sector as this provides long-term certainty for the sector.
Improving this situation will give the private sector more confidence in the resilience and efficiency of the
Region’s transport network and encourage increased investment in the Region. An example of recent
investment where the public and private sectors have worked together is the announcement in 2014 of an
inland port and intermodal freight hub at Longburn, just south of Palmerston North. This is a joint venture
agreement with the Ports of Auckland, Napier and Icepak. This facility is reusing the old Longburn freezing
works site which sits on the NIMT and is adjacent to State Highway 56.
In 2011, the Wanganui District Council (WDC) adopted an Urban Transportation Strategy that sets the
direction for future transportation investment over the following 30 years in the District. The Strategy aligns
a number of WDC documents including the District Plan. One of the major themes of the Strategy is to
improve the efficiency and effectiveness of freight movement and notes that, in order to be successful;
the Strategy relies on other stakeholders to play their part. An example of this was the reopening of the
Castlecliff branch rail line in May 2011, providing direct access to the Open Country dairy factory as a
terminus for the Port of Taranaki. However, it also recognises that future District Plan reviews will need
to consider the potential land use conflicts between identified areas of housing development and heavy
vehicle routes.
2.2.2 IMPROVED LINKAGES TO OTHER REGIONS – OF IMPORTANCE LINKS TO THE SOUTH
OF THE REGION AND TO THE NORTH OF THE REGIONAL BORDER BETWEEN THE
DESERT ROAD SUMMIT AND TAUPO
This issue has been of importance to the RTC for a number of iterations of the RLTS. Because of the
Region’s proximity to the Wellington Region, which is of national economic importance, access to and from
it, particularly the important State Highway 1 south route, is crucial to the economic vitality of our Region.
Access along State Highway 1 is heightened because of the lack of practicable alternative routes to and
from the Wellington Region.
Likewise, the part of State Highway 1 north known as the ‘Desert Road’, between Waiouru and Taupo
in the Waikato Region, is increasingly important to the economy of the Region. Around one-quarter of
all vehicle movements on this road are by heavy commercial vehicles and this is expected to increase
over the life of the Plan. State Highway 1 north provides the most direct link from this Region to the Port
of Tauranga, New Zealand’s largest port in terms of cargo volume, as well as to the ‘Golden Triangle’
regions of Auckland, Bay of Plenty and Waikato that account for around two-thirds of New Zealand’s freight
movements and over half of New Zealand’s population.
Draft Regional Land Transport Plan | 2015 - 2025 15Safety and congestion issues on State Highway 1 south have long been of concern to the RTC. This was
recognised when the Government announced the north of Levin to Wellington Airport corridor to be a Road
of National Significance (RoNS) in 2009. By upgrading the route to a mostly four-lane expressway it is
hoped that access will improve to CentrePort (the Port of Wellington), Wellington CBD, Wellington Regional
Hospital and Wellington Airport. In doing so this will relieve severe congestion on both the state highway
and connecting local roads, improve safety, and improve journey time reliability.
The current route south as far as Otaki has poor alignment and a number of narrow bridges. A large
number of local roads and properties have access onto the highway (which contributes to its poor
safety record) and these issues make is very difficult to upgrade the existing route to modern standards.
Congestion, particularly around Otaki, has been a long standing issue.
The project has been divided up into eight individual sections and the Otaki to north of Levin section is
mostly in the Horizons Region. The current proposal favoured by the Transport Agency is to have a four-
lane route all the way up to the SH1/57 intersection (just south of Levin) before the upgraded route merges
onto current SH57 at the intersection of Kimberley Road. The overall RoNS project is expected to save 40
minutes of journey time between Wellington and Levin when all improvements are expected to be complete
by 2031, and to have 30% fewer serious crashes in the five years after the route is finished.
The previous issue touched on the Manawatu Gorge alternative and the Whirikino Trestle bridge as being
important parts of the road network that are constraining, or potentially constraining, economic growth.
Both of these projects are anticipated to be completed during the lifetime of the Plan.
2.2.3 THE NEED TO MAINTAIN IMPROVEMENTS TO SECONDARY STRATEGIC LINKS THAT ARE
PLAYING AN INCREASING ROLE AS EAST-WEST LINKS AND ALTERNATIVE ROUTES AND
FOR TOURISM/ECONOMIC DEVELOPMENT PURPOSES
In addition to the State Highways, a number of local roads have been identified as strategically important
to the Region, including alternative routes for east-west and north-south links for tourism purposes. Most of
these routes have low volumes of traffic. However, they become important in the event of road closure or
for tourist access and therefore need to be safe and provide an adequate level of service when necessary.
Many of these routes have had safety and level of service issues that have just recently been resolved and
will need to be maintained during the lifetime of this Plan.
The Saddle Road, which connects Ashhurst and Woodville, is currently the most used alternative east-
west route when the Manawatu Gorge (SH3) is closed and carries approximately 60% of traffic at those
times. When the Manawatu Gorge was closed during 2011-12, the Saddle Road was shown to have
an inadequate level of service for such a long period of time. The road suffered from seal deterioration
and sections of the road needed to have speed reductions in place. A number of slow vehicle bays were
installed during this time.
The economic loss to the Region was estimated at $60,000 for each day the Gorge road was closed. As a
result of the prolonged closure, the Transport Agency put forward a project in the 2012-15 RLTProgramme
to upgrade the Saddle Road to an appropriate standard so that it was a viable alternative in the event that
the Gorge was again closed for a long period of time. This project is due for completion in the 2014-15
financial year.
The Pahiatua Track provides a strategic connection for the west to the south-east of the Region and to the
Wairarapa. It also serves as a secondary alternative route when the Manawatu Gorge is closed, carrying
16 Draft Regional Land Transport Plan | 2015 - 2025approximately 40% of the Gorge traffic. Ensuring that the Track maintains its status as an alternative
secondary route will be important during the lifetime of this Plan. With this in mind, there may need to
be some safety realignments as there are a number of tight hairpin turns and the road is also used as a
training route for cyclists. Widening the road width will increase the safety to all road users.
The Napier-Taihape Road also played an increased role as a alternative east-west link during the 2004
floods. Largely as a result of this the RTC advocated for the route to be sealed. Sealing of the road took
place between 2007 and 2012 and has played an emerging role as a tourist and freight route since.
The Whanganui River Road has also been identified as a potential tourism route between the Wanganui
and Ruapehu Districts. It now forms part of the Mountains to Sea – Nga Ara Tuhono Cycle Trail, one of
the Great Rides of the New Zealand Cycle Trail routes, with the section between Pipiriki and Upokongaro
utilising the River Road. The road was constructed early last century and had been largely a metal road
since. However, in 2006-07 sealing of this route commenced and was completed in March 2014.
2.2.4 ANTICIPATED POPULATION AND ECONOMIC GROWTH IN THE PALMERSTON NORTH
AND MANAWATU AREA, THE IMPACTS THIS WILL HAVE ON FREIGHT DISTRIBUTION
The Region’s population was 222,672 at the 2013 Census, which was an increase of less than 0.1% on
the 2006 population of 222,423. The Horizons Region is no different from other predominantly rural regions
in that it is experiencing rural population loss in most of its Districts. However the population, of both
Palmerston North City and Manawatu District are both expected to increase in the coming years.
Figure 1 in section 2.1.2 shows that Palmerston North and Manawatu have accounted for the majority of
the Region’s recent population growth This is not anticipated to change, with most projected population
growth in the Region still forecast for these two areas over the next ten-years.
The likely effect of this population growth is that there will be increased pressure on some of the key
transport links in and between the two territorial authorities. Again, the purpose of the JTS was to
recommend a number of solutions for resolving the issues that were identified. Of the proposals identified
earlier, a number have a direct relationship with this issue.
A number of key arterial routes are experiencing some congestion at peak times and this will need to be
managed adequately into the future. Palmerston North’s significant and growing freight distribution industry
and the strategic network in and around the city will need to cater effectively for this now and into the
future. The implications for this have been discussed in a previous issue. However, of importance to this
issue, is ensuring that future growth of the North East Industrial Zone is planned for via an efficient road
network providing good access locally to Palmerston North and regionally to the rest of the North Island.
Furthermore, improved connections between Feilding and Palmerton North will need to cater for predicted
increases in commuter flows, including the resolution of issues in the Bunnythorpe area. Refer to Appendix
2 for further detail on the JTS actions.
Another recommendation of the JTS is that a separate traffic study be undertaken to identify options to
optimise the Palmerston North urban road network and to develop an integrated roading plan to cater for
future traffic demands, both to 2021 and to the longer term horizon of the JTS. This will need to allow for
land use changes to emerge from the current PNCC urban growth strategy and may include a review of
the findings of the JTS, based on current land use projections.
Draft Regional Land Transport Plan | 2015 - 2025 17PNCC have put forward two projects in the programme component (section 4) to address these issues: the
upgrade of strategic routes to HPMV (high productivity motor vehicle) standard, and implementation of the
Integrated Transport Strategy business case.
The Regional Growth Study may also identify future areas of economic growth in the Palmerston North and
Manawatu districts, although the focus of the study is Region-wide rather than on these two districts alone.
2.2.5 THE NEED FOR CONTINUED IMPROVEMENTS TO ROAD SAFETY IN THE REGION
Road crashes have a huge social and economic cost to the Region. The estimated value of each life lost in
a road fatality in the Region is $4.61 million6.
The National Road Safety Strategy, Safer Journeys 2020, is a strategy to guide improvements in road
safety over the period 2010-2020. Its aim is to create a safe road system increasingly free of death and
injury. To do so, the Strategy describes using a Safe Systems approach that works across all elements of
the road system: roads, speeds, vehicles and users.
The Strategy identifies 13 areas where current performance needs to be strengthened and ranks them into
areas of high concern, medium concern, and continued and emerging focus.
Coupled with this national focus, is the “Communities at Risk” register that identifies communities with a
significantly higher than average risk of crashes involving certain causal factors. The Communities at Risk
and Safer Journeys will guide investment in road safety until at least 2020.
Since Safer Journeys was introduced the national road toll has dropped to totals not seen since the early
1950’s when the population was far smaller and there were far fewer cars on the roads. In 2011 and 2013,
the national road toll was under 300 fatalities. Before 2011, the last time this was achieved was in 1952.
In 2003, 461 people lost their lives on the nations roads; in 2013 this was almost halved at 254 fatalities.
While improvements have been made, it is considered that work is still required to reach the ultimate goal
of a zero road toll.
The work we do in our Region all contributes to improving the outcomes identified in Safer Journeys. Since
the 2010 RLTS was adopted, there have been some big improvements in the number of fatalities and
serious injuries in the Region.
140
120
100
NUMBER
80
60
40
20
0
2009 2010 2011 2012 2013
FATAL SERIOUS
FIGURE 4: MANAWATU-WANGANUI FATAL/SERIOUS CRASHES 2009-2013
6
Social cost of road crashes and injuries 2013 update report, Ministry of Transport, November 2013.
18 Draft Regional Land Transport Plan | 2015 - 2025You can also read