RAPID TRANSIT COVID RECOVERY SCENARIOS - NZTA
←
→
Page content transcription
If your browser does not render page correctly, please read the page content below
RAPID TRANSIT COVID RECOVERY
SCENARIOS

L.E.K. CONSULTING, PWC, EUROPIUM

30 JUNE 2020
Copyright information
Copyright ©. This copyright work is licensed under the Creative Commons Attribution 4.0 International licence.
In essence, you are free to copy, distribute and adapt the work, as long as you attribute the work to the NZ
Transport Agency and abide by the other licence terms. To view a copy of this licence, visit
http://creativecommons.org/licenses/by/4.0/.

Disclaimer
The NZ Transport Agency has endeavoured to ensure material in this document is technically accurate and
reflects legal requirements. However, the document does not override governing legislation. The NZ Transport
Agency does not accept liability for any consequences arising from the use of this document. If the user of this
document is unsure whether the material is correct, they should refer directly to the relevant legislation and
contact the NZ Transport Agency.

More information
NZ Transport Agency
Published June 2020

If you have further queries, call our contact centre on 0800 699 000 or write to us:
NZ Transport Agency
Private Bag 6995
Wellington 6141
This document is available on the NZ Transport Agency’s website at http://www.nzta.govt.nz
CONTENTS
1. EXECUTIVE SUMMARY .............................................................................................................................. 6

2. INTRODUCTION........................................................................................................................................... 9

3. GLOBAL COVID-19 TRANSPORT IMPACT ............................................................................................. 11
3.1 Key findings............................................................................................................................................... 11
3.2 Auckland’s unique characteristics.......................................................................................................... 11
3.3 Impact across modes ............................................................................................................................... 12
3.4 Behavioural impact ................................................................................................................................... 14

4. AUCKLAND TRANSPORT IMPACTS ....................................................................................................... 17
4.1 Key findings............................................................................................................................................... 17
4.2 Impact across modes ............................................................................................................................... 18
4.3 Impact to rapid transit .............................................................................................................................. 19
4.4 Spatial and temporal impact .................................................................................................................... 20
4.5 Behavioural response to transport ......................................................................................................... 20

5. HISTORICAL EVENTS COMPARISON ..................................................................................................... 24
5.1 Key learnings............................................................................................................................................. 24
5.2 Recovery from SARS-CoV Outbreak, 2003 ............................................................................................ 25
5.3 September 11th Terrorist Attack, 2001 .................................................................................................... 26

6. INITIAL COVID RESPONSE ...................................................................................................................... 28
6.1 Key findings............................................................................................................................................... 28
6.2 Initial global response .............................................................................................................................. 28
6.3 Global rapid transit response .................................................................................................................. 31

7. SCENARIOS FOR RECOVERY ................................................................................................................. 33
7.1 Approach to developing scenarios ......................................................................................................... 33
7.2 Scenario definition .................................................................................................................................... 34

8. IMPLICATIONS .......................................................................................................................................... 39
8.1 0-2 year forecast........................................................................................................................................ 39
8.2 2-5 year and longer term forecasts ......................................................................................................... 43
8.3 Employment impact .................................................................................................................................. 45

9. POTENTIAL RESPONSES ........................................................................................................................ 48

10. CONCLUSIONS AND NEXT STEPS ......................................................................................................... 52
A-1 Policy Impact ............................................................................................................................................. 54
A-2 Employment Impact .................................................................................................................................. 56
B-1 Scenarios for recovery: model assumptions ......................................................................................... 67
B-2 MSM modelling parameters ..................................................................................................................... 69
APPENDICES
APPENDIX A EMPLOYMENT AND POLICY IMPACTS
APPENDIX B MODEL PARAMETERS
EXECUTIVE SUMMARY

 5
NZ TRANSPORT AGENCY RAPID TRANSIT COVID RECOVERY SCENARIOS
1. EXECUTIVE SUMMARY
Current situation
The global impact of the once in a hundred year COVID-19 pandemic has been unprecedented. New Zealand
implemented a swift and comprehensive response, notably the closure of international borders, to stop the
spread of COVID-19. To date, the total number of infections and the infection rate in New Zealand has been
significantly lower than other countries.
As a result, Auckland is in an enviable position with the virus appearing to be well contained. However, the
consequences have been significant. Lockdown drove a significant reduction in trip intensity across all modes,
especially in public transport, which has begun to recover but at a slower rate than the other modes. On
average during Levels 4, 3 and 2, public transport patronage declined to c.5%, c.12% and c.40% of baseline
levels, compared to c.24%, c.55% and c.82% of baseline levels for private vehicle movements.
Public transport peak spreading has reduced as restrictions have been lifted, and morning and afternoon peaks
are now approximately in line with baseline. On the roads, at Level 2 the AM and PM peaks were at 77% and
88% of traffic volumes pre-COVID.
Auckland’s Rapid Transit Network (RTN) patronage has been impacted only slightly more than other non-RTN
public transport, declining up to c.97% vs. c.95% relative to baseline during Level 4. As at 31 May 2020, it has
since recovered to c.40% of baseline levels, compared to c.45% for non-RTN public transport. RTN recovery is
expected to be slower than other public transport, as it largely services the city centre with office workers who
have mostly continued to work from home.
Globally, rapid transit demand was less impacted than overall public transport demand, and as at 29 May 2020
has been recovering faster, to c.55% of baseline levels on average across the 4 Auckland comparator cities, vs.
c.46% for all public transport. Rapid transit demand has recovered strongest in Hamburg to c.66% of baseline
levels, where restrictions were relatively lenient and COVID-19 has largely been contained.
There are a number of reasons why Auckland’s impact on RTN has been greater than comparator cities. Firstly,
Auckland’s lockdown was stricter and had a disproportionately large impact on the city centre, given that nearly
all businesses were closed and many city centre workers were forced to work from home. Secondly, Auckland’s
RTN largely services the city centre, whereas in other cities, rapid transit has broader network coverage.
Planned rapid transit investments and upgrades are largely unaffected globally and in 3 of the 4 international
comparators. The exception being San Diego where the economic downturn has resulted in lower sales tax
collection required for project funding.
Future recovery
Predicting how transport in Auckland will recover is a complicated undertaking because there is significant
uncertainty. There are no comparable historical events to draw from and there are limited learnings to be made
from international comparisons (given New Zealand’s successful containment of the virus). The extent to which
Auckland’s public transport demand will recover is highly contingent on public policy settings, adherence to this
guidance, and the extent of behavioural change.
Global surveys to date suggest that the recovery will vary by mode and trip purpose. However, in contrast to the
global response, in New Zealand, passenger sentiment suggests public transport demand is expected to
rebound to near pre-COVID levels. Behavioural surveys also indicate that travel for education, and by active
and private modes, are likely to recover the fastest.
Several scenarios were developed to assess future Auckland transport demand. The scenarios developed aim
to cover the range of potential eventualities. The low and high cases represent the likely bounds of the possible
responses to COVID-19:
 • The low case considers the possibility of a secondary COVID-19 outbreak occurring in New Zealand. It
 assumes a profound economic decline and a significant long term shift to private modes (active, car).
 With a sustained decrease in trips made across all segments, leisure and work trips will be the most
 impacted long-term
 • The central case follows the current trajectory observed in recovery. It assumes a moderate shift to
 private modes in the short-run post lockdown; eventual return to public transport modes; active mode
 share growth is sustained. Post-lockdown trips for education recover quickly; work and leisure trips are
 moderately impacted; leisure trips are the slowest to recover

 6
NZ TRANSPORT AGENCY RAPID TRANSIT COVID RECOVERY SCENARIOS
• The high case models the potential eventuality that the disease remains contained and is essentially
 eliminated. It is based on the transport demand response observed during the 2003 SARS outbreak in
 Taipei and Hong Kong, with rate of recovery in demand discounted given the harsher epidemiology
 characteristics of COVID-19. It forecasts a rapid return to pre-COVID public transport patronage post-
 lockdown, with active mode share growth sustained. Post-lockdown, trips for education and work
 recover quickly, while leisure trips suffer a long term impact and are the slowest segment to recover
These scenarios are then compared to the future reference case, which is based on the hypothetical
assumption that the COVID-19 pandemic never occurred.
Overall, total transport demand in the central case is projected to recover to c.86% of the future reference case
by Q2, 2022. However, the shape of the likely recovery is nuanced. Some trip purposes will recovery faster than
others. For example:
 • Work trips (c.25% of trips historically) are projected to recover slowly, reaching c.89% of future
 reference case levels by Q2, 2022 in the central case. Reduced travel for work follows an increase in
 working from home as practices adopted during lockdown become more commonplace
 • Education trips (c.11% of trips historically) suffered the largest decline as a result of COVID-19, with the
 forced closure of all schools and tertiary education institutions. However, education trips are assumed to
 rebound quickly with the reopening of these institutions, as per data at Level 2 and are forecast to reach
 c.95% of future reference case levels in the central case in Q2, 2022
 • Leisure trips (c.64% of trips historically) are expected to recover approximately c.20% slower than work
 trips, given that they are completely discretionary. This is likely to be driven by a broad economic
 decline and an increased propensity to stay at home (e.g. increased penetration of online shopping), as
 demonstrated by the lack of a recovery in leisure travel at Level 2. Leisure trips are forecast to reach
 c.83% of future reference case levels in the central case in Q2, 2022.
In the first year of recovery, public transport mode share is projected to fall due to increased use of private
vehicles and active modes, public anxiety associated with using public transport and lower numbers of city
centre commuters.
However, as activity in urban centres increases and public anxiety wanes, private vehicle mode share is
expected to decrease over time (except in the low case). Active mode share is expected to continue to grow in
line with recent growth. Active mode share reaches c.16% by Q2, 2022 in the central case, up c.1-2% from
c.14% in 2019.
RTN patronage recovery is expected to be marginally slower than the rest of the public transport network. RTN
share of public transport is expected to recover to pre-COVID levels by 2021 in the central case. Given that city
centre employment is largely based on the services sector, the adoption of working from home practices is likely
to have a disproportionately larger effect on rapid transit patronage going forward.

 7
NZ TRANSPORT AGENCY RAPID TRANSIT COVID RECOVERY SCENARIOS
INTRODUCTION

 8
NZ TRANSPORT AGENCY RAPID TRANSIT COVID RECOVERY SCENARIOS
2. INTRODUCTION
The outbreak of novel coronavirus (COVID-19) is the largest global pandemic since the 1918-9 Spanish Flu.
COVID-19 was first detected in Wuhan, China in December 2019 and was declared a pandemic by the World
Health Organisation (WHO) on 11 March 2020. As at 17 June 2020, the virus had spread to 217 countries with
c.8 million confirmed cases and c.440,000 deaths worldwide.1
Geographic separation, low population density and early lockdown interventions supported the successful
containment of the initial outbreak in New Zealand. Although the health crisis has been averted, the economic
impact has been significant. Between March and May 2020, 1.7 million people received wage subsidies.2 From
a transport perspective, the lockdown resulted in an expected demand reduction across all primary modes,
which has since been recovering during roll-back. The longer term economic and transport impacts will depend
on the continued containment of outbreaks, as well as the indirect impacts of a global economic decline,
reductions in tourism and travel, and the availability of a vaccine or treatment.
This report summarises the impact of the pandemic on transport within Auckland, and explores potential
recovery scenarios across all modes. The forecasts are intended to bookend the possible eventualities, and are
based on scenarios of how various travel segments may respond. The report draws on learnings from historical
events such as SARS and from global transport responses to COVID. We note that the unprecedented nature of
the pandemic and Auckland’s unique position in containing the virus limits the number of the relevant historical
comparison points.
This report aims to provide a framework to guide NZTA in their planning in a post-COVID world. A focus has
been given to the implications for the Rapid Transit Network (RTN).
The majority of contributions to this report were written prior to 29 May 2020, and consider the best available
evidence at the time. The report was written by L.E.K. Consulting with PwC (macroeconomic forecasts),
Europium (international COVID-19 transport impact and response), and with contributions from the Auckland
Forecasting Centre, Auckland Transport (AT), and the New Zealand Transport Agency (NZTA). The report
analyses the impact on public transport and initial recovery for the time period March - May 2020. It was
developed for the Auckland context, however its scenarios framework and responses are likely to be applicable
to transport systems across New Zealand.

1
 WHO Coronavirus Dashboard, 2020
2
 Statistics NZ

 9
NZ TRANSPORT AGENCY RAPID TRANSIT COVID RECOVERY SCENARIOS
GLOBAL COVID-19 TRANSPORT
 IMPACT

 10
NZ TRANSPORT AGENCY RAPID TRANSIT COVID RECOVERY SCENARIOS
3. GLOBAL COVID-19 TRANSPORT IMPACT
An international comparison was conducted to analyse the impact of COVID-19 on transport demand. Cities
were examined across Australia, North America, Europe and East Asia. Four cities were investigated in detail,
based on their similarities to Auckland: Brisbane, San Diego, Vancouver and Hamburg. The cities were chosen
due to their comparable population size, travel mode share and level of car ownership. Apple COVID-19 Mobility
Reports and Google Community Mobility Reports based on trip-routing mobile phone data and mobile phone
location data, respectively, were utilised to track transport demand in each of these cities.

3.1 Key findings
 • All cities saw a significant reduction in transport demand across modes: the reduction was
 highest for public transport, falling to a maximum reduction of 80-95% of baseline levels.
 • Internationally, rapid transit demand was less impacted than overall public transport demand,
 and has been recovering faster: to c.55% of baseline levels on average across the 4 comparator
 cities, vs. c.46% for all public transport. Rapid transit demand has recovered strongest in Hamburg to
 c.66% of baseline levels, where restrictions were relatively lenient and COVID-19 has largely been
 contained.
 • Auckland’s rapid transit demand has declined marginally more than PT broadly, and has
 recovered more slowly than similar international cities: Auckland’s lockdown was the strictest, and
 had a disproportionately large impact on the city centre, given that nearly all businesses were closed
 and many city centre workers were forced to work from home. Secondly, Auckland’s RTN largely
 services the city centre, whereas in other cities, rapid transit has broader network coverage. Further,
 capacity constraints imposed by physical distancing requirements reduced the accessibility of rapid
 transit services, forcing these to be substituted by other modes such as private vehicles. Substitution
 was more apparent in Auckland, likely due to higher levels of car ownership.
 • Since the easing of restrictions, all modes have shown an increase in use: on average, weekly
 growth in driving activity has been higher than that for public transport. This is most likely a result of the
 perceived health benefit of private transport over public transport.
 • The lockdown caused a strong shift in working arrangements: workforce surveys3 showed around
 50% of workers in the United States worked remotely and c.17% of employers sought to move to
 remote work permanently.
 • There is evidence of modal shift as part of the initial behavioural response: data from the UK
 showed a shift in individual mode choices, with c.47% of travellers shifting from public transport to
 active modes or private vehicles during lockdown, and c.72% unwilling to use public transport until
 physical distancing is ensured. However, mode choice was impacted by car ownership levels – c.28%
 of those without access to a car were significantly more willing to return to public transport, compared to
 c.18% overall.

3.2 Auckland’s unique characteristics
Transport demand in each city is heavily contingent on public policy. Auckland is in a unique position as New
Zealand’s early lockdown enabled the containment of the virus, resulting in low infection numbers. Further,
successful containment has resulted in New Zealanders having a different psychological response to COVID-19
than observed globally, where New Zealand-wide survey results have shown Aucklanders are more likely to be
open and optimistic towards transport.

3
 CNBC, 2020. CNBC/SurveyMonkey Workforce Survey, Q2.

 11
NZ TRANSPORT AGENCY RAPID TRANSIT COVID RECOVERY SCENARIOS
3.3 Impact across modes
Impact by mode
Figure 1 summarises the impacts of lockdown measures, by travel mode. The impact on overall transport
demand was the largest in Auckland, likely due to stricter lockdown measures and a reduction in public
transport capacity. Following the maximum decline, the recovery of demand for driving and active modes was
faster than that for public transport.
Indexed transport demand across cities
(Mar 2020 – May 2020)
 Peak lockdown
Percent difference to baseline*
 Latest data (May 29th)
100
 92
 Public transport usage
 has declined the most 83 84 82
 79 77
 80 across all geographies
 71
 63
 60
 60 55
 44
 40 37 36 38 38
 33 32 32 34
 26 25 24 23
 18 20
 20 15 17

 5
 0
 Brisbane

 Auckland**

 Brisbane

 Auckland**

 Brisbane

 San Diego^
 Hamburg

 Hamburg

 Hamburg
 Vancouver

 Vancouver

 Vancouver
 San Diego

 San Diego

 Auckland
 Public transport Private vehicles Active transport

Note: * Baseline is February 17th- 23rd 2020; ** Based on AT data; ^ Data not available
Source: Apple COVID-19 Mobility Reports. Based on trip-routing mobile phone data; Europium L.E.K. research and analysis

Figure 1 Impact and recovery of transport usage, by mode 4
Active transport demand declined to c.30-40% of baseline levels in all cities studied, with a stronger recovery
observed in Vancouver and Hamburg. Developed cycling infrastructure in these two cities, including the
instalment of temporary cycle lanes along popular routes in Vancouver, supported the recovery of cycling
activity to c.82% and c.92% of baseline levels as at 29 May 2020. 5 Active transport recovery in northern
hemisphere cities may also be attributed to a seasonal change from spring to summer.

4
 Apple COVID-19 Mobility Trends Reports. Baseline data from February 17-23. Rapid transit data provided by operators: Translink, MTS
San Diego, Translink Vancouver, Hamburger Hochbahn and Auckland Transport.
* Weighted average of walking and cycling indices, 25% cycling and 75% walking. Lower weighting assigned to cycling due to higher
recreational travel. Cycling data from Auckland Transport, City of Vancouver, Eco-Public.
5
 Ryan, D. (2020, April 8). COVID_19: Stanley Park crowds prompt road closures. Vancouver Sun.

 12
NZ TRANSPORT AGENCY RAPID TRANSIT COVID RECOVERY SCENARIOS
Globally, the impacts of COVID-19 on rapid transit are more pronounced than those on other modes. In cities
worldwide, rapid transit systems service large commuter populations, of whom a large proportion have been
furloughed or have been working remotely during the pandemic.
Rapid transit patronage experienced significant reductions during lockdown measures with a maximum drop of
94% in Auckland, and c.70-85% across other selected geographies.
Indexed public transport demand, by city
(Mar 2020 – May 2020)
Percent difference to baseline*
125
 Brisbane Vancouver Auckland
 San Diego Hamburg Baseline*
100

 75

 50

 25

 0
 16 Feb 23 Feb 1 Mar 8 Mar 15 Mar 22 Mar 29 Mar 5 Apr 12 Apr 19 Apr 26 Apr 3 May 10 May 17 May 24 May 31 May

 Note: * Baseline is February 17-23rd 2020
 Sources: Apple COVID-19 Mobility Reports. Based on trip-routing mobile phone data; Europium; L.E.K. research and analysis

Indexed rapid transit demand
(Mar 2020 – May 2020)
Percent difference to baseline*
125
 Brisbane Vancouver Auckland
 San Diego Hamburg Baseline*
100

 75

 50

 25

 0
 16 Feb 23 Feb 1 Mar 8 Mar 15 Mar 22 Mar 29 Mar 5 Apr 12 Apr 19 Apr 26 Apr 3 May 10 May 17 May 24 May 31 May

 Note: * Baseline is February 17-23rd 2020
 Source: Google Community Mobility Reports. Data based on cellphone location history, population proximate to transit stations; Europium; L.E.K. research and analysis

Figure 2 Indexed public transport and rapid transit demand

 13
NZ TRANSPORT AGENCY RAPID TRANSIT COVID RECOVERY SCENARIOS
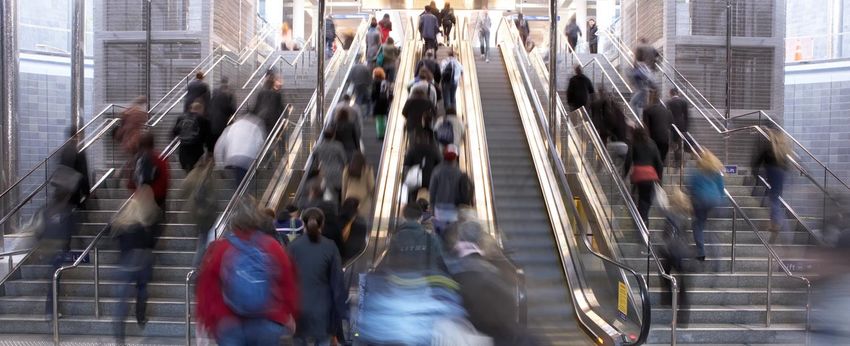
3.4 Behavioural impact The long term behavioural impact of COVID-19 on travel behaviour is a key uncertainty and much will be learned in coming months as countries transition out of lockdown and take measures to prevent further Global transport impact outbreaks. Drawing from a range of international cases, this section synthesises key impacts and their likely Global behavioural implication surveys for travel demand. Theseindicate that findings draw ontravel for education survey data purposes from the United andAustralia Kingdom, USA, privateand China. are likely to recover the fastest modes Category Recovery Global examples According to survey results, c.34% of Australians are working from home at least once a week, with a further c.23% working Work from home ‘occasionally’ Trip WA and SA were the first states to reopen schools in Australia in late April, with face to face attendance rates of c.70-90% Education and c.70% respectively purpose Short term In Australia, over c.50% of survey respondents claimed they have reduced their domestic leisure travel, due to the COVID Leisure outbreak Reduced need to travel and public health risks are limiting public transport usage; c.18% of UK travellers reported they Public transport would be happy to use PT when restrictions were relaxed Data from Chinese cities after the lockdown measures were lifted showed a strong shift to private travel, with private vehicle Mode Private vehicles use increasing from 34% to 56% There has been a tendency to shift to active transport; a c.150% increase in bikeshare activity and increases in average trip Active transport length have been recorded in Beijing The Centre for Future Work estimates that 3 in 10 Australians are currently able to perform their jobs from home. With c.68% Work of Australians enjoying this flexibility of work from home, work-related travel may be impacted even in the long run Trip After the easing of restrictions, public schools in NSW reopened on May 11 with a 89% attendance rate; this represented a Education 3% increase from the previous week, suggesting a return to pre-COVID attendance levels in the medium term purpose Longer term A McKinsey survey examining consumer sentiment in Australia shows that c.28% of Australians expect to decrease their Leisure leisure activities (e.g., movies, concerts etc.) even after COVID Public transport Only c.20% of people surveyed in the UK say they are happy to use public transport when restrictions are relaxed In the UK, there is likely to be a shift from PT to private vehicles; c.60% of people surveyed report that they are likely to drive Mode Private vehicles more rather than use public transport Around half of the people surveyed in the UK report that they are likely to walk and cycle more rather than use public Active transport transport Strong recovery Medium recovery Weak recovery Source: Press articles; SurveyMonkey; Ipsos Group; Transport Focus; Europium; CMO; Statista; Bureau of Labor Statistics; McKinsey; L.E.K. Consumer Survey; L.E.K. research and analysis Figure 3 Expected short-term and long-term recovery of transport demand globally by trip purpose and mode Changes in travel behaviour by trip purpose Figure 3 summarises the expected recovery of transport demand globally. Across both the short and long-term, trips for leisure are expected to be slowest to recover of all trip purposes. In the short-term, public policy, restrictions on gatherings and the opening of food and beverage and entertainment venues are likely to reduce demand for leisure travel. In the long term, reduced discretionary income, a result of the economic impact of COVID-19, will prolong recovery. In Australia c.28% of people expect to decrease their leisure activities, even after restrictions are lifted.6 Work-related travel is also expected to suffer from a prolonged recovery, largely due to rising unemployment but also the adoption of working from home and flexible working trends. An estimated c.48% of US workers worked remotely during lockdown and employer surveys suggest that c.17% of US companies intend to move to permanent remote working arrangements.7 Working from home has also been adopted positively by employees, with c.19% of respondents in the US wishing to work remotely full-time and c.38% wishing to work remotely more than usual.7 Additionally, c.46% of employees in the UK anticipated that they will do more remote work in the future.8 Education trips have recovered strongly, given their largely non-discretionary nature. The first day of reopening of public schools in NSW, Australia saw a c.89% attendance rate, with similar levels observed in other Australian states.9 As such, demand for education trips is likely to recover to pre-COVID levels in the short to medium-term, dependent on public policy. 6 L.E.K. Australia consumer survey (April 27-29 2020), N=1,539 7 CNBC, 2020. CNBC/SurveyMonkey Workforce Survey, Q2 8 Transport Focus, 2020. Travel during Covid-19 survey – week 3. May 21. 9 Press articles 14 NZ TRANSPORT AGENCY RAPID TRANSIT COVID RECOVERY SCENARIOS
Changes in travel behaviour by mode of transport
In the short-term, there has been a modal shift from public transport to private modes globally. Individual travel
choices have been trading off between the need to travel and the potential public health risks of public transport.
In the UK, c.72% of people are not willing to use public transport without physical distancing in place and c.36%
of people are avoiding the mode altogether because of government advice. c.47% of people are not using public
transport due to the availability of private alternatives (active and car).8
International examples suggest that the shift away from public transport could be somewhat entrenched. In the
UK, only c.18% of people reported that they would be happy to use public transport when restrictions are
relaxed, and significant proportions expect that they will drive (c.66%) and cycle (c.52%) more in the future. 8
Empirical data on travel behaviour from Beijing confirms the tendency to shift to private modes, with a 150%
increase in bikeshare activity and private car usage increasing from c.34% to c.56% while bus travel declined
from c.56% to c.24%.10

10
 Ipsos Group, 2020. Cited in Borgomeo, V. (2020). Goodbye to public transport, after Coronavirus everyone in a private car. La Republica.

 15
NZ TRANSPORT AGENCY RAPID TRANSIT COVID RECOVERY SCENARIOS
AUCKLAND TRANSPORT
 IMPACTS

 16
NZ TRANSPORT AGENCY RAPID TRANSIT COVID RECOVERY SCENARIOS
4. AUCKLAND TRANSPORT IMPACTS
4.1 Key findings
 • Public transport was the worst affected mode by COVID-19: During the lockdown period (Levels 4,
 3 and 2), public transport patronage fell to approximately c.5%, c.12% and c.40% of baseline levels
 respectively, while private vehicle usage fell to c.24%, c.55% and c.82%. Active transport modes were
 relatively resilient, with cycling levels at c.64%, c.63% and c.58% of baseline across Levels 4, 3, and 2
 respectively.
 • Public transport demand recovered as lockdown was eased: As at the end of May 2020, public
 transport demand was c.10 times higher than at Level 411. However, public transport usage was still only
 c.44% of pre-COVID levels, compared to private vehicle usage which was c.84% of its baseline12
 • Passenger sentiment suggests public transport demand will rebound to near pre-COVID levels:
 the proportion of New Zealanders expecting to resume public transport immediately following lockdown
 was approximately 80%. Further, at the start of Level 2, c.96% of people surveyed across New Zealand
 claimed that they would return to public transport once the situation returned to normal. The key drivers
 of a return to public transport were cited as increased road congestion and lack of availability of a vehicle 13
 • As Aucklanders returned to public transport, accessibility was becoming an issue: reduced service
 frequencies and on-board capacity constraints were the main barrier to public transport, with c.24% of
 people citing this as the key reason for their reduced public transport usage during the first week of Level
 2. Physical distancing requirements were likely contributing to these accessibility issues
 • Rapid transit demand was more affected than overall public transport demand: rapid transit demand
 declined to c.3% and c.9% of baseline levels during Level 4 and 3 respectively, recovering to only c.36%
 during Level 2. Further, rapid transit’s share of public transport demand fell from c.29% to c.17% from
 March to April 2020. However rapid transit experienced strong recovery as lockdown eased, with
 patronage returning to c.40% of baseline levels as at 31 May 2020. Nevertheless, this recovery was slower
 than overall public transport, which returned to c.44% of its baseline levels
Since the inputs for this report were gathered, New Zealand has now moved to Alert Level 1.

11
 For the week ending 31 May 2020
12
 Figures include weekly averages of transport volume for the week ending 31 May 2020
13
 Waka Kotahi Tracking Core report, Wave 7, p. 31

 17
NZ TRANSPORT AGENCY RAPID TRANSIT COVID RECOVERY SCENARIOS
4.2 Impact across modes
Transport demand in Auckland decreased significantly across all modes as a result of COVID-19. This was
largely driven by New Zealand’s strict lockdown restrictions in Levels 4 and 3. The majority of businesses and
schools were closed, with movement limited to essential travel only (details on the Alert Level System are
provided in the Appendix). As restrictions eased to Level 2, there was a strong rebound in travel demand (seen
in Figure 4 below), however this varied across modes. This has continued as restrictions were further eased to
Level 1.
In all analysis, the baseline is defined as the week of 10-16 February 2020.

Change in Auckland’s weekly average transport demand*
 Public transport Cycling^
(Feb – May 2020)
Percentage of baseline* Private vehicles** Baseline*
 Level 4 Level 3 Level 2
125

100

 Cyclist data is
 75 unavailable for
 1 and 2 March

 50
 Public transport usage
 suffered the most rapid As at 31st May, PT
 25 decline to c.5% of baseline patronage has
 on average during Level 4 increased c.10-fold
 from its lowest levels
 0
 16 Feb 23 Feb 1 Mar 8 Mar 15 Mar 22 Mar 29 Mar 5 Apr 12 Apr 19 Apr 26 Apr 3 May 10 May 17 May 24 May 31 May

 Week ending
 Note: * Baseline figures are taken from transport volumes between 10-16 February 2020; ** Measures traffic volume on 32 selected intersections across the whole arterial network; ^ Cyclist count
 data is only taken from sites for which data is reported on all sample dates, and may bot include cyclists on the road where there are no counters
 Source: Auckland Transport; L.E.K. analysis

Figure 4 Transport demand by mode relative to Feb 10-16 baseline – Auckland

Public transport
Public transport usage in Auckland experienced the largest decline of all modes, falling to c.5%, c.12%, and
c.40% of baseline levels on average in Levels 4, 3 and 2 respectively. This is unsurprising as the largest users
of public transport are typically city centre (services-based) workers, university students, and school students,
the majority of whom were not permitted to travel during lockdown. As restrictions eased and people were able
to travel again, there was a clear recovery in public transport usage. Average weekly patronage during the week
ending 31 May 2020 was c.10 times higher than at the lows of Level 4 14.
The primary driver of the decline in public transport usage appears to have been the reduced need for transport
overall. In a customer survey conducted at the beginning of Level 2, 79% of New Zealanders claimed that their
reduced public transport usage was due to ‘reduced need’ 15, driven by the increase in unemployment and
working or studying from home due to the COVID-19 lockdown restrictions.

Private vehicles
Private vehicle usage in Auckland also decreased due to COVID-19 restrictions, albeit by a smaller margin.
Average weekly traffic in Auckland fell to c.24% and c.55% of baseline on average in Levels 4 and 3
respectively.16 Private vehicle usage has recovered faster than public transport and as of Level 2, had climbed
to c.84% of baseline levels. It is likely that this initial recovery was driven by the perceived health benefit of
observing physical distancing guidelines.

Active transport
In contrast to active transport in comparable international cities, cycling volumes in Auckland decreased during
lockdown to c.64% and c.63% of their baseline on average in Levels 4 and 3 respectively.17 Volumes remained
relatively constant, declining slightly to c.58% as restrictions were lifted to Level 2. Note: this data does not

14
 AT Hop Data
15
 Waka Kotahi COVID-19 Tracking Core Report Wave 7, p. 29
16
 AT traffic volumes on 32 selected intersections across the whole arterial network
17
 AT cyclist counts

 18
NZ TRANSPORT AGENCY RAPID TRANSIT COVID RECOVERY SCENARIOS
distinguish between commuter and recreational cyclists, or cyclists on the road instead of designated pathways
(where counters are located).
Pedestrian counts in the city centre showed a sharp decline to pre-COVID levels. This is likely to be a reflection
of the closure of the majority of city centre businesses during lockdown. Walking for local exercise and leisure
appears to have been resilient to lockdown restrictions across New Zealand, with c.80% of New Zealanders
surveyed claiming that they walk or cycle to keep fit/active 18.

4.3 Impact to rapid transit
The Rapid Transit Network (RTN) experienced a greater decline in patronage than the rest of public transport,
falling to c.3% and c.9% of baseline levels on average during Level 4 and 3. However, patronage recovered
quickly following the easing of restrictions, with RTN patronage rising to c.36% of baseline levels on average
during Level 2, and c.40% for the week ending 31 May 2020.
Figure 5 plots the recovery of RTN patronage across the various alert levels.

Weekly average RTN and non-RTN public transport patronage*
(Feb – May 2020)
Thousands of passengers per day
 Level 4 Level 3 Level 2
250

200

150
 Patronage of other PT modes
 declined to c.6% of baseline
 levels on average during Level
100 4 while RTN patronage Non-RTN
 declined slightly more to c.3%

 50
 RTN

 0
 9 Feb 23 Feb 8 Mar 22 Mar 5 Apr 19 Apr 3 May 17 May 31 May Week ending
 Indexed to baseline**
 100 100 105 105 102 84 14 5 5 6 7 11 14 22 42 45 Non-RTN
 100 106 110 117 112 90 13 3 3 3 3 7 9 16 38 40 RTN
 Note: * RTN patronage comprises Northern Busway and Train users; ** Baseline figures are taken from transport volumes between 10-16 February 2020; AT reduced
 the overall seated capacity of the public transport network to c.43% and c.22.5% of normal levels during Level 3/4 and Level 2, respectively
 Source: Auckland Transport; L.E.K. analysis

Figure 5 Public transport patronage relative to 10-16 Feb baseline, by RTN and non-RTN modes – Auckland

18
 Waka Kotahi COVID-19 Tracking Active Modes, p. 7

 19
NZ TRANSPORT AGENCY RAPID TRANSIT COVID RECOVERY SCENARIOS
4.4 Spatial and temporal impact
There was a drop in peak time driving during Levels 3 and 4, given that many workplaces were closed. Peak
traffic volumes increased with the easing of lockdown restrictions, in line with overall traffic growth. AM and PM
Peak traffic increased from c.20% and c.24% of baseline levels at Level 4, to c.77% and c.88% at Level 2 (see
Figure 6). In the same period, overall traffic increased from c.24% to c.82% of baseline levels 19. However, it is
important to note that this only includes traffic volumes at 32 intersections across New Zealand’s arterial
networks, and may vary across Auckland’s traffic network.
Weekly average AM and PM Peak traffic volume (32 intersections only)*
(Feb - May 2020) Level 4 Level 3 Level 2
Thousands of vehicles per day
 Level 4: 20% (AM) and 24% Level 3: 49% Level 2: 77% (AM)
240 (PM) of baseline levels (AM) and c.61% and 88% (PM)
 PM peak

180
 AM peak

120

 60

 0
 9 Feb 23 Feb 8 Mar 22 Mar 5 Apr 19 Apr 3 May 17 May 31 May
 Note: * AM Peak period includes 7-9am traffic and PM Peak includes 4-6pm traffic. Measures traffic volume on 32 selected intersections across the whole arterial network. Baseline figures are
 taken from transport volumes between 10-16 February 2020
 Source: Auckland Transport; L.E.K. analysis

Figure 6 AM and PM peak traffic counts (32 intersections only) – Auckland

4.5 Behavioural response to transport
New Zealand, through its early and restrictive lockdown, has completely eliminated the first wave of COVID-19.
Given the low number of infections and deaths seen in New Zealand, the long term behavioural responses and
sentiments towards the virus are likely to be markedly different to those in other parts of the world.
Survey data capturing weekly travel movements shows that in the short-term, New Zealanders reacted
cautiously and movements were limited. Between 10 and 17 May 2020, c.64% of New Zealanders only left the
house for essential reasons or did not leave the house at all. 20
Lockdown heavily restricted travel movements across all trip purposes, as even trips typically considered
essential (e.g. travel to medical appointments, grocery shopping) declined by c.20-30% across New Zealand.
This was similar internationally; for example, during lockdown in the UK, c.46% of people ceased all travel. 21
In New Zealand, caution has eased as restrictions ease, and there has been a slow return to baseline travel
patterns with travel for education relatively unchanged versus pre-COVID levels. During Level 2, there were
twice as many New Zealanders travelling to work compared to Level 4 (see Figure 7).
Despite this, work trips were only at 50% of pre-lockdown levels, with 40% of New Zealanders still working from
home.22 This figure is likely to fall with the nation now at Level 1, and restrictions fully eased. However, work
travel may be impacted longer-term as international surveys suggest that a greater desire to work from home
may become a long-term trend.23

19
 AT traffic volumes on 32 selected intersections across the whole arterial network
20
 Waka Kotahi COVID-19 Tracking Core Report Wave 7, p. 17
21
 Transport Focus, 2020. Travel during Covid-19 survey
22
 Waka Kotahi COVID-19 Tracking Core Report Wave 7, p. 20
23
 CNBC, 2020. CNBC/SurveyMonkey Workforce Survey, Q2.

 20
NZ TRANSPORT AGENCY RAPID TRANSIT COVID RECOVERY SCENARIOS
Reasons for travelling in the past week* – New Zealand
(2020)
Percent of respondents
100
 90 Pre-alert travel
 Level 4 travel
 73 Level 3 travel
 75 69 71
 Level 2 travel**
 58 60

 50 47 47 45
 44

 29
 25 23 22 21
 18
 15 13 14 15 14
 9 10 8 10 12 11
 0 2 1 0 1 2
 0
 Work Education Medical appointment Grocery shopping Walking or running Cycling for Travel to support Taking children
 for leisure/fitness leisure/fitness vulnerable to/from school
 friends/family
 Note: * Respondents include adults 15+ in New Zealand and were asked on how many days would you normally travel via each method during the past seven days;
 ** Alert Level 2 data includes activity from days at Level 3
 Source: Waka Kotahi COVID-19 Deep Dive Wave 7

Figure 7 Reported reasons for travel over the past week, by Level – New Zealand24
Proportion of working adults working from home – New Zealand
(2020)
Percent of respondents
100

 75

 50 48
 45
 40

 25

 9

 0
 Pre-alert work site Level 4 work site Level 3 work site Level 2 work site
 Source: Waka Kotahi COVID-19 working from home, p. 5

Figure 8 Proportion of working adults working from home, by Level – New Zealand25
Further increases in public transport usage are expected, with c.96% of New Zealanders claiming that they will
return to using public transport once the situation returns to normal, and c.79% at the end of the COVID-19 Alert
Levels.26 This is considerably larger than international examples; in the UK, only c.20% of people surveyed to
29 May 2020 reported that they are happy to use public transport when restrictions are relaxed.27 Significant
shifts to private modes have been noted in both China and the UK. 28
In response to the easing of restrictions across New Zealand, there has been a marked increase in people citing
accessibility issues as a reason for reduced public transport usage. During Level 2, c.24% of people reported
this, an 11% increase from Level 329. Accessibility issues have largely been driven by a reduction in service
frequency and a reduction in capacity30 (to meet physical distancing guidelines).

24
 ibid.
25
 Waka Kotahi COVID-19 Working from home, p. 5
26
 Waka Kotahi COVID-19 Tracking Core Report Wave 7, p.31
27
 Transport Focus, 2020. Travel during Covid-19 survey – week 3. May 21
28
 Ipsos Group, 2020. Cited in Borgomeo, V. (2020). Goodbye to public transport, after Coronavirus everyone in a private car. La Republica.
29
 Waka Kotahi COVID-19 Tracking Core Report Wave 7, p.29
30
 Waka Kotahi COVID-19 Tracking Core Report Wave 7, p.30

 21
NZ TRANSPORT AGENCY RAPID TRANSIT COVID RECOVERY SCENARIOS
In Auckland, attitudes towards public transport mirrored the rest of New Zealand’s general cautiousness during
lockdown. Before the country entered Level 2, over half (53%) of all Aucklanders claimed they would not feel
comfortable travelling on public transport, while 16% claimed they definitely wouldn’t travel on public transport in
the next few weeks31. The reasons for discomfort in using public transport (see Figure 9) appear to be the ability
to practise physical distancing (c.64%) and cleanliness (c.44%). However, this sentiment appears to be
softening, with the number of respondents expressing discomfort with physical distancing on public transport
falling by 8 percentage points from the previous week’s survey.
Reasons for discomfort using public transport – Auckland
(May 2020)
Percent of respondents
 100

 75
 64

 50 44

 25
 15
 11

 0
 I don’t think social distancing I don’t know if public The roasd are less congested, I don’t think the timetable
 is possible on public transport transport is clean enough so I would prefer to drive is back to normal
 Source: Customer Voice COVID-19 Pulse Survey

Figure 9 Reasons for discomfort using public transport – Auckland32
Satisfaction with public transport has remained high throughout the pandemic, with roughly c.83% of people
travelling on the network rating the service 8+/10. In addition, c.86% of people travelling on the network claim
AT has been effective in managing the threat of COVID-19. This suggests that public transport usage is unlikely
to suffer any significant sustained perception impact in the long-term.

31
 Customer Voice COVID-19 survey, AT
32
 Customer Voice COVID-19 survey, AT

 22
NZ TRANSPORT AGENCY RAPID TRANSIT COVID RECOVERY SCENARIOS
HISTORICAL EVENTS
 COMPARISON

 23
NZ TRANSPORT AGENCY RAPID TRANSIT COVID RECOVERY SCENARIOS
5. HISTORICAL EVENTS COMPARISON
The COVID-19 pandemic has limited comparable events. However there are two major historical examples of
exogenous shocks to transport systems. This section reviews the impact and trajectory of transport demand
recovery for the SARS outbreak and the 9/11 attacks.

5.1 Key learnings
 • Neither historic case provided evidence on the possibility of new business models and
 consumption patterns arising from the events: However, given the potentially longer time frame for
 COVID-19, behavioural substitution may be more likely
 • During SARS, public transport usage had a strong inverse relationship with the number of
 cases: Taiwan Metro usage experienced a maximum of decline of c.30%, before recovering to 2002
 levels 6 months after the initial outbreak
 • 9/11 had a significant but temporary impact on patronage as some stations required rebuilding.
 In contrast, economic recessions prolonged public transport recovery: Post the Global Financial
 Crisis, patronage only recovered to 2008 levels in 2011
 • The public showed a strong awareness of the risks of public transport during a health or
 security crisis, however this did not always translate to lower usage: Despite the high perceived
 risk of using public transport in Taiwan (up to c.65% in March 2003), avoidance remained low. This is
 likely due to low levels of car ownership – a factor not relevant in NZ
 • The nature of risks from SARS and 9/11 were qualitatively different to COVID-19: In both cases,
 the likelihood of the risk being present in public transport systems was controlled, with strong preventive
 measures in place. COVID-19 has already spread across the globe and it can be transmitted without
 symptoms rendering health checks at public transport interchanges less useful

 24
NZ TRANSPORT AGENCY RAPID TRANSIT COVID RECOVERY SCENARIOS
5.2 Recovery from SARS-CoV Outbreak, 2003
Patronage on Taipei City’s underground metro fell by c.30% during the peak of SARS between April-May 2003.
There were no significant new cases from June 2003, however demand did not recover back to trend till
October 2003. In Hong Kong, the relationship between cases and rapid transit was stronger.
Figure 10 below shows that there is a direct correlation between cases and patronage. As a result, demand
recovered back to trend much faster than in Taiwan.

 Monthly patronage on Extent of SARS outbreak Monthly patronage on Extent of SARS outbreak
 Taiwan Metro (Line) in Taiwan by week (Bar) Hong Kong MRT (Line) In Hong Kong by week (Bar)
 (2002-03) (2003) (2002-03) (2003)
 Millions of passengers Number of cases Millions of passengers Number of cases
 Similar impact, recovery
 35 500 80 700
 profile of Taiwan, albeit
 much quicker
 30 600
 400
 60
 25 -20% 500
 -31%
 Slower Direct correlation between
 recovery back 300 the extent of outbreak and
 20 400
 to trend patronage decline
 Almost equally 40
 15 Sharp drop in steep, but only 300
 partial initial 200
 patronage in line
 with cases recovery
 10 200
 20
 100
 5 100
 2002 2003 2002 2003

 0 0 0 0
 J F M A M J J A S O N D J F M A M J J A S O N D
 Y-o-Y Y-o-Y
 9 12 7 0 (31) (19) (6) (5) 5 1 (2) 0 7 4 (1) (20) (8) (1) 2 1 0 1 (1) 3
 growth (%) growth (%)
 Source: Metro Taipei; WHO; L.E.K. analysis

Figure 10 Impact of SARS outbreak on rapid transit patronage in Taiwan and Hong Kong, 2003
Survey data from Hong Kong shows that a significant proportion of the population perceived a higher risk of
using public transport during the outbreak, but only a smaller subset of this population changed their actual
travel practices (Lau, 2003). During the initial phase of the outbreak (21-28 March), the perceived risk of using
public transport increased from 40-67%, however only 14-17% avoided public transport during this time. In the
latter period (April 8 – May 12), perceived risk ranged between 38-55% and avoidance between 27-31%. The
discrepancy between perceived risk and actual avoidance is likely due to the discounting of individual risk and
lack of alternative travel options, since car ownership in Hong Kong is very low.

 25
NZ TRANSPORT AGENCY RAPID TRANSIT COVID RECOVERY SCENARIOS
5.3 September 11th Terrorist Attack, 2001
Figure 11 shows the trajectory of demand for the New York Subway and commuter services (Long Island
Railroad, Metro-North, and PATH) between 1998 and 2012. Significant reduction in patronage after the terrorist
attack was only evident for PATH, as the station was closed due to substantial damage. Given that 9/11
occurred in the midst of the Dot Com bubble, it is difficult to separate out the impact of the two events. Ridership
then continued to increase until the Global Financial Crisis in 2008. After this economic downturn, it took three
years for demand to recover, a substantially more prolonged impact than from 9/11.
Annual patronage in New York, by mode*
(1997-2012)
Millions of trips
 Dotcom crash GFC
3,000 9/11 2,835 2,751 2,786 2,826 2,835
 2,734
 2,630
 2,526 2,552 2,460 2,482 2,528 PATH
2,500 2,368 2,385
 2,249
 2,082 Metro North
2,000 Fall in PATH usage post-
 9/11 due to closure of LIRR
 damaged stations for
1,500 rebuilding

1,000
 2-3 years after 9/11, Even in 2012, a few years Subway
 patronage had after the GFC, YoY
 500 approximately recovered to growth in patronage was
 trend as low as 0.3% in 2012

 0
 1997 1998 1999 2000 2001 2002 2003 2004 2005 2006 2007 2008 2009 2010 2011 2012
 Δ YoY 8.0 5.3 6.7 1.0 (3.6) (3.0) 4.1 1.8 4.0 3.9 3.7 (3.0) 1.3 1.4 0.3
 %
Note: * The LIRR (Long Island Rail Road) and Metro North Railroad are commuter rail systems operating in the south-eastern and northern suburbs of New York respectively, while the Subway
 and PATH (Port Authority Trans-Hudson) are rapid transit systems, with the latter operating in New Jersey and New York City
Source: NY Department of Transportation; L.E.K. research and analysis

Figure 11 Annual Patronage, NY Subway and commuter transit

 26
NZ TRANSPORT AGENCY RAPID TRANSIT COVID RECOVERY SCENARIOS
INITIAL COVID RESPONSE

 27
NZ TRANSPORT AGENCY RAPID TRANSIT COVID RECOVERY SCENARIOS
6. INITIAL COVID RESPONSE
6.1 Key findings
 • The initial response to COVID-19 by transport providers globally was varied: each jurisdiction took
 a slightly different response, in terms of lockdown timing and severity
 • Across most cities, proactive and precautionary measures were adopted, with a focus on driver
 safety: cities implemented rear-door boarding, barriers for driver separation and suspended cash
 payments or stopped collecting fares altogether
 • Broader innovations in urban design and incentive schemes were also implemented to ensure
 safety and encourage the use of sustainable modes: examples of changes to street design include
 temporary bike lanes, widening of footpaths and car-free zones. Incentives for a shift to sustainable
 modes include increased congestion charges and targeted funding for zero-emission buses

6.2 Initial global response
Government policies set out the conditions of lockdown for individuals and businesses, however for public
transport agencies and providers, the specific measures taken were at the discretion of each city according to
their resources and emergency planning. All cities implemented rear-door boarding33, installed physical barriers
to ensure distancing for drivers and suspended cash payments or stopped collecting fares altogether. These
measures align with the guidance provided by the International Association of Public Transport (UITP) 34.

Public transport response during COVID-19
During lockdown, the primary focus for transit operators was ensuring physical distancing for drivers and
passengers, and preventing the spread of COVID-19 via contaminated surfaces. Table 1 summarises the
measures adopted in the four international comparators and Auckland.
Overall, changes in the operation of public transport services were proactive and precautionary. It is difficult to
detect relationships between their implementation and rates of infection as, even in cities where the outbreak
was relatively minor, strict measures were implemented to prevent the spread of COVID-19.
There is little evidence to verify the effectiveness of specific measures, with the exception of disinfection.
Disinfection of surfaces was found to be c.77% effective at stopping the virus from spreading35. However there
is some data to suggest that public transport drivers are at higher risk of contracting COVID-19. In the U.K., the
average male death rate due to COVID-19 was 9.9 per 100,000, while the rate for bus and coach drivers was
26.41. The risks to transit drivers are significantly less than those for bus drivers36. However, protective
equipment is still essential.

Table 1 Measures adopted by public transport operators in response to COVID-19, across selected
geographies37

 Brisbane Vancouver San Diego Hamburg Auckland
 Driver safety
 Rear-door boarding ✓ ✓ ✓ ✓
 Barriers separating drivers ✓ ✓ ✓ ✓ ✓
 Mandatory face masks ✓ ✓ ✓ ✓
 Daily temperature checks for drivers ✓
 Physical distancing
 Extra sanitisation of stations, vehicles ✓ ✓ ✓ ✓

33
 In some instances, front-door boarding was possible for mobility-disadvantaged passengers
34
 UITP, 2020. Management of COVID-19: Guidance for transport operators. International Association of Public Transport.
35
 BMJ Global Health journal
36
 Office for National Statistics, 2020. Coronavirus (COVID-19) related deaths by occupation, England and Wales: deaths registered up to
and including 20 April 2020.
37
 Data obtained from transport providers: Translink Queensland, Translink Vancouver, San Diego MTS, Hamburger Hochbahn, Auckland
Transport

 28
NZ TRANSPORT AGENCY RAPID TRANSIT COVID RECOVERY SCENARIOS
You can also read