Bowls 2020 Securing our Future Bowls New Zealand Facilities Strategy
←
→
Page content transcription
If your browser does not render page correctly, please read the page content below
Bowls 2020
                Securing our
                   Future

                      Bowls New
                       Zealand
   Facilities Strategy
Author:         Dr. D Mowbray
                Gryphon Management Consultants

C:\Users\ritesh\Desktop\Bowls NZ - Facilities Strategy Report - Final 191212.doc
Confirmation of neutrality

Gryphon management consultants confirm that the consultant who undertook this review has no
connection or association with any club, person or organisation that may have influenced their
ability to produce this report in a completely unbiased way.

                                                                                                 2

      Gryphon Management Consultants – Private and Confidential     Bowls NZ – Facilities Strategy
Contents

   Confirmation of neutrality ........................................................................................................ 2
   Figures ..................................................................................................................................... 4
   Tables ...................................................................................................................................... 4
Forward ........................................................................................................................... 5
Section 1: Executive Summary and Strategy Recommendations......................................... 6
      Single community clubs ................................................................................................................................. 6
      Metric Development ...................................................................................................................................... 6
      2020 Partnership Model ................................................................................................................................ 7
      Stakeholder engagement and working collaboratively ................................................................................. 7
      Home of Bowls ............................................................................................................................................... 8
      Board Action .................................................................................................................................................. 8
Section 2: Overview .......................................................................................................... 9
   Historical Reports ..................................................................................................................... 9
   Current position ....................................................................................................................... 9
      Partnership with Stakeholders ..................................................................................................................... 10
      Community and metropolitan clubs ............................................................................................................ 11
   Bowls Is Unique...................................................................................................................... 13
Section 3: Development of Metrics .................................................................................. 14
      Demographics .............................................................................................................................................. 15
      Population Density ....................................................................................................................................... 15
      Calculations .................................................................................................................................................. 17
      Financial Measures ...................................................................................................................................... 20
      Practical Justification .................................................................................................................................... 20
Section 4: Data Analysis.................................................................................................. 21
      Summary ...................................................................................................................................................... 23
      Membership Fees ........................................................................................................................................ 23
      Club Members per Club ............................................................................................................................... 27
      Conclusions .................................................................................................................................................. 29
   Green Utilisation .................................................................................................................... 31
Section 5: A Vision of the Future ..................................................................................... 33
   2020 - Partnership Model. ...................................................................................................... 34
   Club partnership in action - Howick Bowling Club .................................................................... 36
      “2020 Partnership” Example – 1 .................................................................................................................. 36
      “2020 Partnership” Example – 2 .................................................................................................................. 37
      Recommended Venue Numbers .................................................................................................................. 40
   Implementation ..................................................................................................................... 42
Section 6: Home of Bowls................................................................................................ 44
   Appendix 1: National Venue Data – Lease, Facilities and Green Condition ................................ 49
   Appendix 2: Country Clubs – One club Communities................................................................ 71
   Appendix 3: Example of metrics applied to Auckland – Nth Harbour ........................................ 80
   Appendix 4: Example of metrics applied to Auckland – Central ................................................ 82

                                                                                                                                                                      3

         Gryphon Management Consultants – Private and Confidential                                                    Bowls NZ – Facilities Strategy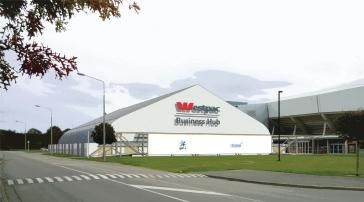
Figures

Figure 1: Calculation of average member number needed .................................................................. 28
Figure 2: Green utilisation – maximum playing days per week ............................................................ 31
Figure 3: Member's preparedness to travel ......................................................................................... 35
Figure 4: Process of Implementation .................................................................................................... 43
Figure 5: College Rifles – Auckland Figure 6: Westpac Business Hub – ChCh................................... 44
Figure 7: Bespoke design and build indoor bowling stadium design.................................................... 45

                                                                 Tables

Table 1: Country and State population densities.................................................................................. 16
Table 2: City population densities ......................................................................................................... 16
Table 3: Population per venue .............................................................................................................. 17
Table 4: Suggested club/venue numbers.............................................................................................. 19
Table 5: Average New Zealand clubs financial results. ......................................................................... 22
Table 6: Refined financial view of an average clubs ............................................................................. 23
Table 7: Regions Represented in Survey Results .................................................................................. 24
Table 8: Members vs pay-for-play ........................................................................................................ 26
Table 9: Average Revenue Expenses and Grants .................................................................................. 28
Table 10: 2020 partnerships - membership decline 09 - 11 ................................................................. 37
Table 11: 2020 partnerships - membership decline 09 - 11 ................................................................. 38
Table 12: Number of venues recommended. ....................................................................................... 40
Table 13: Venue Numbers .................................................................................................................... 41

                                                                                                                                             4

         Gryphon Management Consultants – Private and Confidential                                  Bowls NZ – Facilities Strategy
Forward
Bowls in New Zealand, like many other sports, is in transition. This transition affects the very
foundation on which the sport was built, membership. For decades, being a member of a sporting
club was considered the norm; in fact, if you were not a member of a sporting club, you were in the
minority. This is no longer true; there has been a generational shift in how people consume sport.
There is still the traditional member who pays a subscription and joins the club. However, more and
more this model is being challenged by a range of generational, economic and other forces that are
changing the landscape for sport participation in New Zealand – e.g. passive participation (watching),
participating in multiple sports, or pay-for-play.
Evidence of this is plentiful, with bowls being a perfect example. The last decade has seen club
membership steadily decline – some might say rapidly – whereas pay-for-play participation numbers
have remained steady. This highlights an important fact. People still want to participate in bowls.
However, they want to participate in forms of the game that suit them, for example Mates in Bowls,
or corporate bowls. Therefore, bowling clubs must adapt and change the way that participants can
consume the sport, and the places where it is played, to accommodate the requirements of the new
generations (baby boomers, X and Y). If change does not occur at all levels of the sport, bowls will
continually struggle against more innovative, less change-resistant sporting codes and recreational
providers.
Unlike previous reports, this report seeks to create a platform for change leadership at all levels
within bowls, leadership that creates a climate where the truth of the situation facing bowls is heard,
the brutal facts confronted, and a plan of action developed. Understanding the severity of the
current situation will, it is hoped, provide clarity as to why the actions outlined in this report are
needed.
The current number of clubs in New Zealand is unsustainable. This strategy provides a mechanism
and strategic direction that, if followed, will redefine the landscape of bowls in New Zealand.
No matter what this report recommends, nothing will change unless the sporting community of
bowls recognises the need and creates an environment where change is welcomed, instigated and
supported through its journey.
5
Gryphon Management Consultants – Private and Confidential Bowls NZ – Facilities StrategySection 1: Executive Summary and Strategy Recommendations
The name of this report – Bowls 2020, Securing our Future – was chosen because it reflects the level
of commitment required by everyone involved in the sport of bowls, if the objectives outlined in this
report are to be achieved. Bowls 2020 fits with Bowls New Zealand’s stated objectives as outlined in
the One Bowls: One Vision strategy. While the tone of this report may at times appear negative, it
reflects the current situation bowls finds itself in. However, it is not all negative. Far from it. Bowls
has taken significant strides forward, initiating some innovative and sector-leading programmes for
the development of the game.
Detailed below are the recommendations from each of the sections of this report. The
recommendations are not a smorgasbord in which the sport can take what it likes and ignore the
rest. For bowls to achieve its stated vision – to be the best bowling country – and its mission –
Bowls is enjoyable, entertaining and accessible to all New Zealanders – now and into the future –
it must follow all the recommendations contained in this report.
Within the report, two symbols are used to highlight recommendations and key points or facts. The
light bulb indicates a recommendation of this report, while the triangular warning signal indicates an
important fact/message.
Single community clubs
There are 250 communities for whom the bowling club is or could be a key part of the
communities’ infrastructure and community life. It is neither a desired outcome of this
report nor would it be desirable for these communities to lose a key community asset, the
bowling club (refer Appendix 2)
Metric development
These sections detail how the calculations for venue numbers were developed. The identified range
of demographic and financial metrics is suitable for Bowls NZ to use in determining the facility needs
for regions, cities and towns across New Zealand.
These metrics determine a base number of clubs required for the development and growth of bowls.
This is a base not a fixed number. Other factors – such as the current state of facilities, geographic
setting, ability to grow (space for greens, etc.) demographic mix, current sites – must also be taken
into account, as must the desire to grow the overall strength of the game.
Strategic Recommendation:
These metrics are used to determine future needs and development of club partnerships:
- Auckland – population to a venue ratio: 20,000 (i.e. one venue per 20,000 citizens for
Auckland)
- Other cities/towns – population to a venue ratio: 18,000
6
Gryphon Management Consultants – Private and Confidential Bowls NZ – Facilities Strategy- A 2km (for Auckland) and 3km (for other cities) radius of catchment for clubs.
- Average member number 187.
There has been a subtle yet significant change in terminology in the ratios above. These
ratios are for ’venues‘, not clubs. This is because the rationalisation model (2020
partnerships) discussed in this report is based on a venue with multiple clubs, not a single
club per venue.
2020 Partnership Model
The development of the proposed “2020 partnership” model provides a mechanism through which
rationalisation of venues can be achieved. The 2020 partnership facilitates the efficient use of
facilities, finances, and so on between clubs that are within an identified geographic zone (2km in
Auckland and 3km in other towns and cities). These 2020 partnerships have attributes that will make
them attractive to the bowling community:
- Clubs do not have to change or lose their identify (names).
- Clubs do not have to give up playing and competing for club trophies.
- Clubs do share facilities.
- The partnership does have a single management structure.
- All clubs are represented in that structure (controlled within the constitution).
- The structure allows clubs to develop marketing and promotional plans that maximise the
assets and attributes of the partnership clubs.
The 2020 partnership model may be seen by some as just another way of describing a merger. This is
not the case as the clubs involved in these partnerships retain their club names and their playing
history through continuing to play for their club trophies, etc. Furthermore, these partnerships will
ensure the survival of the clubs and their history and heritage. That would be something to be proud
of!
However, the described 2020 partnership model does not preclude clubs from merging if that is
agreed upon by the clubs as the best way forward.
Strategic recommendation:
That the 2020 partnership model be adopted and used in all future rationalisation projects.
Stakeholder engagement and working collaboratively
While there are a number of critical components to the successful implementation of the
recommendations in this report, none are as critical as the support or at least non-opposition of
major stakeholders (Government agencies, councils, community boards, gaming/trust funders) who
support or fund outcomes that are detrimental to the strategy’s desired outcomes.
7
Gryphon Management Consultants – Private and Confidential Bowls NZ – Facilities StrategyStrategic Recommendation:
This document and the developed plans are the basis for agreement with major
stakeholders on when and in what form their support will be provided.
Important Message
Collaboration between the sport’s stakeholders, in particular councils, Sport NZ, funders and
community boards, is critical to this strategy’s success. Without an overarching agreement
between these organisations and Bowls NZ describing how these partners will work towards
the achievement of this strategy, the desired outcomes may not be possible.
Home of Bowls
Strategic Recommendation:
Develop a Home of Bowls in Auckland, Wellington and Christchurch.
Bowls NZ and Regional Service Centres work with councils and other partners to support the
development of a ‘Home of Bowls’ within each region.
The Regional Service Centres in conjunction with Bowls NZ prepare a detailed development
plan for a ‘Home of Bowls’ in each of the main regions – Auckland, Wellington and
Christchurch (in that order of importance).
Core Requirements
- Central locality
- Good parking
- Housed as part of a larger project reduces running costs.
- Possibility of being part of a ‘sportsville’ type project
- Excellent access to pay-for-play participants via the population who attend/use the
other sport facilities
- Location supports one indoors and an outside (natural) green
- Partnering with the community opens additional funding streams.
- Access to the central city (Mates in Bowls, corporate bowls, etc.).
Board Action
The following are the suggested motions that the board should pass to start the journey towards
Bowls 2020 – Securing our Future:
Motion 1: The board receives the Mowbray report and its recommendations.
Motion 2: The board adopts the recommendations contained in the
Mowbray report.
8
Gryphon Management Consultants – Private and Confidential Bowls NZ – Facilities StrategySection 2: Overview
Historical reports
Since 1996/97 there have been several reports written and meetings held to discuss how club
rationalisation could occur. These historical conversations have relied on perceptions of need,
personal preferences and biases, and/or other agendas (personal, club, centre or nationally driven)
to determine how many clubs may be needed and/or which clubs in a community should or should
not be merged. These perceptions and historical discussions have been supported by a number of
reports (Freeman, 2003; Ineson, 2008, 2009, and others). While these reports have engendered a
great deal of discussion, both critical and complementary, the actions or outcomes have not lived up
to anyone’s expectations. It is fair to say that after more than a decade of discussion, report writing
and meetings the situation that bowls in New Zealand finds its self in is unchanged – except that its
membership has declined even further.
Current position
The sport of bowls has experienced a shift in participant emphasis,
from the club-focused participant to one in which the majority of - Membership of bowls
people enjoying a game of bowls are casual pay-for-play participants. clubs has declined more
Bowls New Zealand understands the current number of clubs (583) is
than 17% over the last 4
simply unsustainable given the small memberships of most clubs.
years (07 – 11)
Some of these 583 clubs have as few as 15 members.
- Achieves indentified
A steady and significant decline in membership has been occurring for
more than a decade. Membership in Bowls NZ declined by more than
decline in membership
17% between December 2007 and December 2011. In 2007, a report
4 years earlier than
by Ineson predicted that membership numbers would drop to
predicted
approximately 41,000 by 2017. The 2011 returns show that this
decline in membership will occur 4-5 years earlier than Ineson
suggested, hardly the type of performance bowls wanted to achieve.
However, pay-for-play participant numbers have remained static. Pay-for-play participants now
exceed members by more than 10% annually. The pay-for-play market offers bowling clubs and
Bowls NZ a platform on which the development of the game and club financial security could be
based.
In recent research (Gemba) the X and Y generations were asked which statements they associated
with bowls and other sports (including sailing, cricket, opera, tennis, and art galleries). The
respondents (aged 16-64) indicated that “boring” and “for old people” were the statements that
best described bowls for them. While not a great result, the same demographic also identified that,
9
Gryphon Management Consultants – Private and Confidential Bowls NZ – Facilities Strategyfor them, bowls was ageless and cared for the community. These are great attributes that help offset
the boring and for old people statements. Recognition of bowls as ‘ageless’ is particularly important
as it suggests that respondents do not see age as a barrier to playing.
The good news is that the strong support from pay-for-play
16 – 64 year olds said participants (static numbers in a heavily declining market) creates a
Bowls was: pathway on which bowls within New Zealand could not only
- Boring regenerate clubs but also develop (longer term) a new crop of
- For old people possible members. Strong support for the pay-for-play (ageless)
model of bowls highlights that casual players of all ages enjoy playing
bowls when played in a format that suits their needs. This indicates
They also said bowls that products such as Mates in Bowls and corporate bowls are
is: satisfying a target audience. They do, however, need to be more
- Ageless heavily marketed in all areas. These and similar products may provide
- Caring about the Bowls NZ and its affiliated clubs an opportunity to ride the wave of
change in how future generations engage in recreational pastimes,
community
for example becoming entertainment providers through products
Gemba research; n = 6125 such as corporate bowls and Mates in Bowls, which in turn support
club activities.
Declining membership and the excessive numbers of clubs are issues that have been identified in
reports by Freeman (2003)1, Ineson (2007, 2008, 2009)2, Mowbray (2011)3 and Stevenson (1998)4.
The lack of action from the bowls community following these and other reports is an indictment on
the culture and perspective of all those involved in the sport. Therefore, if this report’s final
conclusions and recommendations are to be more than another doorstop and the sport is to stop
the accelerating decline in membership, changes must occur in the culture of all those involved.
Partnership with stakeholders
Bowls NZ and its stakeholders need to coordinate their support in assisting the community (clubs
and bowlers) towards a better future. These stakeholders include city councils, community boards,
regional sport trusts, and gambling and trust funders, all of whom must work collaboratively to
ensure a coordinated approach.
For example, gambling and trust funders work collaboratively to ensure funds are supplied
preferentially to clubs identified as “2020 partnerships", and councils must prioritise and coordinate
the renewal and allocation of leases for 2020 partnerships. It is through this collaborative approach
1
Auckland Bowls Association Facilities Strategy, Freeman and Associates June 2003
2
Report on the Health of Wellington Bowling clubs in the Upper and Lower Hutt City Council Regions, March
2009; Report on health of Wellington Bowling Clubs, November 2008; Report on the Capability of Bowls NZ
Centres, 2007.
3
Strategic review of the status of bowling clubs (Canterbury)
4
A future for bowls in New Zealand, 1998
10
Gryphon Management Consultants – Private and Confidential Bowls NZ – Facilities Strategythat bowls in New Zealand will reap the benefits of any proposed changes. This is discussed in more
detail later in the report.
Collaboration between the sport’s stakeholders, in particular councils, Sport NZ, funders
and community boards, is critical. Without an overarching agreement between these
organisations and Bowls NZ describing how these partners will work towards the
achievement of this strategy, the desired outcomes may not be possible.
The urgency and importance of this cooperative approach is best demonstrated with data from the
player returns (Table 8) for all clubs in New Zealand provided by Bowls NZ for 2011. These highlight
that casual player numbers have remained relatively stable (falling from 51,736 in December 2007 to
(48, 764) in December 2011), while membership numbers have declined by 17.67% (9,145 members)
over the same period. This is a significant and worrying decline.
If the current rate of decline (17 %+ over four years to December 2011) is left unchecked,
the sport of bowls will essentially disappear from the New Zealand sporting landscape in
less than two decades.
This data casts a spotlight on the need for action that requires the whole bowls community to adapt
how their sport and clubs operate. The changes recommended in this report will help facilitate
change. However, none of the recommendations will in themselves achieve the desired outcomes.
They require the bowls community to put aside self-serving agendas and concentrate on
implementing the recommendations of this report to restore the game of bowls to the strength it
once had.
Community and metropolitan clubs
Discussion on the ideal numbers of clubs must be based on the following facts. Currently in New
Zealand there are 583 bowling clubs affiliated to Bowls NZ. Of
these, 250 clubs are based in single club communities, i.e. one club
in a small rural community. The remaining clubs (333) are situated Of the 583 bowling clubs
in metropolitan areas, i.e. there are two or more clubs within the
in New Zealand, 250 are
boundaries of the town/city. While rationalisation of clubs across
New Zealand may be desirable, there are 250 communities for in single club
whom the bowling club is or could be a key part of the communities
community’s infrastructure and community life. It is not a desired
outcome of this report, nor would it be desirable, for these
communities to lose a key community asset, the bowling club.
The importance of community clubs to the communities they are in became obvious during my visits
throughout New Zealand. It was obvious that these clubs cannot be treated the same as
metropolitan clubs. Therefore, it is critical that, while developing a process for club rationalisation
the community clubs are encouraged to become a community focal point. For example, the facilities
could be utilised by Plunket groups, play groups, theatre groups and darts etc. These and many other
11
Gryphon Management Consultants – Private and Confidential Bowls NZ – Facilities Strategycommunity groups would welcome the opportunity to share facilities and would in this process
contribute (in whatever way possible) to the maintenance of the facilities. This strategy of
developing “community clubs” should be developed in conjunction with, but separately from, the
2020 partnership strategy.
Therefore, even though the emphasis of this facilities strategy is on developing a facilities strategy
for the rationalisation of clubs across New Zealand, the importance of these community clubs has
resulted in the metrics and processes for developing a facilities strategy being focused on the
metropolitan areas of New Zealand. In this report, metropolitan is defined as towns/cities in which
two or more clubs are situated within the confines of the town/city boundaries.
All clubs identified as community clubs (Refer Appendix 2) should be excluded from the
calculations of numbers of clubs (Table 12) in this report.
While there are 257 community clubs, some of these are men’s and women’s
clubs operating from the one venue.
12
Gryphon Management Consultants – Private and Confidential Bowls NZ – Facilities StrategyBowls is unique
A number of aspects make bowls a unique sport when developing a facilities strategy. Unlike other
sports within New Zealand, bowls owns or independently leases, maintains and pays for the grounds
used to play the sport. In comparison, other sports such as rugby, cricket, basketball and football,
have their facilities requirements mainly meet by councils, local boards or the government.
Furthermore, these same sports are in the main demanding more space and public funding (e.g.
cricket in Christchurch) from local councils and community boards or nationally by the government
(e.g. Rugby World Cup grounds).
An even more fundamental difference is that, while other sports are seeking more help and space
from councils and government to provide more facilities, bowls is actually seeking to reduce the
number of club facilities (venues). This proposed rationalisation and development strategy will result
in local bodies and councils getting useful tracts of land (each approximately 4000sq metres)
returned to them for use as infill housing or other socially valuable community activities or projects.
This defining difference, the desire to reduce facility (venue) numbers, separates this bowls strategy
from the strategies of other sports. For partners and stakeholders, this means that bowls must not
be lumped in with other sports, but given priority support during the entire life-cycle of the strategy
implementation. This is achieved by providing priority access to the full range of services and
support provided by their organisations.
These ratios are for ’venues‘ not clubs. This is because the rationalisation model (club
partnerships) discussed later in this report is based on a venue with multiple clubs, not a
single club facility.
13
Gryphon Management Consultants – Private and Confidential Bowls NZ – Facilities StrategySection 3: Development of metrics
Securing the future requires that the bowls community bowls takes an informed and pragmatic
approach to determining its needs in relation to the number and position of venues. The following
discussion details a method that allows Bowls NZ and their strategic partners (councils, Sport NZ,
funders, etc.) to identify a base number of venues required in a region. This supports the
development of a rationalisation plan based on the developed process detailed in Section 4.
Benchmarking is a trusted method of measuring the performance of one sector against another.
Benchmarking raises two questions: (1) which of the countries (Refer Table 1) is closely aligned to
New Zealand (culturally, the way the game is structured, etc.), thereby, providing a suitable
benchmark; and (2) which demographic metrics are applicable within the New Zealand context.
An extensive search of online and hard data found no existing analysis or process by which a sport
organisation such as Bowls NZ could with certainty determine how many venues a town or city may
sustain. Therefore, an analysis based on venue and membership numbers combined with
demographic data was used for determining Bowls NZ’s venue (club) needs.
Understanding the demographics (population density, age, etc.) of the population and the various
towns and cities is important in the development of metrics. For example, New Zealand has an aging
population with the estimates suggesting that 1 in 4 New Zealanders will be aged 65+ by 2030.5 A
detrimental outcome for bowls of this aging population is that the population which attributed the
statements “boring and for old people” (Gemba, 2011) to the sport of bowls are the same
population bowls needs to engage with. However, this same group also associated “ageless” with
bowls.
This dichotomy of bowls being perceived as “for old people” and “ageless” presents an exceptional
opportunity for bowls to engage this aging demographic through innovative formats of the game
and a reassessment of what a good club looks and feels like, to provide the participant with what
they are seeking. This unique opportunity of one in four New Zealanders moving towards what is
perceived as the ideal age for bowls reinforces the need to review and change how venues are
structured. Failure to grasp this opportunity will result in the identified demographic (65+ age group)
being enticed by another sporting/entertainment pastime.
The collected data (Tables 2,3 and 4) details the number of bowling clubs, membership and other
demographic data for New Zealand, Australia, the states of Queensland and New South Wales (both
Australia) and the United Kingdom (England, Ireland, Wales and Scotland). These countries and
states were chosen because of their strong cultural and historical ties to New Zealand, along with
the long history of playing bowls that these countries share with New Zealand.
While Auckland (Auckland, North Harbour and Counties Manukau regions) has a separate report, the
data used in the Auckland strategy is a reflection of the data in this strategy. For clarity, the
5
http://www.stats.govt.nz/browse_for_stats/people_and_communities/older_people/demographic-aspects-
nz-ageing-population.aspx
14
Gryphon Management Consultants – Private and Confidential Bowls NZ – Facilities Strategypopulation, geographical boundaries and general information relating to Auckland and referred to in
this report is based upon the definition of the city as prescribed in the super city legislation.
The following analysis reviews a range of metrics relating to population, club numbers, average
membership and financial measures to determine its usefulness as part of an overall process for
developing a facilities strategy. The desired outcome was the identification of metrics that can be
utilised by Bowls NZ in future rationalisation projects.
Demographics
Demographic data is widely used for a range of commercial and non-commercial applications to
assist organisations, firms and governments to develop a range of strategies, e.g. marketing,
housing, health, production needs, etc. Demographics may be equally important in determining the
spread and density of venues in relation to population growth, membership profile, etc. for Bowls
NZ.
Population density
Population density (citizens per square kilometre) indicates that Sydney (Table 2) with a population
density 2058/km² may be able to sustain more venues in a smaller geographic area than Brisbane
(346.0/km²). This is because the population bases on which venues draw are more densely
compacted. However, whereas Sydney’s population density is very high, the state of New South
Wales (NSW) of which Sydney is the capital, has a population density of only 9.12/km2. This indicates
that NSW may need less, more geographically spread venues. This apparent disparity highlights that
while the population density metric can be helpful it must be viewed in context (e.g. Sydney’s needs
are significantly different to those of the State of NSW when viewed in isolation).
Analysis of New Zealand (Table 2) highlights that the population density in our main cities varies
significantly, from Auckland (2,700/km2) to Dunedin (460/km2). Therefore, while population density
may be a practical indicator, it is unsuitable as a single indicator of a town or city's ability to
develop/sustain multiple bowling venues. Neither is it a reliable indicator of the total number of
venues that could be sustained. A more appropriate metric may be found by reviewing the current
number of venues and their ratio to the populations of the cities/towns they are in (Table 4).
15
Gryphon Management Consultants – Private and Confidential Bowls NZ – Facilities StrategyTable 1: Country and State population densities
Country Population Density
New Zealand 16.5/km2
Australia 2.8/km2
Queensland 2.61/km2
New South Wales 9.12/km2
England 395/km2
Ireland 73.4 /km2
Scotland 65.9/km2
Wales 140/km2
United Kingdom 255.6/km2
Table 2: City population densities
City Population Density
Auckland 2,700/km2
Wellington 890/km2
Christchurch 840/km2
Dunedin 460/km2
Hamilton 1,500/km2
Brisbane 346.0/km²
Sydney 2058/km²
Analysis (Table 3) of the selected comparison countries and cities clearly identifies that in
comparison to Australia (11,694 people per bowls club), New South Wales (12,358) and Queensland
(13,838) the ratio of population to venues in New Zealand (7,335 people per bowls club) is very low.
This reinforces the anecdotal evidence that New Zealand has too many venues. Comparing Auckland
City (14,152), to Brisbane (17,500) or Sydney (26,903) highlights that Auckland has a lower ratio of
population to venues than either of those Australian cities, adding weight to the view that Auckland
has too many venues.
Shifting the focus to the United Kingdom and its constituent countries (England, Wales, Scotland and
Ireland), the population to venue ratio is significantly different to that of Australia or New Zealand.
The ratio of members to citizens (Table 3) indicates that lawn bowls (outdoors) in England, Ireland
and Wales does have the same acceptance and reach when compared to Australia, New Zealand or
Scotland. It should be noted that in the case of England, Ireland and Wales the fractured nature of
the sport of bowls may have a significant influence on this data. For example, indoor bowls is
controlled by a separate national organisation which is not affiliated to World Bowls, the
international governing body of bowls, whereas in New Zealand and Australia all bowls (indoor and
outdoor) is controlled by a single national governing body. However, the figures clearly show that
England, Ireland and Wales are in a similar or worse situation to New Zealand, a small membership
base and too many facilities.
16
Gryphon Management Consultants – Private and Confidential Bowls NZ – Facilities StrategyFrom the data gathered and an analysis of the organisational structures of bowls in the United
Kingdom and Australia, it is evident that Australia is likely to provide the best comparisons for
developing venue benchmarks for New Zealand. However, it should be noted that a significant
number of venues in Australia have very large social memberships. Therefore, any data or
comparisons made have had the social membership numbers removed. This allows a more equitable
comparison to be made.
Table 3: Population per venue
Ratio
Total Population Avg playing
Country / State Clubs Members members to
population per club membership
citizens
New Zealand 583 43,985 4,433,100 7,603 75 1 – 100,000
Auckland 103 10,070 1,507,700 14,637 98 1 – 149,000
Wellington 34 3475 490,100 14,414 102 1 – 141,000
Christchurch
43 3837 367,700 8551 85 1 – 96,000
(greater)
Australia 1961 221,132 22,933,010 11,694 112* 1 – 104,000
New South Wales 591 80,806 7,303,700 12,358 136* 1 – 90,000
Sydney 172 29,017 4,627,345 26,903 168 1 – 159,000
Queensland 331 43,571 4,513,850 13,838 131* 1 – 104,000
Brisbane 68 9009 1,190,0586 17,500 132 1 – 132,000
England 2461 132,116 52,234,000 21,224 54 1 – 395,000
Ireland 112 6498 6,380,661 56,970 58 1 – 982,000
Scotland 894 76330 5,254,800 5,877 85 1 – 69,000
Wales 277 11814 3,006,400 10,853 42 1 – 254,000
Calculations:
Population per venue: total population divided by total venues
Ratio citizens to members: Population per venue divided by average membership
(gives an indication of community involvement in bowls venues, all numbers
rounded up)
6
http://www.bowlsaustralia.com.au/fileadmin/user_upload/bowls_aus/About_Us/Census/1495_QLD_2011_Ce
nsus_Snapshot.pdf
17
Gryphon Management Consultants – Private and Confidential Bowls NZ – Facilities Strategy* Playing membership is those members identified as having played bowls in the 2011
census conducted by Australian bowls. This is approximately 48% of total venue
membership.
All player and club data for Australia was drawn from their 2011 census data, available
at; http://www.bowlsaustralia.com.au/index.php?id=3636
For the remainder of this analysis Australia, and in particular Queensland and New South
Wales, will be used to develop metrics against which New Zealand can be measured, while
Brisbane and Sydney will be used as benchmarks for New Zealand cities.
Determination of a benchmark number of venues for New Zealand used a midpoint between the
Queensland (13,838) and New Zealand (7,335) to provide a New Zealand country ratio of 1 – 10,600
(citizens to venue). Queensland was used for three reasons: (1) the population base was closest to
that of New Zealand; (2) the membership base was similar; (3) the member to citizen’s ratio was also
similar.
For New Zealand cities, two different metrics were developed. Sydney (26,903) was used as the
comparative for Auckland. Three reasons supported this choice: (1) population density; (2) member
to citizen ratio was similar to Auckland; (3) the difference in the member ratio between Queensland
and Sydney was similar to the New Zealand – Auckland ratio. Auckland’s ratio was calculated at 1 –
20,000 (1 venue per 20,000 citizens). To maintain a consistent approach for the smaller New Zealand
cities, the calculation used Sydney and Christchurch (9192). This resulted in a metric of 1 – 18,000 (1
venue per 18,000 citizens). The impact of this metric on the number of venues required for the
various levels (New Zealand, Auckland, other cities) is shown in Table 4.
The ratios to be used for calculating venue numbers in New Zealand and its individual
cities/towns are:
Auckland City: 1 – 20,000
Other cities: 1 – 18,000
The last ratio in Table 3 (members to citizens) measures the penetration of the sport within the
community. This shows that on average 1 in 100,000 New Zealanders are presently members of
bowls clubs, which is remarkably consistent with the results in Australia (1:104,000), Queensland
(1:104,000) and New South Wales (1:90,000). Scotland is the best performer (1:69,000).
Reviewing the New Zealand cities identifies Christchurch (1:96,000) as the city with the lowest (best)
member to citizen ratio, followed by Wellington (1:113,000) and Auckland (1:143,000). This ratio
may reflect the socio-economic, demographic and cultural differences between these New Zealand
cities. Comparing these results against our comparative countries confirms that using Australia, New
South Wales and Queensland as benchmarks for metric development is supported.
Before continuing, it is worthwhile noting that metrics are arbitrary by nature. Their use can cause
issues if a local context is not included. For example, the number of venues Wellington needs, based
18
Gryphon Management Consultants – Private and Confidential Bowls NZ – Facilities Strategyupon its population and using the developed metric (1:18,000), indicates that Wellington needs 21
venues; it currently has 34 venues. This is a start point and not an arbitrary number.
Developing a rationalisation plan requires further analysis and acknowledgment of local factors e.g.
geographic influences, ability to relinquish leases, the culture of clubs being considered, etc. This
will require that a comprehensive consultative process be undertaken with the clubs concerned. An
implementation plan discussing these and other important components of the engagement
processes are outlined in a separate report to the board.
To demonstrate the disparity between the calculated (using the ratio) number of venues in contrast
to the actual number in existence today, the metrics were applied across New Zealand (Table 4). The
calculations show that Auckland, which currently has 103 venues, may need only 75 venues,
although this takes no account of the possible need to develop further venues for the North Shore
which, given its population increases and other factors, has room for expansion. This recognises that
Auckland, and in particular, North Harbour, are some of the fastest-growing areas in New Zealand
and demonstrates the need for local context.
Table 3 shows that Auckland City (75 venues) is placed between Brisbane (68 venues) and Sydney
(172 venues), which with Auckland’s population base is within a suitable range. These calculations
support the use of this metric as one tool in identifying the appropriate number of venues that
Bowls in NZ needs throughout New Zealand.
The analysis above determined that the defined ratio (population to venue) has credibility when
used to determine the number of venues a specific population is likely to need. Note that this is a
base point from which other considerations (geographic, population density, positioning of current
venues, etc.) would be included into the decision process.
Table 4: Suggested club/venue numbers
Current Suggested
Total Suggested population
City number Number
population per venue = 18-20,000
of clubs of Venues
Auckland 103 75 1,507,700 20,000
Hamilton 36 23 416,000 18,000
Wellington 34 21 393,000 18,000
Christchurch 43 21 367,700 18,000
Dunedin 25 7 126,000 18,000
New Zealand 583 418 4,433,100 10,600
19
Gryphon Management Consultants – Private and Confidential Bowls NZ – Facilities StrategyWhile the population to venue ratio enables the determination of a base point (numbers of venues),
it is membership numbers and their ability to support and pay for venue running costs that
determines if the venue is sustainable. Members are the key ingredient in making venues vibrant
and sustainable, while pay-for-play participants add flavour and provide additional income.
However, the focus on membership should not inhibit venues from moving towards a fully pay-for-
play model if the demographics and research support such an approach. The following section
discusses how financial measures can be used in analysing venue health, and the numbers of venues
needed for an area.
Financial measures
This section starts with justification for using financial measures in a not-for-profit environment
before analysing the financial results from a sample of venues. After that, the analysis moves to the
actual costs of running a venue and the average membership needed to support this, assuming each
member pays the average subscription.7
The use of the average subscription fee as the measure of what each member pays accounts for the
difference in membership types and fees by the wide range of membership types currently catered
for in clubs.
A financial analysis involving a sample of clubs was conducted to determine an average financial
result for operating expenses and revenue for clubs and how these compared against a range of
financial measures. In total, 66 clubs’ financial results were utilised to conduct this analysis. The
clubs were randomly selected from throughout New Zealand to ensure that there were a mixture of
cities and country clubs, along with large and small clubs.
Practical justification
The financial performance and sustainability of clubs is important to the sport of bowls. A key
outcome of the One Bowls: One Vision strategy developed by Bowls NZ and adopted by the service
centres, centres and clubs was the goal of developing strong sustainable clubs. For this strategy,
“strong sustainable clubs” have been defined as:
“Clubs that pay operating expenses as they become due and whose financial solvency is not totally
dependent on grants funding, furthermore, they fulfil the definition of a strong sustainable club as
described in the Partner Clubs programme of Bowls NZ”
While some may suggest that using financial measures in respect of clubs (incorporated societies) is
not appropriate, it is important to remember that even though clubs are often described as “not for
profit”, the reality is that clubs must make an operating surplus to survive. This makes the
application of the measures from practical perspective applicable in this instance.
7
Identified at $150 including all capitation fees by Bowls NZ and $135 from the survey data
20
Gryphon Management Consultants – Private and Confidential Bowls NZ – Facilities StrategySection 4: Data analysis
The financial analysis identified two interesting aspects:
(1) It is clear from the site visits completed and the financial results reviewed that a number of clubs
run gambling machines as cost centres within their clubs and that this is a major source of funding
for their operations. It is also obvious that this component of club income is far more prevalent in
the North than in the South Island clubs visited.
(2) The bars associated with clubs can generate significant income, although this is dependent on
how the club decides to operate those bars.
What follows is a brief description of the measures used and what they mean. They are coded (A, B,
C, etc.) in Tables 5 & 6 to make identification easier.
Measure A) This measure indicates the club's ability to live within its means. A
percentage greater than 100 indicates that the club is living within its means
(revenue exceeds expenses).
1. Clubs should plan to achieve a minimum 10% of total revenue as a
surplus before depreciation.
2. All clubs should aim to have reserves equivalent to a minimum six
months of expense expenditure.
Measure B) This measures the return on revenue (ROR) as a percentage, e.g. the excess
income over expenses.
Measure C) This measures the return on assets (ROA). This should be seen as an
indicator only. However, it is important that the assets deployed are
maximised. This measure is an indicator of this.
The measures contained within the index of public support use the funding obtained from grants or
other charitable funding sources as the basis for measuring the club’s financial sustainability and the
impact on the club if these sources were to cease being available. The individual measures are
significant for clubs because:
Measure D) This measures the percentage of total revenue that is reliant on charitable
funding. A benchmark of 20 percent has been used to indicate that clubs
over this percentage are at significant risk if funding ceased.
Measure E) This measures the level of reliance on external charitable funding a club has
in paying its normal operating expenses. A benchmark of 10 percent has
been used to indicate that clubs over this percentage are at risk of not being
able to pay their daily operating expenses if funding ceased.
21
Gryphon Management Consultants – Private and Confidential Bowls NZ – Facilities Strategy1. Clubs should endeavour to have a maximum 30% of expenses reliant
on contributions (trusts, etc.).
The rationale for setting the percentage of revenue obtained from charitable funds at 20 percent is
based upon the expectation that clubs will achieve a surplus in operating profit before depreciation.
This surplus should be in the 5 to 15 percent range, meaning that if all external charitable funding
ceased, the surplus (5 to 15 percent) and other expense reductions would support the outgoings in
the immediate future, until alternative budgets, funding sources/savings were arranged. It is
expected the club would be able to find savings in expenses and or other sources of funding that
would make up the shortfall.
The analysis in Table 5 displays the results of an average club from the sample. When compared with
the percentages described in D & E (above) the results indicate that the average club is reliant on its
contributions to support revenue (D) and expenses (E). The analysis also displays that the average
club is achieving a 3.5% net surplus (A) which is less than the recommended 5% to 15%.
Table 5: Average New Zealand clubs financial results.
Index Public Support Fiscal Performance
Measure D Measure E Measure A Measure B Measure C
Total
Total contributions (Total revenue -
contributions Total revenue
(gifts, grants, and total expenses) / (Total Revenue -
(gifts, grants, and divided by total
other total Total Expenses)/
other expenses (Ability to
contributions) / revenue(Return on Total assets (ROA)
contributions) / live within means)
Total Revenue Revenue)
by total expenses
17.64% 18.27% 103.58% 3.46% 0.49%
A review of the sample was conducted to ensure the numbers were not being influenced by clubs at
either the bottom or top of the scale. The review highlighted that the mix of clubs used in Table 5
included a large number of clubs which earn significant revenue from gaming, rental properties
(some clubs own multiple rental properties producing significant annual income) or bar activities,
which appeared to exceed what the majority of clubs in New Zealand earn. The level of net income
generation from their rental income, bar and gaming operations distorted the results in Table 5.
For this reason, another sample that excluded clubs that receive significant revenue from gaming,
bar or properties rental income was compiled. This resulted in a significantly different picture
emerging regarding the dependence of clubs on grants for their very survival (Table 6).
22
Gryphon Management Consultants – Private and Confidential Bowls NZ – Facilities StrategyTable 6: Refined financial view of an average clubs
Index Public Support Fiscal Performance
Measure D Measure E Measure A Measure B Measure C
Total
Total contributions (Total revenue -
contributions Total revenue
(gifts, grants, and total expenses) / (Total Revenue -
(gifts, grants, and divided by total
other total Total Expenses)/
other expenses (Ability to
contributions) / revenue(Return on Total assets (ROA)
contributions) / live within means)
Total Revenue Revenue)
by total expenses
33.49% 35.16% 104.99% 4.75% 0.94%
The secondary analysis (Table 6) displays the results from 30 clubs, all of which are in the same
geographic area. They do not appear to have the same level of property rental, bar or gaming
income evident in the analysis of clubs presented in Table 5. This analysis presents a significantly
different picture to that in Table 5. It shows that grants account for over 35% (metric is 10% – max
30%) of their expense payments. Total revenue is similarly dependent on grants (33.49%) compared
with the sample in Table 5 (17.64%). Contrasting this, the measures – A (surplus), B (return on
revenue) and C (return on assets) – in Table 6 shows a better result than that in Table 5.
Summary
The analysis highlights the disparity in financial health between the majority of clubs and those who
for various reasons (gambling, rental income) are in a significantly stronger financial state. The
analysis also highlights that, for many clubs, grants provide a significant proportion of their expense
payments (35%). This highlights that for a large percentage of clubs in New Zealand, any reduction in
their ability to access grants will result in financial hardship or demise. Furthermore, the disparity
(Tables 5 & 6) between clubs and regions within New Zealand is highlighted, which confirms that
these financial metrics are good indicators of a club and or region's financial health. Therefore, just
as in the case of the population to a venue metric discussed earlier, financial indicators are another
useful tool for developing a more complete picture of a club’s financial stability.
Membership fees
Understanding the membership fee structure and the ability for clubs to earn income from their
activities is critical. This secure stream of income allows a venue (club partnership) some semblance
of control over their financial future. Understanding and maximising the revenue from their product
(bowls, activities e.g. Mates in Bowls) is critical for the long-term financial stability of venues. To aid
our understanding, a range of questions were included in the electronic survey which was conducted
throughout New Zealand (n=1229). These related to fees (membership, casual, etc.) charged by
clubs and pay-for-play fees e.g. Mates in Bowls.
The club survey was answered by 86 clubs drawn from a wide range of regions. The mix of regions
(Table 7) suggests that the data fairly reflects a range of big and small clubs. The average
membership fee was calculated as being $135.00. The range of membership fees charged ($55 –
23
Gryphon Management Consultants – Private and Confidential Bowls NZ – Facilities StrategyYou can also read