Market Report on Irish Compost Production and Use - cre.ie
←
→
Page content transcription
If your browser does not render page correctly, please read the page content below
Market Report on Irish

Compost Production and Use

                    rx3
              Floor 2 Block 2,
        West Pier Business Campus,
              Dún Laoghaire,
                Co. Dublin.

   Telephone: 1890 RECYCLE 1890 732925
              Email: info@rx3.ie
            Website: www.rx3.ie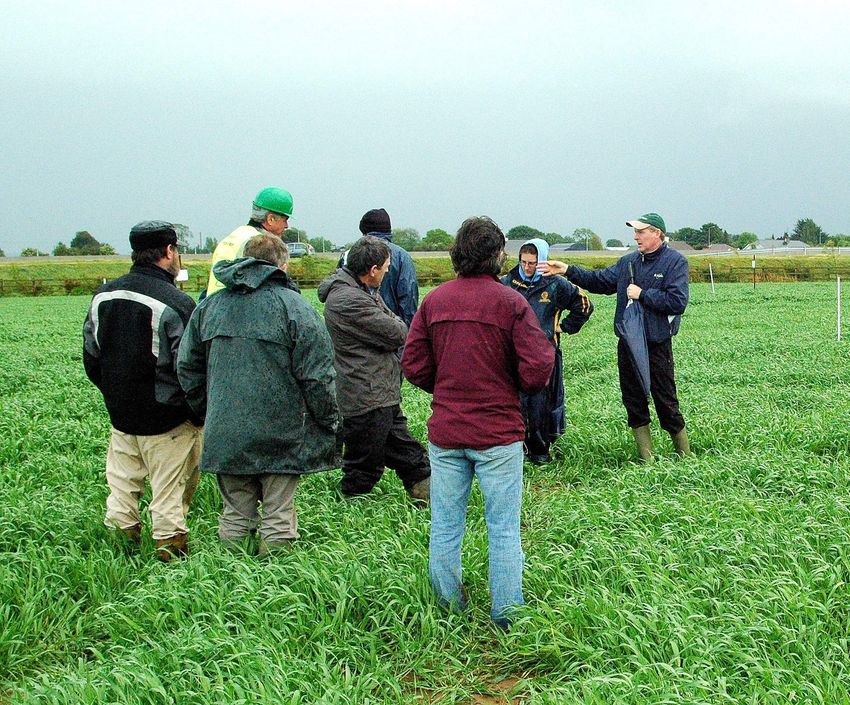
rx3 is funded by the Department of the Environment, Community and Local Government
Market Report on Irish Compost Production and Use

                            © rx3 rethink recycle remake November 2012

All or part of this publication may be reproduced without further permission, provided the source is
acknowledged.

                         Market Report on Irish Compost Production and Use

                                    Author: Conor McGovern, rx3

                                           Published by rx3

Disclaimer

rx3 has taken due care in the preparation of this document to ensure that all facts and analysis
presented are as accurate as possible within the scope of the project. However rx3 makes no
warranty, express or implied, with respect to the use of any information disclosed in this document, or
assumes any liabilities with respect to the use of, or damage resulting in any way from the use of any
information disclosed in this document. While care has been taken in the production of the publication,
no responsibility is accepted by rx3 for any errors or omissions herein.

                                                   i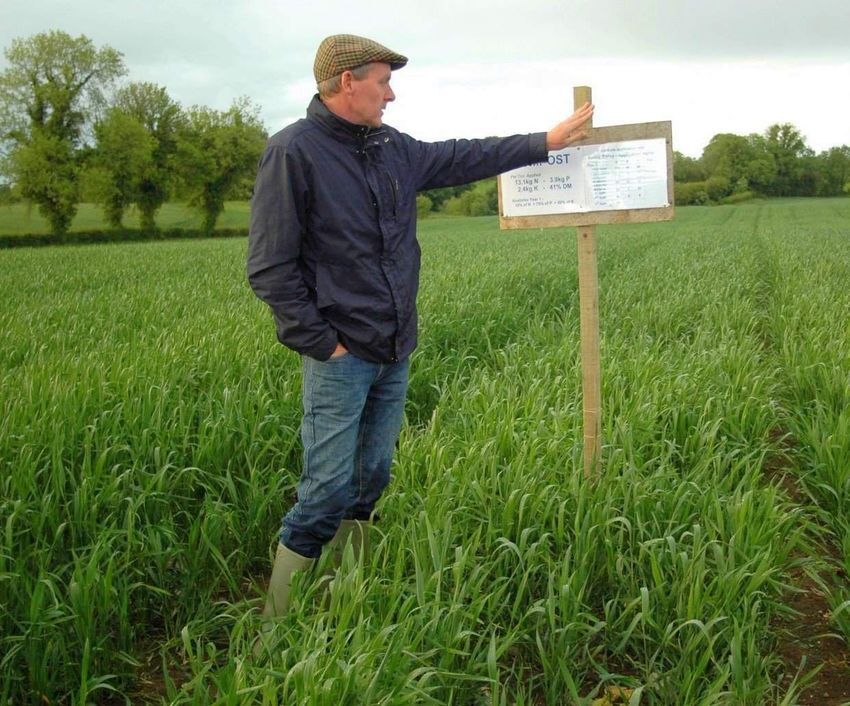
Market Report on Irish Compost Production and Use

This document does not purport to be and should not be considered a legal interpretation of the
legislation referred to herein.

                                               ii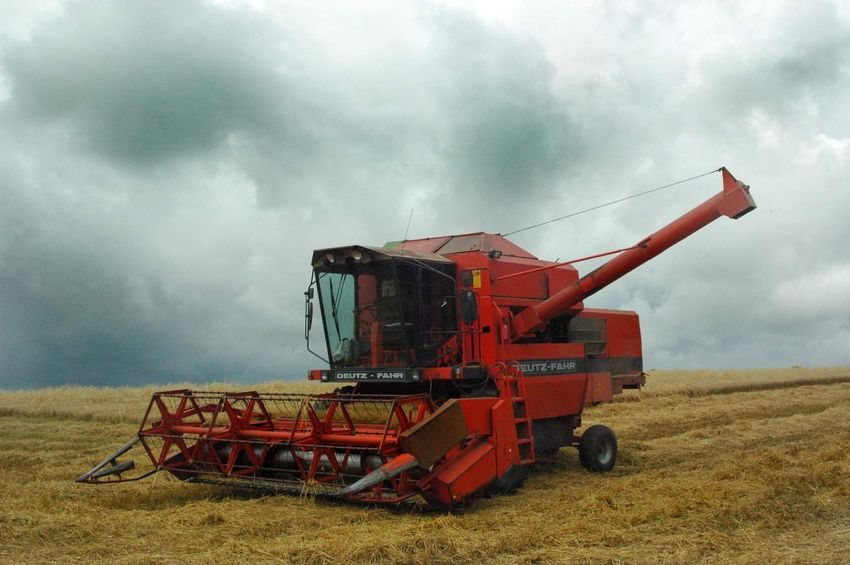
Market Report on Irish Compost Production and Use

EXECUTIVE SUMMARY

This report presents information about the Irish compost production and use sectors.

There are approximately 45 composting facilities operational in Republic of Ireland in May
2012, and approximately 16 composting facilities that are not currently operational. The
operational facilities have an estimated 377,700 tonnes of operational capacity. 28
composting facilities surveyed by EPA processed 269,000 tonnes of residuals in 2010,
producing an estimated 134,600 (50%) tonnes of compost. During 2010, 43,139 tonnes
household organic residuals was collected by local authorities and 20,698 tonnes by the
private sector, with a further 63,837 tonnes collected at civic amenity centres and bring
centres. Gate fees for both food and green residuals achieved at composting facilities are
reported to have been on a downward trend since 2006. Intertrade Ireland (2011) estimated
employment in the composting industry on the Island of Ireland in 2009 at 363 people directly
employed and a further 2,573 indirectly employed, and a processing capacity of 508,560
tonnes.

There are five non-industrial-process anaerobic digestion facilities processing manures and
off-farm feedstocks operational in Republic of Ireland in May 2012. The operational facilities
have an estimated 35,000 tonnes of total operational capacity. Three mushroom compost
production facilities are listed.

Irish organic resource management facilities are listed on an interactive map at
www.rx3.ie/Irish-Composting-Facilities-Map.

Fifteen composting facilities operators in Ireland were surveyed during late 2010 for
information about compost markets, compost sales routes and perceived industry barriers.
The facilities reported market shares as follows; landscaping, 24%; agriculture, 29%,
amateur gardening 18%; horticulture 21%; landfill capping 7%; grounds maintenance 1%.
Over two thirds of compost produced was sold, with 12% distributed at a loss, 5% distributed
free and 16% used onsite. Barriers identified by the composting production sector can be
grouped as being related to poor awareness (about contamination by householders, about
compost properties by potential users, especially farmers and the public) and to regulatory
issues relating to planning and the Animal By-products Regulation.

The report presents data about five Irish sectors that use compost products - agriculture and
organic farming, horticulture, retail, landscaping and forestry and brownfield and
contaminated land. Information for the market sounding was collected by using telephone
interviews.   Stakeholders were identified using trade organisation membership and
government lists and companies own advertising through published literature, internet
searches. The survey of a range of sectors: retail, landscaping & forestry, horticulture,
agriculture and organic farming, and the brownfield and contaminated land sector was
conducted as a series of interviews at appropriate industry events or telephone interviews.

The report presents data about each sector, identifying use of compost in the sector, level of
awareness of compost and other recycled organics, barriers to compost usage, and
quantifies actual and potential compost use in each sector.

Current and potential markets for compost are identified, including specialist sectors like
horticultural clusters which could consume specialist compost products. Mean European
compost sales prices are also identified, which may signal relative or potential Irish prices.

                                               i
Market Report on Irish Compost Production and Use

The report indicates that total compost consumption, currently 190,000 tonnes, could be
increased to over 500,000 tonnes by production increases and consequent appropriate
market development.

TABLE OF CONTENTS

EXECUTIVE SUMMARY.......................................................................................................................... I
1          INTRODUCTION ........................................................................................................................ 1
           1.1        BACKGROUND ................................................................................................................. 1
           1.2        REQUIREMENTS OF THE MARKET DEVELOPMENT PROGRAMME ............................................ 1
           1.3        OBJECTIVE ...................................................................................................................... 2
2          COMPOST PRODUCTION SECTOR ........................................................................................ 3
           2.1        METHODOLOGY ............................................................................................................... 3
           2.2        ABOUT THE PRODUCTION SECTOR .................................................................................... 4
           2.3        RX3 SURVEY OF COMPOST PRODUCERS .......................................................................... 15

3          COMPOST USE SECTORS .................................................................................................... 17
           3.1        BACKGROUND - COMPOST MARKETS IDENTIFIED IN OTHER STUDIES .................................. 17
           3.2        METHODOLOGY ............................................................................................................. 20
           3.3        AGRICULTURE AND ORGANIC FARMING SECTOR ............................................................... 22
           3.4        HORTICULTURE SECTOR................................................................................................. 29
           3.5        RETAIL SECTOR ............................................................................................................. 33
           3.6        LANDSCAPING & FORESTRY SECTOR ............................................................................... 37
           3.7        BROWNFIELD AND CONTAMINATED LAND SECTOR............................................................. 40
           3.8        SUMMARY OF MARKET POTENTIAL FOR COMPOST ............................................................ 44

                                                                          ii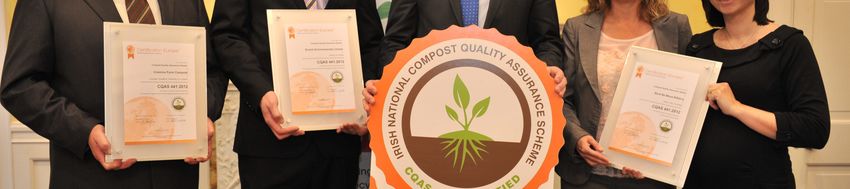
Market Report on Irish Compost Production and Use
LIST OF FIGURES
Figure 1: Built capacity of operational ROI composting facilities 2000-2010 .......................................... 5
Figure 2: Map of organic resource management facilities on the Island of Ireland................................. 8
Figure 3: BMW recovered (EPA National Waste Report series) and non-BMW (est.) ........................... 9
Figure 4: reported organic resource management facility gate fees and landfill levy in Ireland .......... 10
Figure 5: Quality assurance scheme logo ............................................................................................. 13
Figure 6: Certificate presentation to the first composting facilities certified to the Irish compost quality
assurance scheme ................................................................................................................................ 14
Figure 7: Location of composting facilities certified to compost quality assurance scheme ................. 14
Figure 8: Distribution of compost reported, of total produced ............................................................... 15
Figure 9: Reported compost value by survey response........................................................................ 15
Figure 10: Values and size of markets for compost in Europe.............................................................. 17
Figure 11: Classification of Organic Horticultural Products................................................................... 20
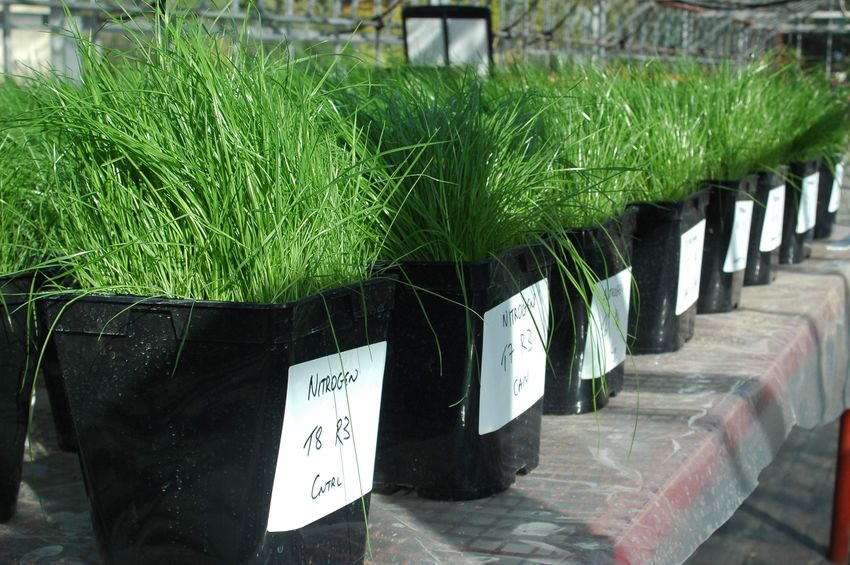
Figure 12: Crop trials were conducted using commercial equipment ................................................... 26
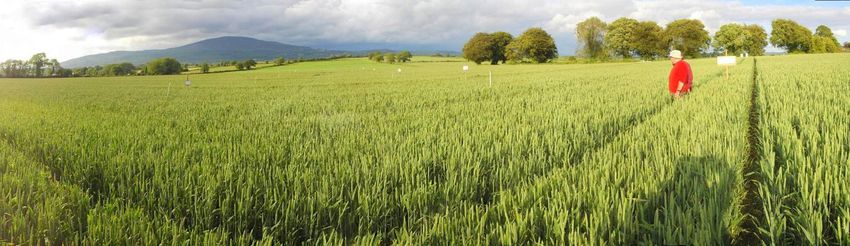
Figure 13: Surveying crop trial plots in Tipperary.................................................................................. 27
Figure 14: Pot-plant growth trials using grass ....................................................................................... 27
Figure 15: information dissemination is a key element of the rx3 programme..................................... 28
Figure 16: Actual & potential compost market size, and mean EU price, €/t ........................................ 44
Figure 17: Graphical depiction of market size, and values ................................................................... 45
iii
Market Report on Irish Compost Production and Use

LIST OF TABLES

Table 1: Details of composting facilities on Island of Ireland .................................................................. 4

Table 2: Mushroom compost production facilities in Ireland in 2012 ...................................................... 5

Table 3: Anaerobic digestion facilities on Island of Ireland ..................................................................... 6

Table 4: Proposed additional biological treatment facilities on Island of Ireland..................................... 7

Table 5: Residuals composted at selected facilities, 2009 and 2010 ..................................................... 9

Table 6: Organic materials available in Ireland as estimated by different bodies ................................. 10

Table 7: Composting / anaerobic digestion facilities approved to process animal by-products............ 11

Table 8: Numbers of facilities seeking approval to process animal by-products (May 2012) ............... 12

Table 9: Market share of compost products manufactured in the UK, 2010......................................... 18

Table 10: Potential annual outlet estimates for BMW-derived compost (2002) .................................... 18

Table 11: Reported markets for compost produced in Ireland - 2006................................................... 19

Table 12: Irish prices reported for compost sold onsite ........................................................................ 19

Table 13: Organic products categorisation............................................................................................ 20

Table 14: Estimate of demand for compost in the agriculture sector, 2012.......................................... 25

Table 15: Horticulture Clusters on Island of Ireland .............................................................................. 32

Table 16: Potential compost use in horticulture sector ......................................................................... 32

Table 17: Potential use of peat diluted compost in Ireland, based on UK usage rates ........................ 36

Table 18: Industrial activities pose a risk to soil and groundwater ........................................................ 40

Table 19: Compost use potential for regeneration and remediation of brownfield sites ...................... 43

Table 20: Actual and potential compost market sizes, issues and estimated unit values .................... 44

                                                                   iv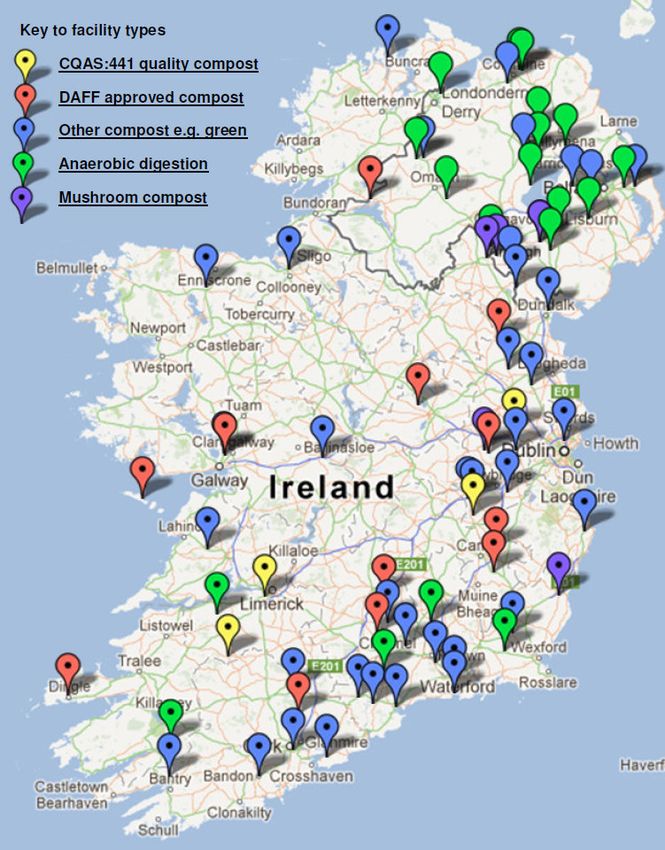
Market Report on Irish Compost Production and Use

                                   APPENDICES

APPENDIX A            Sample Calculation of Financial Value of Compost

APPENDIX B            Questionnaires

APPENDIX C            Percentage Outlets Share of European Compost Market

APPENDIX D            Retail Compost Prices

ABBREVIATIONS USED
AFOR - Association for Organics Recycling
BMW - Biodegradable municipal waste
CSO - Central Statistics Office
ECN - the European Compost Network
GAP - Good Agricultural Practice
MSW - Municipal Solid Waste
NWR - the EPA National Waste Report
REFIT - 'Renewable Energy Feed in Tariff', the primary means through which electricity from
renewable sources is supported in Ireland.
SMC - Spent Mushroom Compost

                                              v
Market Report on Irish Compost Production and Use

1 INTRODUCTION
1.1     Background

Following the adoption of the 1996 Waste Management Act and the publication of “Changing
our Ways”1 in 1998, waste management infrastructure in Ireland has developed significantly.

Ireland, which was a landfill nation with little or no focus on recycling or recovery, now has
strong collection and sorting systems in place. Ireland recycled 166,684 tonnes in 1998 and
1,084,070 tonnes of municipal waste in 2010. Thus, 12 years has seen a significant
improvement in our recycling rates.

One of the challenges currently facing the Irish system is the lack of internal markets for
recyclables. This was identified in the 2002 Government policy statement “Delivering
Change”.2 This statement identified Irelands' lack of stable and economically attractive
markets and outlets for recyclable materials as one of the main barriers to an improved and
sustainable recycling performance. This observation led the Department of Environment,
Heritage, and Local Government (DOEHLG) to establish the Market Development Group
(MDG) in July 2004.

The MDG published the Market Development Programme for Waste Resources: 2007-2011
that laid out a 5 year plan to facilitate the market development of recyclables. The
Programme implementation was officially started in October 2008 and is now implemented
under the name “rx3”.

1.2          Requirements of the market development programme
Project C002 of the Market Development Programme requires delivery of a project described
as follows.

Long Term Objective A market sounding exercise: to identify and engage with
stakeholders; to advertise the objectives and aims of the MDG Programme within the
industry; and to gather baseline information in relation to awareness, technical knowledge,
attitudes and barriers etc. to compost usage in individual sectors in Ireland. This will
supplement the surveys conducted within the ERTDI report “Assessment and Evaluation of
Outlets of Compost Produced from Municipal Waste”, 2002 [“Assessment and Evaluation of
Outlets of Compost Produced from Municipal Waste”] which served to identify composting
infrastructure and some users of compost and other organic amendments.

Stage 1: Survey of the Landscaping and Forestry Sector
All stakeholders within this sector such as compost producers, users (landscape architects,
landscape contractors, garden designers etc.) retailers and industry bodies will be identified
(using the MDG database and other relevant means) and surveyed.

Stage 2: Survey of the Horticulture Sector
All stakeholders within this sector such as compost producers, users (commercial growers,
nurseries, growing media manufacturing companies etc.) retailers, industry and regulatory
bodies will be identified and surveyed.

Stage 3: Survey of the Agricultural and Organic Farming Sector
All stakeholders within this sector such as compost producers, users (IFA, Irish Tillage and
Land Use Society (ITLUS), IOGFA), retailers, industry and regulatory bodies (Teagasc, DOA,
etc.) will be identified (using the MDG database and other relevant means) and surveyed.

1
    Department of the Environment, Community & Local Government, 1998. Changing our Ways
2
    Department of the Environment, Community & Local Government, 2002. Delivering Change
                                                1
Market Report on Irish Compost Production and Use
Stage 4: Survey of Brownfield and Contaminated Land Sector
All stakeholders within this sector such as compost producers, users, remediation
companies, consultants, retailers, industry and regulatory bodies will be identified (using the
MDG database and other relevant means).
For each of these 4 stages, the purpose is to:
o Gain understanding of level of awareness amongst stakeholders in relation to
compost usage
o Determine the actual usage and outlets for compost in this sector
o Gain an understanding of the barriers to compost usage
o Estimate quantities of compost that could be used in this sector if barriers are
overcome
o Add new stakeholder contacts and company information to the MDG Database
Deliverable Report detailing:
o Stakeholders attitudes and knowledge towards compost usage;
o Identification of projects/areas that are suitable for future growing trials;
o Estimates of potential market size and value of compost products.
1.3 Objective
The objective of this study is to generate data about the current state of the market for
organic residuals derived materials and the potential for growth; to identify and engage with
stakeholders; to advertise the objectives and aims of the rx3 Programme within the industry;
and to gather baseline information in relation to awareness, technical knowledge, attitudes
and barriers etc. about compost usage in individual sectors in Ireland. This will update the
surveys conducted within the report “Assessment and Evaluation of Outlets of Compost
Produced from Municipal Waste”, 2002, which served to identify composting infrastructure
and some users of compost and other organic amendments.
Additions to the outline project identified in the Market Development Programme are
necessary. The retail sector has a direct influence on compost market penetration. For that
reason, a survey of the retail sector was also conducted.
2Market Report on Irish Compost Production and Use
2 COMPOST PRODUCTION SECTOR
The primary objective of this report is to generate data about the state of the market for
organic residuals derived materials and the potential for growth. However, to provide a
complete picture, an additional review of the compost production sector was required.
This chapter presents data about the compost production sector in Ireland, primarily using
published data, but also using data gathered about the sector from direct contacts with
compost producers.
2.1 Methodology
The data collection included primary data collection using telephone surveys to complete
questionnaires in Appendix B. Fifteen large composting facilities responded.
The questions for composting facility operators were structured into sections as follows:
o Section A - Contact details
o Section B - Composting site operations
o Section C - Products, markets and use
o Section D - Other comments
The authors completed these elements with known data where available. Secondary data
collection consisted of reviewing publicly available information. The information reviewed
included: facility waste licences, EPA National Waste Report Series3, EPA National Waste
Report Factsheet, Facility AERs, industry data and company websites.
Where published data was not available, respondents completed those sections relevant to
them via telephone interview. The questionnaire is quantitative, with questions requiring
either figures or responses to categorised answers (tick boxes). There are few open ended
questions, where clarification or opinions was sought and respondents may add general
comments.
Data collected about composting facilities was compiled as follows;
• Name and county for each composting facility
• Facility waste licence status and facility animal by-products status
• Number of facilities in animal by-products regulatory approvals process
• Main types of materials processed
• Tonnages licensed or processing capacity reported or estimated
• Type of composting technology used
• Product types produced and estimated proportions of each (based on interviews)
• Quality system used (quality assurance scheme or quality standard)
• Published product sale prices
3
www.epa.ie/downloads/pubs/waste/stats/
3Market Report on Irish Compost Production and Use
2.2 About the production sector
2.2.1 Composting facilities
In October 2012, c. 45 composting facilities, estimated capacity of 386,100 tonnes, operate
in the Republic of Ireland. A further 5 facilities are believed to be not operating. 7 composting
facilities are reported in Northern Ireland.
Table 1 lists Island of Ireland composting facilities that are or have been licensed and have
operated in recent years. Capacity is an estimate of developed capacity, based on published
data, otherwise, for facilities operating under waste permit, an estimate of 10,000 tpa is used.
Some facilities in Table 1 are not operational.
4
Table 1: Details of composting facilities on Island of Ireland
Facility name Type Capacity (est.)
Brown bin
Green
Sludge
Other
Acorn (Ballybeg), Tipperary (ABP) IVC 45,000
Athchursail Arann Teoranta (ABP) IVC 500
Barna Waste – Carrowbrowne, Galway IVC 20,000
Bord na Móna Plc, Drehid, Kildare (ABP) IVC 25,000
Bord na Móna Plc, Kilberry, Kildare Windrow 50,000
Celtic Worm Company, Cork Vermi+
Clare County Council, Inagh IVC 2,000
Coolmore Stud, Tipperary Windrow 10,000
Cork County Council, Bandon Windrow 900
Cork City Council, Kinsale Road Windrow 2,500
Crammonds, Wicklow Windrow 1,000
Cremin Farm Compost, Limerick IVC 10,000
CTO Environmental Solutions, Cork Windrow 6,000
De Brun Iasc, Kerry (ABP) IVC 15,000
Dundalk Town Council landfill , Louth Windrow
Enrich, Kilcock, Meath Windrow 10,000
Enrich, Kilcock, Meath (ABP) IVC 10,000
Envirogrind Ltd. , Donegal (ABP) IVC 10,000
Galway City Council, Carrowbrowne (ABP) IVC 9,500
Galway County Council, Ballinasloe IVC 1,000
Green King Composting Ltd, Wicklow IVC 20,000
Johnstown Recycling Ltd., Westmeath (ABP) IVC 2,500
Kerry County Council, N. Kerry Landfill IVC 10,000
Kildangan Stud farm, Kildare Windrow 1,000
Limerick County Council, Mungret Windrow 5,000
M&T Plant Hire, Wexford IVC 10,000
Mayo County Council (Ballina) Windrow 1,000
Marine Harvest, Donegal IVC 900
McGill (Castletownroche) IVC 10,000
McGill (Coom, Glenville) (ABP) IVC 20,800
McGill Molaisin (Cappoquin) IVC 12,000
Milltown Composting Systems Ltd. (ABP) IVC 10,000
O'Toole Composting Ltd. , Carlow (ABP) IVC 15,000
OD Recycling Ltd., Tipperary IVC 10,000
4
See www.rx3.ie/Irish-Composting-Facilities-Map for further detail. Brown bin indicates source
segregated and separately collected domestic catering waste (approved by DAFF to process ABP).
Sludge denotes municipal or industrial sludge stream. Other denotes feedstocks that may include fish,
manure, mixed waste stream etc. or is in a validation process to accept animal by-products.
4Market Report on Irish Compost Production and Use
Facility name Type Capacity (est.)
Brown bin
Green
Sludge
Other
Organic Gold Marketing Ltd, Meath IVC
Ormonde Organics, Waterford IVC 10,000
Panda (Nurendale Ltd), Meath IVC 18,000
Pat Cleary Compost & Shredding Windrow 5,000
Paul and Bronwyn Mooney, Kildare Windrow 2,000
Silliot Hill (food residuals) , Kildare IVC 5,200
Silliot Hill (sludge) , Kildare IVC 11,000
Sligo County Council, Ballisodare Windrow 2,000
Terralift Ireland Ltd. , Monaghan IVC 5,000
Thornton's Kilmainhamwod, Meath (ABP) IVC 20,800
V&W Recycling, Louth Windrow 1,000
Waddock, Carlow (ABP) IVC 7,000
Waterford City Council IVC 10,000
Waterford County Council, Dungarvan IVC 1,000
Waterford County Council, Lismore IVC 500
Waterford County Council, Tramore IVC 1,000
Coleraine Borough Council, Letterloan Windrow 1,000
Greenacre Composting, Antrim IVC
Magherafelt District Council IVC 8,000
Natural World Products, Belfast IVC 60,000
Natural World Products, Keady, Armagh IVC 80,000
Organic Waste Recycling, Newtownards
Simpro Ireland Energy, Tyrone Windrow 8,120
Built composting capacity provision has grown in Republic of Ireland since 2000, figure 1.
400,000
300,000 Capacity
200,000
100,000
0
2000 2001 2002 2003 2004 2005 2006 2007 2008 2009 2010
5
Figure 1: Built capacity of operational ROI composting facilities 2000-2010
2.2.2 Mushroom compost production facilities
Republic of Ireland mushroom compost production facilities had a reported total licensed and
permitted capacity of 111,850 tonnes in 2011. Three facilities operated in Northern Ireland.
Table 2: Mushroom compost production facilities in Ireland in 2012
Facility name License Capacity
(tonnes) Primary feedstock
Kabeyun Ltd-Monaghan Mushrooms W0121-01 15,600 Manure
Carbury Compost Ltd. W0124-01 56,500 Manure
Custom compost W0123-01 39,750 Litter, Manure, Gypsum
Tandragee Compost, Tandragee, Armagh
Cabragh Mushroom Composts, Armagh
Reen Compost, Armagh
5
Throughput calculated using EPA National Waste Report data, and rx3 estimates.
5Market Report on Irish Compost Production and Use
2.2.3 Anaerobic digestion facilities
A number of anaerobic digestion facilities process currently organic materials or are in
development in October 2012. Table 3 lists anaerobic digestion facilities on the Island of
Ireland. Anaerobic digestion facilities, exclusively processing industrial residuals generated
onsite or sewage (e.g. Ringsend or Tullamore WWTPs) do not operate as merchant facilities
for municipal residuals or commercial residuals so are not listed.
6
Table 3: Anaerobic digestion facilities on Island of Ireland
Facility name Capacity
(tonnes) Primary feedstock
Adamstown, Wexford 5,000 Manure, biosolids, biowaste
Beofs, Kilkenny 10,000 Manure
Methanogen, Waterford 10,000 Manure
McDonnell, Limerick 10,000 Dairy and poultry manure
Roughty Valley Co-operative, Co. Kerry Manure
Agri-Food and Biosciences Institute (AFBI) 5,000 Dairy cow slurry, (energy crops)
Ballyrashane Creamery, Coleraine BT52 2NE Dairy waste, crops, slurry
Bethlehem Abbey, not operational Manure & silage
BH Energy, Dundonald, BT16 1TS 12,000 Cow slurry, silage
Coleraine Biogas Facility Poultry & cattle manure
Creagh Concrete, Ardboe, Co. Antrim Grass silage, slurry
Foyle Food Group AD, (in planning and PPC) 15,000 Paunch, treatment plant sludge
Green Farm Energy, Co. Tyrone BT79 Farm-derived feedstock
Greenville Energy, Co. Tyrone. BT78 24,500 Grass silage, slurry
J&P Best, Newry, BT35 6TA
JMW Farms Ltd. Tynan, Co. Armagh. Slurry, energy crops
Lyttle's Biogas, Armagh BT66 7SH Poultry and cattle manure
McGuckian’s Cloughmills, Ballymena BT42 Onsite pig slurry solids
Toomebridge Biogas Facility Manure & silage
Further anaerobic digestion development is expected in Republic of Ireland in response to
improved REFIT7 rebates implemented during 2012 by the Department of Energy. There is a
surge in interest in anaerobic digestion in Northern Ireland, as a result of the ROCs rebate
system. The ROCs system, at current prices currently offers nearly double the REFIT rebate.
6
See www.rx3.ie/Irish-Composting-Facilities-Map for further detail and references. An estimate of
10,000 TPA is used for facilities operating under local authority waste permit, unless actual tonnage is
published elsewhere.
7
REFIT stands for 'Renewable Energy Feed in Tariff' and is the primary means through which
electricity from renewable sources is supported in the Republic of Ireland.
6Market Report on Irish Compost Production and Use
2.2.4 Additional biological treatment facilities proposed
In November 2011, approximately 487,700 tonnes of additional treatment capacity for brown
bin and mixed waste materials was reported to be at some point in planning and/or
development, in Republic of Ireland. The proposals were approximately half each in
composting and anaerobic digestion. Commercial decisions will dictate the actual
implementation or otherwise of these proposals.
8
Table 4: Proposed additional biological treatment facilities on Island of Ireland
Expected Facility Tonnage Type Feedstock
2013 CTO Env. Solution, Middleton, Cork 14,000 IVC G, BB
2012/13 Thorntons, Kilmainhamwood, Meath 19,200 IVC G, BB, MBT
2013 Panda, Slane, Co. Meath 20,000 AD G, BB, MBT
2012 Bord Na Mona, Drehid Co. Kildare 25,000 IVC G, BB
2013 Greenport Environmental, Foynes. 50,000 AD G, BB, MBT
2013 Organic Gold, Co. Meath 25,000 IVC G, BB
2014 CTO Greenclean, Milltown, Cashel 14,500 IVC G, BB, MBT
2014 Clean Ireland Recycling, Co. Clare 15,000 IVC G, BB, MBT
2015 Stream Bioenergy, Dublin 90,000 AD BB, MBT
2015 Joe Barry, Summerhill 20,000 AD BB, MBT
2015 Bord Na Mona, Drehid Co. Kildare 90,000 IVC MBT
2015 Greenstar, Ballycoolin, Dublin 50,000 IVC G, BB, MBT
2016 Greenstar, Sarsfield Court, Cork 45,000 AD BB, MBT
2016 Greenstar, Deepwater Quay, Sligo 10,000 IVC G, BB, MBT
8
Emerging Waste Recovery Infrastructure, the Irish Waste Management Association, Nov 2011.
See also www.rx3.ie/Irish-Composting-Facilities-Map for further detail, if available.
G=green waste, BB=brown bin MBT=Mixed waste. Expected = expected online dates reported at
November 2011.
7Market Report on Irish Compost Production and Use
2.2.5 Map of Irish organic residuals management facilities
Figure 2 shows composting, anaerobic digestion and mushroom compost production facilities
on the Island of Ireland.
An interactive version of this map, with further detail and references is available at
www.rx3.ie/Irish-Composting-Facilities-Map.
Figure 2: Map of organic resource management facilities on the Island of Ireland
8Market Report on Irish Compost Production and Use
2.2.6 Quantifying materials treated, volumes and types
The 28 facilities surveyed for EPA NWR 2010, recycled 269,200 tonnes organic residuals
(defined by EWC code), while the 30 facilities surveyed for EPA NWR 2009, recycled
301,793 tonnes organic residuals. Breakdown by material is shown in Table 5.
Table 5: Residuals composted at selected facilities, 2009 and 2010
Type EWC EWC description of waste production source 2009 2010
02 01 Agriculture, horticulture, aquaculture, forestry, and fishing 65,729 52,196
02 02 Preparation & processing of meat, fish & foods of animal origin 6,037 7,031
02 03 Fruit, vegetables, cereal etc. Preparation and processing 5,282 1,502
02 05 Dairy products industry 9,851 12,600
02 06 Baking and confectionery industry 482 232
Industrial, Agricultural
02 07 Production of alcoholic and non-alcoholic beverages … 26,124 23,680
03 01 Wood processing and the production of panels and furniture 65 943
03 03 Pulp, paper and cardboard production and processing 1,932 1,896
04 02 Textile industry 52 149
07 01 MFSU basic organic chemicals 1,107 852
07 05 MFSU of pharmaceuticals 3,916 3,582
07 06 MFSU of fats, grease, soap, detergent, disinfectant & cosmetic 616 520
10 01 Fly ash from peat and untreated wood 25
C&D 17 08 Gypsum-based construction material 4,815 140
19 05 Aerobic treatment of solid wastes 382
19 08 Waste water treatment plants not otherwise specified 53,814 56,853
Municipal Sludges
19 09 Preparation of water for human consumption or for industrial use 2,900 322
19 12 Mechanical treatment of waste 34,144 1,647
15 01 Packaging (& separately collected municipal packaging wastes) 1,882 11
20 01 Municipal wastes (separately collected fractions) except 15 01 48,373 73,695
20 02 Garden and parks wastes (including cemetery waste) 32,508 30,238
20 03 Other municipal wastes 1,758 1,112
TOTAL 301,793 269,200
In 2010 43,139 tonnes household organic residuals was collected by local authorities, 20,698
tonnes by private sector, and 63,837 tonnes at civic amenity centres and bring centres.
BMW (biodegradable municipal waste) recovery reported by EPA National Waste Reports
indicate a 4-fold increase since 2001 - see figure 3. Non-BMW streams, reported by EPA and
estimated by rx3, also show significant increases.
300,000
250,000
200,000 Non-BMW
150,000 BMW
100,000
50,000
0
2001 2002 2003 2004 2005 2006 2007 2008 2009 2010
Figure 3: BMW recovered (EPA National Waste Report series) and non-BMW (est.)
9Market Report on Irish Compost Production and Use
2.2.7 Organic materials available to collect or treat in Ireland
Estimates of organic materials available in tonnes per annum are shown in Table 6.
Table 6: Organic materials available in Ireland as estimated by different bodies
9 10
Materials “type” Intertrade Ireland (2011) Cré (2010)
Industrial 597,816
Commercial 331,691
Municipal 654,000 Food 358,267
Green 284,494
Totals 1,583,507 518,369 to 642,761
2.2.8 Gate fees charged for composting
Figure 4 depicts the average gate fee reported by organic resource management facilities
2005 - 2010. Gate fees vary depending on the facility location and the quantity and quality of
material offered, delivery mechanism etc., so the prices reproduced here are estimated
national averages. Published data is not yet available for anaerobic digestion gate fees. The
landfill levy each year to 2012 is also depicted.
100
80
60 Brown bin
Garden
40
Sewage Sludge
20
Landfill levy
0
2005 2006 2007 2008 2009 2010 2011 2012
11
Figure 4: reported organic resource management facility gate fees and landfill levy in Ireland
Gate fees to 2010 were falling, possibly due to market competition for residuals from landfill.
Increasing landfill levy rates will divert organic resources from landfills, and may lead to
increased gate fees and/or expanded treatment capacity.
2.2.9 Employment in the Irish composting industry
CSO 2009 statistics indicate that employment in the “Materials recovery (NACE 3830)” sector
employed 1,815 people, with turnover of €397 million. The “Waste collection (NACE 3810)”
and “Waste treatment and disposal (NACE 3820)” sectors employed 1,340 and 2,006 and
turned over €397 million and €346 million respectively. No breakdown of these categories is
provided, so employment in organic resource management is unclear.
Intertrade Ireland (2011) estimated employment in the composting industry on the Island of
Ireland in 2009 at 363 people directly employed and a further 2,573 indirectly employed on
an Island of Ireland processing capacity at 508,560 tonnes.
Intertrade Ireland (2011) data suggests that one direct job is created per 1,401 tonnes of
composting capacity provided. The report extrapolates the potential employment in the
9
Intertrade Ireland, 2011: Market Report on Composting and Anaerobic Digestion *(All Island Study)
10
Cré, 2010, Collectable Source Separated Household Food Garden Waste in Ireland
11
Inter Trade Ireland, 2005, 2006, 2009 - Market Report Composting and Anaerobic Digestion Sector;
Forfás Waste Benchmarking Analysis, 2007 and Policy Priorities 2008; RPS survey, 2010, 2012.
10Market Report on Irish Compost Production and Use
sector on the island of Ireland with projected infrastructure development and suggests that
over 1,000 people could be directly employed in the sector.
The Intertrade Ireland job creation estimates reflect the current Irish mix of smaller local and
centralised facilities. Job creation rates reflect the size/type of facility developed. One job is
created for every 800 tonnes of organic residuals processed in the Austrian composting and
anaerobic digestion industry12, while US data13 reports one job created per 2,500 tonnes
processed, and WRAP14 reports one job created per 4,338 tonnes of organic residuals
recycled in 2010.
Significant employment creation is likely in the composting and anaerobic digestion sector
with the capacity expansions projected in response to national Landfill Directive targets.
2.2.10 Animal by-products regulation
The Animal By-products Regulation (EC) No. 1069/2009 and the Animal By-products
Implementing Regulation (EU) No. 142/2011lays down health rules concerning animal by-
products not intended for human consumption. The purpose of the legislation is to safeguard
human and animal health by controlling the use and disposal of animal by-products.
The legislation pertaining to compost plants aims to ensure that all products of animal origin
treated by composting meet the required treatment standards to ensure pathogen reduction
and that recontamination is prevented, so treated material may be safely applied to land.
This regulation is therefore a key requirement for compost production sector facilities treating
animal by-products.
The Department of Agriculture, Food and Fisheries has approved twelve composting facilities
and four anaerobic digestion facilities to process animal by-products by. An estimated
181,000 tonnes of animal by-products composting and anaerobic digestion treatment
capacity is approved to operate. These facilities are listed in Table 7.
Table 7: Composting / anaerobic digestion facilities approved to process animal by-products
15
Name Technology Product types Approval
Athchursail Arann, Galway Composting CATW, OTHER C3 COMP - 19
Ballybeg (Acorn), Tipperary Composting CATW, OTHER C3 COMP - 45
Bord na Móna, Drehid, Kildare Composting CATW COMP - 63
De Brún Iasc Teo, Dingle, Kerry Composting FISH WASTE COMP - 57
Enrich Environmental, Kilcock, Meath Composting CATW COMP - 58
Envirogrind Ltd, Pettigo, Donegal Composting CATW, OTHER C3 COMP - 07
Galway City Council, Galway Composting CATW COMP - 35
Johnstown Recycling, Westmeath. Composting CATW COMP - 36
Kilmainhamwood Compost, Meath Composting CATW, OTHER C3 COMP - 06
McGill Environmental, Glenville, Cork Composting CATW, OTHER C3 COMP - 31
Milltown, Fethard, Tipperary Composting CATW COMP - 15
O’Toole Composting, Fenagh, Carlow Composting CATW COMP - 24
Waddock, Killamaster, Carlow Composting CATW COMP - 16
Ballyshannon, Berridge, Wexford AD BIOGP- 64
BEOFFS, Ballytobin, Callan, Kilkenny AD C2 & C3, MANU & MIMC COMP - 08
Roughty Valley Co-operative, Kerry AD COMP - 77
McDonnell Farms, Limerick AD COMP - 55
12
Intertrade Ireland, 2009, Market Report on Composting and Anaerobic Digestion
13
FoE Europe, 2010, More jobs, less waste
14
WRAP survey of the UK organics recycling industry in 2010. 1,255 jobs, processing 5.45MT
15
Product types per Department of Agriculture, Food and the Marine. CATW = catering waste,
OTHER C3 = other category 3 animal by-products, MANU = manure, MIMC = milk/colostrums
11Market Report on Irish Compost Production and Use
Approval for a composting or anaerobic digestion facility to treat animal by products is a
staged process. A number of facilities were at stage 1 or conditional approval of the
approvals process in May 2012. The numbers at each stage are presented in Table 8.
Table 8: Numbers of facilities seeking approval to process animal by-products (May 2012)
st
Technology 1 Stage Conditional approval/validation Approved Total
Composting 6 5 12 23
Biogas 6 10 3 19
2.2.11 Quality standards in the composting sector
In Ireland, centralised composting and anaerobic digestion facilities apply product quality
standards from the facility waste licence. This standard defines thresholds of certain
parameters including potentially toxic elements, physical contaminants, pathogens and
stability. The standards applied are frequently derived from the European Commission
Working Document on Biological Treatment of Biowaste 2nd Draft.
Some facilities produce compost conforming to specific industry product specifications.
The EPA16 identified three classes of
barrier to use of composts - heavy
metals, pathogens, and phytotoxicity
(salts, organic acids, pesticide
contamination). This report noted that
compost standards in the form of legal
standards (e.g. heavy metals,
pathogens, etc.) and market-driven
standards or specifications can help
overcome product-related barriers to
compost use.
The lack of a national compost product
standard was recognised as a barrier to
compost market development. Therefore
in 2009, at request of rx3, NSAI started
the development of a National Compost
Quality Standard. Irish Standard 441
(IS441) “Quality requirements for
compost manufactured from separately
collected biodegradable materials” was
published in mid-2011.
See www.rx3.ie/National-compost-
quality-standard for details.
16
EPA, 2002, Assessment and Evaluation of
Outlets of Compost Produced from Municipal
Waste Report
12Market Report on Irish Compost Production and Use
2.2.12 Quality assurance in the composting sector
A quality assurance scheme is a market-oriented step that goes beyond the adoption of
National Compost Quality Standards. Market driven quality schemes can impact positively on
collection and treatment of organic residuals and on quality of the end-product itself. This,
and a quality mark/logo/label, instils confidence in consumers as to the quality and contents
of compost products.
Ireland has not had a national compost quality assurance scheme, nor is a pan-European
quality assurance scheme operational, nor are any Republic of Ireland composting facilities
certified to PAS 10017. Some facilities report producing high-quality compost products
according to quality assurance scheme specifications, without being accredited to them. The
WRAP survey of the organics recycling industry 2012 (Table 10) indicates that the
certification to a compost quality assurance scheme (PAS100 +/- CQP) leads to a premium
in selling price.
The lack of a compost quality assurance scheme was recognised as a barrier to compost
market development. The composting industry has indicated that it requires a compost
quality assurance scheme to aid market development.
In response to these issues rx3
appointed contractors Certification
Europe to develop a compost quality
assurance scheme. This project has
developed scheme documentation which
has been followed by a trialling period of
12 months to mid-2012. From mid-2012
there has been a pilot operation phase
of 12 months, when composting facilities
will be certified. The compost quality
assurance scheme logo, figure 5, will be
widely marketed.
Figure 5: Quality assurance scheme logo
Twenty composting facilities have participated in the scheme to date, representing over 67%
(245,500 tonnes) of the total operational capacity of Irish composting facilities.
In October 2012 the first four composting facilities were certified to the scheme. These
facilities are;
• Bord na Móna, Kilberry, County Kildare
• Cremin Farm Compost, Kilmallock, County Limerick
• Enrich, Kilcock, County Meath
• Limerick County Council, Mungret, County Limerick
17
PAS 100 is the British Standards Institution's Publicly Available Specification for
composted material.
13Market Report on Irish Compost Production and Use
Minister for the Environment, Community and Local Government, Phil Hogan, T.D. presented
certificates to representatives of the first composting facilities certified to the Irish compost
quality assurance scheme, figure 6.
Figure 6: Certificate presentation to the first composting facilities certified to the Irish compost
quality assurance scheme
Facilities certified to the compost quality
assurance scheme are mapped on the rx3
website at www.rx3.ie/Development-launch-
national-compost-quality-assurance-scheme
Figure 7: Location of composting facilities
certified to compost quality assurance scheme
See www.cqas.ie for further details of the scheme and updates on certifications.
14Market Report on Irish Compost Production and Use
2.3 rx3 survey of compost producers
2.3.1 Main markets identified
rx3 surveyed selected fifteen Irish composting facility operators during November 2010.
These facilities surveyed represented
50% of the main, active, large
composting facilities. The survey
asked operators about the main
markets for compost sold from the Land scap i ng
G r o und s 24% A g r i cul t ur e
facility. Facility operators were asked mai nt enance 29%
what the main markets, on the basis 1%
of tonnage, were for the compost
Land f i l l
produced by their facilities. cap p i ng and
A mat eur
g ar d eni ng
Responses are depicted in Figure 8. eng i neer i ng
7%
Ho r t i cul t ur e
2 1%
18 %
The survey response indicated that
the most common applications for
compost produced were in the
agricultural, landscaping, horticulture Figure 8: Distribution of compost reported, of
(including peat dilution) and amateur total produced
gardening sectors
Respondents asked about future markets for organics products, suggested that the
agriculture sector offers the most significant growth potential.
These reported market shares are similar to those reported for 2006 by Intertrade Ireland.
A small number of companies are or have been involved in export of compost products,
primarily producing either peat dilution product or low-volume, high-value niche products.
A number of facilities produce product specially designed for use in sports grounds and golf
courses and other high-value niche markets. Some of this material has, in recent years,
found export markets in Dubai, Greece, UK and Germany.
2.3.2 Compost sales routes
The rx3 market survey of composting facilities asked operators if charges were applied to
compost distributed from their facility. Figure 9 outlines the response reported, estimating the
% of compost sold, compost used on site, distributed free and distributed at a cost.
The majority of facilities reported
Used
selling the compost produced.
Distributed
onsite Some facilities reported
free distributing compost produced
16%
5% free of charge to householders
Dsitributed Sold that use the green residuals
at a cost 67% facilities and kerbside collection
12% services. This encourages
feedstock delivery by the public
and an understanding of the
circular nature of the process.
Figure 9: Reported compost value by survey response
Lack of storage space for finished compost, and the dynamics of seasonal pressure on
treatment and storage space can lead to compost distribution at reduced prices or without
15Market Report on Irish Compost Production and Use
charge or even at a cost to the composting facilities due to transactions occurring at less
optimum times.
Some facilities offer agricultural markets a combined compost delivery and land spreading
service as part of their compost distribution arrangement.
Organic residuals and manufactured composts are bulky, so transport and distribution costs
limit the distances over which it is economically feasible to move both feedstock and final
products. Compost products have a relatively low value compared with other recovered
materials and margins for businesses operating in the industry are tight. As a result,
treatment facilities tend to be located close to feedstock supplies, the end-markets tend to be
local, and the products and end users vary by region. Products targeted at sectors such as
horticulture, landscaping and sports turf do offer higher values, which is reflected in
increased regional and national distribution of these products. The presence of horticultural
clusters suggests a market for composting facilities to target.
2.3.3 Barriers to compost market development
Composting facility operators were asked about the barriers to compost market development
identified by compost producers. The main barriers identified by compost producers are as
follows:
Awareness issues
• Contamination of brown bins, especially the domestic brown bin making it difficult to
produce clean quality compost.
• The main market for compost produced in Ireland is in the agricultural industry.
Further awareness of the advantages of using an organic material over a chemical
fertiliser needs to be developed within this sector.
• Farmers need reassurance that organic materials can perform like chemical
fertilisers. This requires development and marketing of a quality assurance scheme.
• Public perception of organic resource materials is important. A number of sites
operate systems where residuals producers drop off green residuals and collect
compost. This creates a closed circle increasing awareness of the benefits of
recovering organic material. This helps improve public perceptions, of food residuals,
garden residuals and sludges as a valuable resource.
Rx3 is addressing awareness issues through measures including its crop trials, which
demonstrate the scientifically verified18 benefits of compost and digestate use. These crop
trials are being conducted in order to raise awareness and help markets to develop.
Regulatory issues
• Respondents noted difficulties in complying with the Animal By-products Regulation
approval process, noting that the process was time-intensive and expensive. The
process was described as “over-regulated”.
• Regulatory processes can be lengthy, inconsistent and expensive to navigate.
• At the time of the survey, respondents felt that the landfill levy needed to be further
increased to divert biowaste from landfill. This has happened and the levy has
increased significantly since (see Figure 4).
18
AAPFCO Soil Amendment / Compost Uniform Product Claims
http://compostingcouncil.org/admin/wp-content/uploads/2010/09/Soil-Amendment-and-
Compost-Product-Claims.pdf
16Market Report on Irish Compost Production and Use
3 COMPOST USE SECTORS
3.1 Background - compost markets identified in other studies
3.1.1 European and UK markets for compost
Looking at the makeup of other markets may help understand where markets for compost
might develop in Ireland. The European Compost Network (ECN)19 described size type and
value of European compost markets as shown in figure 10.
Figure 10: Values and size of markets for compost in Europe
Note: Market volume is indicated as relative size (small (S) to extra-extra-large (XXL)) of the
market segment. Prices are known ranges for compost products within the market segment
(EUR/m³).
Data about compost markets within the EU, including Irish compost markets, contained in an
ECN report (2006) is presented in Appendix C.
Regional differences across Europe mean that conclusions must be carefully considered, as
elements might not apply to Ireland.
In 2008/09, 2.8 million tonnes of compost were commercially produced in the UK. Of this,
35% was sold to end users, 20% was sold to retailers, 23% was used on the site of
production and 20% was distributed free of charge. These proportions have remained
constant from previous years despite recent rapid growth in compost production.
19
ECN, 2008, European Compost Production and Use in EU.
17Market Report on Irish Compost Production and Use
Table 9 identifies the main market shares of compost products from source segregated
feedstock manufactured in the UK, 2010.
20
Table 9: Market share of compost products manufactured in the UK, 2010
Sector Market
share (%)
Agriculture 67
Landscaping 10
Landfill restoration / daily cover 8
Horticulture, professional 5
Horticulture, amateur 5
Other 4.1
Sports turf 0.5
Energy recovery fuel 0.4
There is wide regional variation in markets used by composting facilities in the UK. Nearly
50% of the 100,000 tonnes of compost used in regeneration projects in 2005/06 were used in
London.21 Horticulture accounts for 30% or more of the end markets in Wales and the North
West but very little in other areas. Compost used in agriculture ranges from less than 10% in
Wales to almost 80% in Northern Ireland. This variation reflects not only the regional
prevalence of agriculture but also the availability of animal manure alternatives. Similar
regional variation may be expected in Ireland.
The report “Assessment and Evaluation of Outlets of Compost Produced from Municipal
Waste” published by the EPA in 2002 estimated the potential annual sizes of outlets for
MSW-derived compost shown in Table 10.
Table 10: Potential annual outlet estimates for BMW-derived compost (2002)
Sector Estimated Rationale
potential
outlets (t)
Agriculture 250,000 • MSW-derived compost best used on crop land
Conventional • Based on an estimated 400,500 ha of crop land and assuming
12,500 ha (~3%) of crop land available annually and 20 t/ha
(wet weight) MSW-derived compost applied as is
Agriculture 64,000 • Presently 32,000 ha in production
Organic • Assumes 10% of land in organic production available annually
and applied with 20 t/ha MSW-derived compost (as is)
Horticulture 55,000 • 20% of existing horticultural peat and bark compost usage
• No allowance made for usage on road verges
Forestry 40,000 • Assuming 10% of land in forestry production available annually
and applied with 20 t/ha MSW-derived compost (as is)
Bogland 20,000 • At least 50,000 ha bogland requiring restoration
restoration
Export 18,750 • Assuming 5% of annual 375,000 tpa horticultural peat exported
Contaminated No • Need to refine estimate of hectarage requiring remediation
land remediation estimate • Need to refine targets (i.e. timing) for land remediation
Total 447,750
Compost destination markets in Ireland were most recently reported for 2006 by the ECN
and by Intertrade Ireland, shown in Table 11. Reasons for discrepancies in 2006 reporting
are unclear, but may be related to numbers of facilities surveyed.
20
A survey of the UK organics recycling industry in 2010, WRAP, 2012
21
WRAP (2008) Market Situation Report, Realising the value of organic waste
18Market Report on Irish Compost Production and Use
22
Table 11: Reported markets for compost produced in Ireland - 2006
Compost uses Product 2005 (EPA) 2006 (ECN) 2006 (ITI)
Agricultural land Soil conditioner 55% 37,185 (37%) 26,328 (33%)
Landscaping 6,030 (6%) 12,765 (16%)
Horticulture 3,015 (3%) 11,170 (14%)
Other uses N/a - 3,989 (5%)
Peat dilution Growing Media 16,080 (16%) 16,754 (21%)
23
Landfill cover Soil conditioner 45% 38,190 (38%) 8,776 (11%)
Total 100% 100,500 (100%) 79,783 (100%)
The agriculture, horticulture, landscaping, landfill cover and land reclamation markets
account for 74% of the compost market. Growing media production, primarily listed as peat
dilution above, accounts for 21% of production. Other uses account for 5% of the compost
market.
Data about compost markets within the EU, including Irish compost markets, contained in an
ECN report (2006) is presented in Appendix C.
3.1.2 Prices for compost
Prices reported during the rx3 market survey for bulk compost sold from composting facilities,
are in the €10-40 per m3 range for compost from the facility, bulk un-bagged, and increasing
for bagged materials.
Table 12: Irish prices reported for compost sold onsite
Products on sale Grade € per tonne, € per m3
fresh fresh
Ex-works bulk un-bagged General €5 - 20 €10-40
Blends - 5 to 20 litres bags Blends €90 €180
Facilities selling compost directly are competing with compost retailed from shops and
merchants. For comparison purposes, Irish retail prices for compost blends and some other
materials published on Woodies website on 15 August 2011 were gathered and are
presented in Appendix D. Retail prices range from €70 to €450/ m3. Also presented are UK
prices published by Which Consumer magazine in 2010. See section 3.5 for further details
about the retail sector.
Calculations of the fertiliser value of compost (as opposed to sales price) are presented in
Appendix A. These calculations generate actual values for compost sold to the agricultural
market, though prices actually achieved may not always match. These show fertiliser value
of green/food derived compost as approximately €10/tonne.
3.1.3 About Irish compost product
The 28 composting facilities surveyed by EPA NWR 2010, composted 269,200 tonnes
organic residuals in 2009. If these facilities produced 50%24 compost by weight of input
22
2005 data from EPA NWR factsheet; 2006 ECN data, ORBIT Final Report, "Compost production
and use in the EU", 29 February 2008; 2006 ITI data from Intertrade Ireland report 2011, from 36
facilities surveyed, Island of Ireland data.;
23
EPA National Waste Report (NWR) 2008 reports that 102,092 tonnes of woodchip & stabilised
organics was used for recovery at landfill facilities. Tonnage of woodchip alone is not available.
24
Per figure 3 of WRAP “Survey of the UK organics recycling industry in 2010”
19You can also read