49/2020 The Californian Emissions Trading System and Electricity Market - Influence of market structures and market regulation on the carbon market
←
→
Page content transcription
If your browser does not render page correctly, please read the page content below
CLIMATE CHANGE

   49/2020
 The Californian
 Emissions Trading
 System and Electricity
 Market
 Influence of market structures and market regulation
 on the carbon market
 Case Study Report

German Environment Agency
CLIMATE CHANGE 49/2020

Ressortforschungsplan of the Federal Ministry for the
Enviroment, Nature Conservation and Nuclear Safety

Project No. (FKZ) 3718 42 002 0
Report No. FB000418/ZW,2,ENG

The Californian Emissions Trading System
and Electricity Market
Influence of market structures and market regulation on
the carbon market

Case study report

by
Jan Abrell, Regina Betz, Mirjam Kosch
Center for Energy and Environment, Zurich University of
Applied Sciences (ZHAW), Winterthur

Christopher Kardish
Adelphi, Berlin
Michael Mehling
Center for Energy and Environmental Policy Research,
Massachusetts Institute of Technology, Cambridge

On behalf of the German Environment Agency
Imprint

Publisher
Umweltbundesamt
Wörlitzer Platz 1
06844 Dessau-Roßlau
Tel: +49 340-2103-0
Fax: +49 340-2103-2285
buergerservice@uba.de
Internet: www.umweltbundesamt.de

 /umweltbundesamt.de
 /umweltbundesamt

Report performed by:
Zurich University of Applied Sciences (ZHAW)
Bahnhofplatz 12
8400 Winterthur
Switzerland

adelphi
Alt-Moabit 91
10559 Berlin
Germany

Report completed in:
June 2020

Edited by:
Section V 3.3 Economic Aspects of Emissions Trading, Monitoring, Evaluation
Claudia Gibis

Publication as pdf:
http://www.umweltbundesamt.de/publikationen

ISSN 1862-4804

Dessau-Roßlau, December 2020

The responsibility for the content of this publication lies with the authors.
CLIMATE CHANGE - The Californian Emission Trading System and the Electricity Market

Abstract
This report analyses the influence of the Cap and Trade (CaT) system and the electricity market
in California along two main questions: How do CaT design features affect the environmental
effectiveness of the system and the quality of the carbon price signal? How do electricity market
design features affect the carbon price induced abatement in the power sector? Based on
publicly available data and expert interviews, we derive four main findings on the impact of the
electricity market structure on the quality of the California Carbon Allowances (CCA) price.
First, the capacity mix impacts the role of the CCA price for the electricity sector. Due to the large
share of gas capacities and the very small share of coal plants, carbon reduction in the electricity
sector can only be achieved by decreasing output or investing in carbon-free technologies.
Second, complementary policies affect the marginal abatement cost (MAC) in the electricity
sector and indirectly also the carbon price. Thus, the CCA price only reflects the MAC conditional
on all the complementary policies. Third, the redistribution of large shares of the carbon
revenue to consumers, as so-called California Climate Credits, increases the political acceptance
of the system. Finally, the CaT system should currently not be seen as the major climate policy
instrument in the Californian electricity sector. The broad mix of other policies buffer the carbon
price and make the total costs for the transformation less transparent. Yet, this might change in
the future when reduction targets become more stringent.

This case study is part of the project “Influence of market structures and market regulation on the
carbon market” that aims to investigate the interdependencies between carbon and energy
markets in Europe, California, China, South Korea, and Mexico.
Kurzbeschreibung
Dieser Bericht analysiert die Interaktion des Emissionshandelssystems (Cap and Trade, CaT)
und des Strommarktes in Kalifornien entlang zweier Hauptfragen: Wie wirken sich die
Gestaltungsmerkmale des CaT auf die ökologische Wirksamkeit des Systems und die Qualität des
CO2-Preissignals aus? Wie wirken sich die Gestaltungsmerkmale des Strommarktes auf die durch
das CO2-Preissignal induzierte Emissionsreduktion im Stromsektor aus? Basierend auf öffentlich
verfügbaren Daten und Experteninterviews, ziehen wir vier wichtige Schlussfolgerungen zu den
Auswirkungen der Strommarktstruktur auf die Qualität des CO2-Preises.
Erstens beeinflusst der Kapazitätsmix die Rolle des CO2-Preises für den Stromsektor. Aufgrund
des großen Anteils der Gaskapazitäten und des sehr geringen Anteils der Kohlekraftwerke kann
die Emissionsreduktion im Stromsektor nur durch eine Verringerung der Produktion oder durch
Investitionen in emissionsneutrale Technologien erreicht werden. Zweitens beeinflussen
zahlreiche begleitende Politiken die Grenzvermeidungskosten im Elektrizitätssektor und
indirekt auch den CO2-Preis. Somit spiegelt der CO2-Preis nur die Grenzvermeidungskosten
unter Berücksichtigung der zusätzlichen Politiken wider. Drittens wird die Akzeptanz des
Systems erhöht durch die sogenannten Kalifornischen Klimakredite, welche einen Großteil der
CO2-Einnahmen an die Konsument*innen zurückerstatten. Viertens sollte das
Emissionshandelssystem derzeit nicht als das wichtigste Klimapolitikinstrument im
kalifornischen Stromsektor angesehen werden. Der breite Mix aus anderen Politiken führt zu
einem tendenziell niedrigen CO2-Preis und macht die Gesamtkosten für die Transformation
weniger transparent. Das könnte sich jedoch in Zukunft ändern, wenn die
Emissionsreduktionsziele ambitionierter werden.
Diese Fallstudie ist Teil des Projekts “Influence of market structures and market regulation on
the carbon market”, welches zum Ziel hat, die Auswirkungen der Marktstrukturen und
Regulierungen auf CO2-Märkte zu identifizieren und die Abhängigkeiten von CO2- und
Energiemärkten in Europa, Kalifornien, China, Südkorea und Mexiko zu untersuchen.
                                                          5
CLIMATE CHANGE - The Californian Emission Trading System and the Electricity Market
Table of content
List of Figures........................................................................................................................................... 8
List of Tables ............................................................................................................................................ 8
List of abbreviations ................................................................................................................................ 9
Summary and conclusions ..................................................................................................................... 10
Zusammenfassung und Schlussfolgerungen ......................................................................................... 13
1 Introduction................................................................................................................................... 16
2 Design and regulation of the ETS .................................................................................................. 18
2.1 Allowance supply .................................................................................................................. 20
2.1.1 Allowance Cap and Long-term Targets ............................................................................. 20
2.1.2 Initial allocation of allowances ......................................................................................... 20
2.1.3 Banking and Borrowing ..................................................................................................... 21
2.1.4 Provisions for additional allowances supply ..................................................................... 21
2.1.5 Market stability mechanisms ............................................................................................ 23
2.1.6 Voluntary cancellation of allowances ............................................................................... 24
2.2 Demand ................................................................................................................................. 24
2.2.1 Coverage ........................................................................................................................... 24
2.2.2 Market participation ......................................................................................................... 25
2.3 Transaction and market oversight rules ............................................................................... 26
2.3.1 Legal nature of allowances ............................................................................................... 26
2.3.2 Fiscal nature of allowances ............................................................................................... 28
2.3.3 Market places.................................................................................................................... 29
2.3.4 Transparency regulation ................................................................................................... 29
3 Assessing the ETS Design and the Quality of the Allowance Price ................................................ 30
3.1 Volatility ................................................................................................................................ 30
3.2 Reflection of MAC ................................................................................................................. 32
3.3 Long-term predictability ....................................................................................................... 32
3.4 Environmental effectiveness of ETS ...................................................................................... 33
4 Introduction to electricity market ................................................................................................. 34
4.1 Market design and structure ................................................................................................ 34
4.1.1 Market Design ................................................................................................................... 34
4.1.2 Market Structure and Dynamics ....................................................................................... 34
4.2 Wholesale market and dispatch ........................................................................................... 39
4.3 (Dis-)Investment and interacting policies ............................................................................. 40
6CLIMATE CHANGE - The Californian Emission Trading System and the Electricity Market
4.3.1 Promotion policies ............................................................................................................ 41
4.3.2 Capacity markets............................................................................................................... 42
4.3.3 Emission Performance Standard (SB 1368) ...................................................................... 42
4.3.4 Once-Through Cooling Phaseout ...................................................................................... 42
4.4 Retail market ......................................................................................................................... 42
5 Assessing electricity markets and the ETS’ impact on abatement ................................................ 44
5.1 Pass-through of carbon cost to wholesale electricity market prices .................................... 44
5.1.1 Observations ..................................................................................................................... 44
5.1.2 Impact of market structure and design ............................................................................ 44
5.2 Fuel switch: Impact of carbon price on dispatch .................................................................. 45
5.2.1 Observations ..................................................................................................................... 45
5.2.2 Impact of market structure and design ............................................................................ 45
5.3 Impact of carbon price on low carbon investment/(dis)investment .................................... 46
5.3.1 Observations ..................................................................................................................... 46
5.3.2 Impact of market structure and design ............................................................................ 46
5.4 Demand reduction and pass-through of carbon cost to end consumer prices .................... 47
5.4.1 Observations ..................................................................................................................... 47
5.4.2 Impact of market structure and design ............................................................................ 48
References ............................................................................................................................................. 49
7CLIMATE CHANGE - The Californian Emission Trading System and the Electricity Market
List of Figures
Figure 1: Price stability mechanisms in the California Cap and Trade Program ..... 24
Figure 2: Verified emissions under the California CaT Program ............................. 25
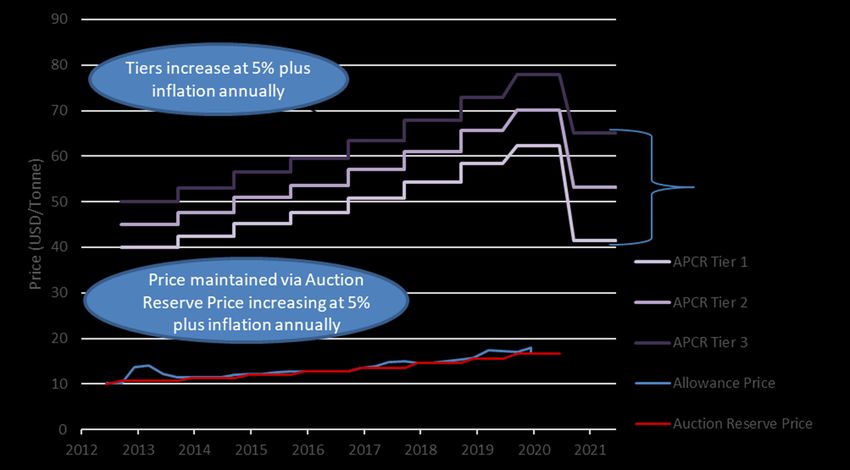
Figure 3: California Carbon Allowances (CCA) Prices .............................................. 30
Figure 4: Installed Capacity ..................................................................................... 35
Figure 5: Installed Capacity by Installation Year (in 2018) ...................................... 35
Figure 6: Retail Market Shares 2018 ....................................................................... 37
Figure 7: Generation mix ......................................................................................... 38
Figure 8: Annual Electricity Net-Imports ................................................................. 39
Figure 9: Timeline California electricity market ...................................................... 40
Figure 10: California’s Integrated Resource Planning Process ................................ 40
Figure 11: Day-ahead electricity and carbon prices ................................................ 44
Figure 11: Retail Electricity Prices ........................................................................... 47
List of Tables
Table 1: Overview supply and demand side design features in the CaT Program .. 19
Table 2: Installed capacity by market actor and technology in 2018 [GW] ............ 36
Table 3: Generation by market actor and technology in 2018 [TWh] .................... 36
8CLIMATE CHANGE - The Californian Emission Trading System and the Electricity Market
List of abbreviations
APCR Allowance Price Containment Reserve
CAISO Californian Independent Transmission System Operator
CARB California Air Resources Board
CaT Cap and Trade
CCA Californian Carbon Allowances
CHP Combined Heat and Power
CO2eq Carbon dioxide equivalent
CPUC California Public Utilities Commission
EPS Emissions Performance Standard
EU ETS European Emission Trading System
GHG Greenhouse gas
ICE Intercontinental Exchange
IOUs Investor-Owned electrical distribution Utilities
IRP Integrated Resource Planning
MAC Marginal Abatement Cost
PG&E Pacific Gas and Electric company
POUs Publicly Owned electrical distribution Utilities
RGGI Regional Greenhouse Gas Initiative
RPS Renewable Portfolio Standard
TWh Terawatt hours (measuring units for energy)
WCI Western Climate Initiative
9CLIMATE CHANGE - The Californian Emission Trading System and the Electricity Market
Summary and conclusions
This report analyses the interaction of California’s Cap and Trade (CaT) system and the
electricity market along two main questions:
► How do CaT design features affect the environmental effectiveness of the system and the
quality of the carbon price signal?
► How do electricity market design features and regulation affect the carbon price induced
abatement in the power sector?
In the following, we first summarize our most important findings and then draw some interim
conclusion on the interaction of the two markets.
Impacts of carbon market design on the quality of the carbon price signal
The environmental effectiveness and the quality of the allowance price signal are most affected
by the emission target, the possibility of using offsets, and the price corridor:
► Volatility: Volatile carbon prices are an indicator that a market is able to react to newly
revealed information. Yet, excessive volatility makes it difficult for market participants to
make abatement and trading decisions. Short-term volatility of the price of Californian
carbon allowances (CCA) is near zero in nearly all phases of the program. The major reason
seems to be the binding price floor, essentially setting the CCA price at the minimum price
level. Another reason might be that due to the consignment of primary allocation (i.e.,
investor-owned utilities (IOUs) are required to consign all freely allocated allowances to
auction), the quarterly auctioned amount of allowances sums up to two third of total
allowances. Consequently, there is little trade on secondary markets as the primary
allocation is close to the efficient allocation. According to Borenstein et al. (2019) prices tend
to be extremely low (near the floor) or extremely high (near the price ceiling) due to the
impact of complementing policies and lack of scalable cost-effective short-term abatement
options. Additional supply sources such as offset credits and linking to the Québec trading
system do not seem to influence volatility.
► Reflection of MAC: In the past, the price for Californian allowances seemed to be mostly
determined by the level and development of the auction reserve price. Experts agree that the
market clearing price was “artificially” kept low by the implementation of many mandated
policy programs. These complementary policies significantly reduce emissions of covered
entities and thus are decreasing the demand and the carbon price (Borenstein et al. 2019).
► Predictability: Because investors have a planning horizon of several years, the long-term
predictability of the price signal is essential to foster low carbon investments. The price
corridor presumably has the largest impact on predictability: By decreasing the range of
possible price realizations, the price corridor leads to a strong increase in the predictability
of the CCA price. CaT’s target for 2030 is clearly regulated to be 40% below 1990. So far,
carbon neutrality for 2045 is announced but still not put to law, leaving a degree of
regulatory uncertainty making it more difficult to forecast price developments after 2030.
The usage of offsets and the linking to Québec make it more difficult to forecast prices as
more influences have to be taken into account. Due to the smaller size of the Québec system,
this impact can be expected to be small.
10CLIMATE CHANGE - The Californian Emission Trading System and the Electricity Market
► Environmental effectiveness: The environmental effectiveness equals the amount of
emissions abated. It is thus mainly affected by design elements that change the emissions
cap. The usage of offsets decreases the (domestic) effectiveness of the CaT, also linking with
the Québec system is very likely to have impacted environmental effectiveness, but to an
unknown, probably small extent. The direction depends on whether California is a net
importer or exporter of emissions, and thus varies over the years. In its current form, the
price corridor does not alter the environmental effectiveness of the system, as unsold
allowances are set aside but not cancelled out of the system. If the hard price ceiling
becomes effective in the future, this could weaken the environmental effectiveness of the
system.
Impact of electricity market structure on the abatement induced by carbon prices
The electricity sector abatement induced by the carbon price depends on market structure and
regulations and is rather limited in California for the following reasons:
► Capacity mix: The existing capacity mix impacts the role of carbon prices for the dispatching
of power plants as well as for investment decisions. California’s rather monolithic
conventional capacity mix relying nearly entirely on gas generation implies a near-zero
short-term abatement potential in the form of coal-to-gas fuel switching. Thus, the impact of
the carbon price on dispatch decisions is rather small.
► Complementary policies: Other policies play a key role determining the importance of
carbon prices for dispatch and investment decisions. Nearly all complementary policies
decrease the role of carbon prices for the electricity sector. Supply side programs giving
support on production basis (renewable and CHP support) incentivize the generation of
certain technologies, and thus investment into these capacities. As a consequence, the role of
carbon prices for dispatch and investment decisions is reduced. Likewise, technology
mandates (emission performance standards and phase-out of once through cooling) direct
investments and divestures towards a less carbon intensive capacity mix. This reduces the
role of carbon prices for investment decisions. As in the longer-run, the capacity mix
becomes less carbon-intense, the role of the CCA price for dispatch is also reduced. On the
consumer side, energy efficiency programs stimulate investments into energy saving
technologies and, thus, reduce the role of the CCA price for these decisions.
► California Climate Credits: Part of the income of freely allocated allowances has to be
transferred to final consumers. Currently, this redistribution of rent is implemented in a per-
household, i.e., lumpsum, manner, and thus does not affect the role of carbon prices.
Impact of electricity market structure on the quality of the carbon price signal
Provided by our observations on the CaT and the electricity market structure, we can derive the
following conclusions regarding the impact of the electricity market structure on the quality of
the CCA price.
First, the capacity mix is unlikely to influence the quality of the carbon price signal. It does,
however, impact the role of the CCA price for the electricity sector. Due to the large share of gas
capacities and the very tiny share of coal plants, carbon reduction in the electricity sector can
only be achieved by decreasing output or investing in carbon-free technologies.
11CLIMATE CHANGE - The Californian Emission Trading System and the Electricity Market
Investments are subject to monitoring through the Integrated Resource Planning (IRP) process
taking place every two years. We observe a strong system of complementary policies designed to
steer the electricity system to fulfill California’s climate targets. These additional policies affect
the MAC in the electricity sector and indirectly also the CCA price. Thus, the CCA price only
reflects the conditional MAC, i.e., the MAC conditional on all the complementary policies.
As shown by Borenstein et al. (2019), the large usage of complementary policies implies that
most of the cheap abatement options are incentivized by these policies leading to a very steep
MAC curve. Together with the imposed CCA price corridor, this leads to a high probability of the
CCA price either being at the price floor or ceiling.
Overall, the CaT system should currently not be seen as the major climate regulation in the
Californian electricity sector. Or, as one of our interview partners stated: “Carbon pricing is the
complementary policy.” The broad mix of other policies buffer the carbon price and make the
total costs for the transformation less transparent. It seems that the role of the CaT is to
ultimately cap emissions and provide a safety net in case other, more targeted policies do not
deliver on emission reductions. In doing so, it also provides a broad allowance price across most
sectors and increases the acceptance of climate policy further by generating revenue which is
partly redistributed back as California Climate Credits and partly used to finance energy
efficiency programs. Nevertheless, most of our interview partners also expressed the
expectation that due to the increasing stringency, it is likely that carbon pricing might become a
driver of the transformation to a low carbon economy in the future.
12CLIMATE CHANGE - The Californian Emission Trading System and the Electricity Market
Zusammenfassung und Schlussfolgerungen
Dieser Bericht analysiert das Zusammenspiel des kalifornischen Cap-and-Trade-Systems (CaT)
und des Strommarktes entlang zweier Hauptfragen:
► Wie wirken sich CaT-Designmerkmale auf die Umweltwirksamkeit des Systems und die
Qualität des CO2-Preissignals aus?
► Wie wirken sich die Gestaltungsmerkmale und die Regulierung des Strommarktes auf die
durch den CO2-Preis induzierte Verringerung des Kohlenstoffausstoßes im Stromsektor aus?
Im Folgenden fassen wir unsere wichtigsten Ergebnisse zusammen.
Auswirkungen der Ausgestaltung des CO2-Marktes auf die Qualität des CO2-Preissignals
Die Umweltwirksamkeit und die Qualität des Preissignals für Zertifikate werden am stärksten
durch das Emissionsziel, die Möglichkeit der Nutzung von Offsets und den Preiskorridor
beeinflusst:
► Volatilität: Volatile CO2-Preise sind ein Indikator dafür, dass ein Markt in der Lage ist, auf
neue Informationen zu reagieren. Eine übermäßige Volatilität macht es den
Marktteilnehmern jedoch schwer, Entscheidungen zu treffen. Die kurzfristige Volatilität des
Preises für kalifornische CO2-Zertifikate (CCA) ist in fast allen Phasen des Programms nahe
Null. Der Hauptgrund scheint die verbindliche Preisuntergrenze zu sein, die den CCA-Preis
im Wesentlichen auf das Mindestpreisniveau festlegt. Ein weiterer Grund könnte darin
liegen, dass aufgrund des „Consignment“ der Erstzuteilung der Zertifikate (d.h.
Energieversorgungsunternehmen im Besitz von Investoren müssen ihre kostenlos
zugeteilten Zertifikate an den Auktionen anbieten) die vierteljährlich versteigerte Menge der
Zertifikate zwei Drittel der gesamten Zertifikate ausmacht. Folglich gibt es wenig Handel auf
den Sekundärmärkten, da die Erstzuteilung der Zertifikate nahe an der effizienten Zuteilung
liegt. Gemäß Borenstein et al. (2019) tendieren die Preise dazu, extrem niedrig (in der Nähe
der Untergrenze) oder extrem hoch (in der Nähe der Preisobergrenze) zu sein, was auf den
Effekt zusätzlicher Politikmaßnahmen sowie den Mangel an skalierbaren, kosteneffizienten
und kurzfristigen Emissionsvermeidungsoptionen zurückzuführen ist. Zusätzliche Quellen
wie internationale Offsets und die Anbindung an das Handelssystem von Québec scheinen
die Volatilität nicht zu beeinflussen.
► Widerspiegelung der Grenzvermeidungskosten: In der Vergangenheit schien der Preis
für kalifornische Zertifikate hauptsächlich durch die Höhe und Entwicklung des
Auktionsreservepreises bestimmt zu werden. Expert*innen sind sich einig, dass der Preis
durch diverse politische Programme "künstlich" niedrig gehalten wurde. Diese zusätzlichen
Politikmaßnahmen reduzieren die Emissionen und senken somit die Nachfrage und den CO2-
Preis (Borenstein et al. 2019).
► Vorhersagbarkeit: Da Investoren einen Planungshorizont von mehreren Jahren haben, ist
die langfristige Vorhersagbarkeit des Preissignals für die Förderung emissionsarmer
Investitionen von entscheidender Bedeutung. Der Preiskorridor hat vermutlich den größten
Einfluss auf die Vorhersagbarkeit: Indem er die Bandbreite möglicher Preise verringert,
verbessert er die Vorhersagbarkeit des CCA-Preises. Das CaT-Ziel für 2030 ist klar geregelt
13CLIMATE CHANGE - The Californian Emission Trading System and the Electricity Market
und liegt 40% unter dem von 1990. Bisher ist die Klimaneutralität für 2045 zwar
angekündigt, aber noch nicht gesetzlich verankert, so dass ein gewisses Maß an
regulatorischer Unsicherheit verbleibt, was eine Prognose der Preisentwicklung nach 2030
erschwert. Die Nutzung von Offsets und die Anbindung an Québec erschweren die
Preisprognose, da zusätzliche Faktoren berücksichtigt werden müssen. Aufgrund der
geringeren Größe des Systems in Québec ist davon auszugehen, dass dieser Einfluss gering
sein wird.
► Umweltwirksamkeit: Die Umweltwirksamkeit entspricht der Menge der vermiedenen
Emissionen. Sie wird hauptsächlich durch Designelemente beeinflusst, die die
Emissionsobergrenze verändern. Die Verwendung von Offsets vermindert die (inländische)
Wirksamkeit des CaT. Auch die Verknüpfung mit dem Emissionshandelssystem in Québec
dürfte die Umweltwirksamkeit sehr wahrscheinlich beeinflusst haben, jedoch in
unbekanntem, wahrscheinlich geringem Maße. Die Richtung hängt davon ab, ob Kalifornien
ein Nettoimporteur oder -exporteur von Emissionen war, und variiert daher im Laufe der
Jahre. In seiner gegenwärtigen Form verändert der Preiskorridor die Umweltwirksamkeit
des Systems nicht, da unverkaufte Zertifikate zurückgestellt, aber nicht aus dem System
gelöscht werden. Wenn künftig die harte Preisobergrenze wirksam werden sollte, könnte
dies die Wirksamkeit des Systems schwächen.
Auswirkungen der Struktur des Strommarktes auf die durch die CO2-Preise induzierte
Emissionsvermeidung
Die durch den CO2-Preis induzierte Emissionsreduktion im Stromsektor hängt von der
Marktstruktur und anderen Regulierungen ab. Sie ist in Kalifornien aus folgenden Gründen eher
begrenzt:
► Kapazitätsmix: Der bestehende Kapazitätsmix wirkt sich auf die Rolle der CO2-Preise
sowohl für den Dispatch von Kraftwerken als auch für Investitionsentscheidungen aus. Der
eher monolithische konventionelle Kapazitätsmix Kaliforniens, der sich fast ausschließlich
auf die Gaserzeugung stützt, impliziert ein kurzfristiges Vermeidungspotenzial (in Form
einer Umstellung von Kohle- auf Gasstromproduktion) von nahezu Null. Daher ist der
Einfluss des CO2-Preises auf Dispatch-Entscheidungen gering.
► Zusätzliche Politiken: Zusätzliche energiepolitische Maßnahmen spielen eine
Schlüsselrolle für den Einfluss der CO2-Preise auf Dispatch- und Investitionsentscheidungen.
Fast alle zusätzlichen Politiken verringern die Rolle der CO2-Preise für den Stromsektor.
Programme auf der Angebotsseite wie die Subventionierung der Produktion (Förderung von
erneuerbaren Energien und Kraft-Wärme-Kopplung) bieten Anreize für die Erzeugung
bestimmter Technologien und damit für Investitionen in diese Kapazitäten. Infolgedessen
wird die Rolle der CO2-Preise für Dispatch- und Investitionsentscheidungen verringert.
Ebenso lenken Technologiestandards Investitionen und Veräußerungen in Richtung eines
weniger emissionsärmeren Kapazitätsmix. Dadurch wird die Rolle der CO2-Preise für
Investitionsentscheidungen verringert. Da der Kapazitätsmix langfristig emissionsärmer
wird, verringert sich auch die Rolle des CCA-Preises für den Dispatch. Auf der
Verbraucherseite stimulieren Energieeffizienzprogramme Investitionen in energiesparende
Technologien und verringern damit die Rolle des CCA-Preises.
14CLIMATE CHANGE - The Californian Emission Trading System and the Electricity Market
► Kalifornische Klimakredite: Ein Teil des Einkommens der kostenlos zugeteilten Zertifikate
muss an die Endverbraucher rückerstattet werden. Gegenwärtig wird diese Umverteilung
der Rente pro Haushalt, d.h. pauschal, durchgeführt und beeinflusst daher die Rolle der CO2-
Preise nicht.
Auswirkungen der Struktur des Strommarktes auf die Qualität des CO2-Preissignals
Aus unseren Beobachtungen des Emissionshandelssystems und des Strommarktdesigns können
wir folgende Schlussfolgerungen zu den Auswirkungen der Struktur des Strommarktes auf die
Qualität des CO2-Preises ableiten.
Erstens ist es unwahrscheinlich, dass der Kapazitätsmix die Qualität des CO2-Preissignals
beeinflusst. Er hat jedoch Einfluss auf die Rolle des CCA-Preises für den Stromsektor. Aufgrund
des großen Anteils der Gaskapazitäten und des sehr geringen Anteils der Kohlekraftwerke kann
die Emissionsreduktion im Stromsektor nur durch eine Verringerung der Stromproduktion oder
durch Investitionen in emissionsneutrale Technologien erreicht werden.
Die Investitionen unterliegen der Überwachung durch den alle zwei Jahre stattfindenden
Prozess der Integrierten Ressourcenplanung (IRP). Wir beobachten zahlreiche begleitende
Politiken, die darauf abzielen, dass Kalifornien seine Klimaziele erreicht. Diese zusätzlichen
Politiken wirken sich auf die Grenzvermeidungskosten im Elektrizitätssektor und indirekt auch
auf den CO2-Preis aus. Somit spiegelt der CO2-Preis nur die Grenzvermeidungskosten unter
Berücksichtigung der zusätzlichen Politiken wider.
Wie Borenstein et al. (2019) zeigen, führen die zusätzlichen Politikmaßnahmen dazu, dass die
meisten der billigen Vermeidungsoptionen durch diese Maßnahmen angereizt werden, was zu
einer steilen Grenzvermeidungskostenkurve für die verbleibenden Emissionen führt. Zusammen
mit dem auferlegten Preiskorridor führt dies zu einer hohen Wahrscheinlichkeit, dass der CO2-
Preis entweder an der Preisunter- oder -obergrenze liegt.
Insgesamt sollte das Emissionshandelssystem derzeit nicht als das wichtigste klimapolitische
Instrument im kalifornischen Stromsektor angesehen werden. Oder, wie einer unserer
Interviewpartner sagte: "Das Emissionshandelssystem ist die ergänzende Politikmaßnahme".
Der breite Mix aus anderen Politiken führt zu einem tendenziell niedrigen CO2-Preis und macht
die Gesamtkosten für die Transformation weniger transparent. Die Rolle des Emissionshandels
scheint letztlich darin zu bestehen, ein Sicherheitsnetz für den Fall zu schaffen, dass andere,
gezieltere Politiken nicht zu genügend Emissionsreduktionen führen. Außerdem gibt es
aufgrund des Emissionshandels einen Zertifikatspreis in den meisten Sektoren und die
Akzeptanz der Klimapolitik wird erhöht, weil Einnahmen als kalifornische Klimagutschriften
zurückverteilt und zur Finanzierung von Energieeffizienzprogrammen verwendet werden.
Nichtsdestotrotz äußerten die meisten unserer Interviewpartner auch die Erwartung, dass es
aufgrund der Verschärfung der Emissionsreduktionsziele wahrscheinlich ist, dass die CO2-
Preisgestaltung in Zukunft zu einer treibenden Kraft bei der Transformation zu einer
emissionsarmen Wirtschaft werden könnte.
15CLIMATE CHANGE - The Californian Emission Trading System and the Electricity Market
1 Introduction
The project “Influence of market structures and market regulation on the carbon market” aims
to identify the impact of market structures and regulations on carbon markets and to investigate
the interdependencies between carbon and energy markets. In a first step, Acworth et al. (2019)
identified major interaction channels based on a literature study. In a second step, case studies1
are used to analyse the mechanisms and interaction channels based on the previously developed
framework. In this report, we present the case study for California, including the Cap and Trade
(CaT) system and the electricity market. The aim of the case study is to analyse the design of the
ETS and electricity market and regulations in order to understand how these affect the carbon
price as well as market interactions in terms of emission reduction. The report addresses the
following two primary questions:
1. How do the CaT design features affect the environmental effectiveness of the system and
the quality of the carbon price signal?
2. How do electricity market design features affect the carbon price induced abatement in
the power sector?
The report is structured in two parts. First, we describe the California CaT, its most important
design features, and the development of traded allowance volumes and allowance prices.
Further, we assess the impact of design features on the effectiveness of the system and the
quality of the allowance price along four dimensions2:
► Environmental effectiveness: equivalent to the amount of emissions abated.
► Reflection of marginal abatement cost (MAC): Examining the MAC enables to examine
whether the price signal is distorted.
► Long-term price predictability: Because investors have a planning horizon of several years,
the long-term predictability of the price signal is essential to foster low carbon investments.
► Price volatility: Volatile carbon prices are an indicator that a market is able to react to newly
revealed information, e.g., changes in production cost. Yet, excessive volatility makes it
difficult for market participants to make abatement and trading decisions.
Second, we describe the electricity market in terms of design, supply, and demand. We then
assess the interaction of carbon and electricity markets, focusing on the impact of carbon prices
on electricity generation, demand, and consequently abatement. We assess this impact along the
three main abatement channels:
► Fuel switch: Short-term abatement through change in dispatch.
► Low carbon investment/divestment: Long-term abatement through investment in low
carbon technologies or divestment from fossil technologies.
► Demand reduction: Short to long-run abatement due to demand reduction induced by higher
electricity prices for consumers in wholesale and retail markets.
1 In addition to California, case studies for China, European Union, Korea and Mexico are conducted.
2 See Acworth et al. (2019) for an overview of these dimensions.
16CLIMATE CHANGE - The Californian Emission Trading System and the Electricity Market
All three abatement channels depend on the pass-through of the carbon price signal to bids in
the electricity market, and thus wholesale market prices. We thus also provide evidence on cost
pass-through.
As mentioned above the framework of this report is based on Acworth et al. (2019). For the
analyses, we (i) use literature on carbon and electricity market regulations, research articles,
and secondary literature; (ii) analyse electricity and carbon market data from transmission
system operator CAISO as well as the US Energy Information Agency and (iii) conduct semi-
structured interviews with different stakeholders from companies, regulators, think thanks and
universities in the U.S..
With our analyses we provide descriptive and narrative evidence on the interactions of carbon
and electricity market regulations in California. A thorough quantitative assessment of causal
relations is beyond the scope of this project. Also, it is important to note that the results from
expert interviews provide a range of expert opinions, but cannot be seen as representative.
This report proceeds as follows. Section 2 describes design and regulation of California’s CaT,
Section 3 assesses their impact on environmental effectiveness and the quality of the price
signal, Section 4 introduces the Californian electricity market, Section 5 analyses the impact of
electricity market design on carbon price induced abatement in the power sector. The report
ends with a summary and conclusions.
17CLIMATE CHANGE - The Californian Emission Trading System and the Electricity Market
2 Design and regulation of the ETS
The California Cap-and-Trade (CaT) Program covers about 80% of the state’s greenhouse gas
(GHG) emissions from the power and industry sectors as well as transport and heating fuels
(ICAP, 2020) and is thus the most comprehensive CaT worldwide (World Bank 2019).3 All
covered entities – those responsible for at least 25,000 tons of carbon dioxide (CO2) equivalent
per year – must surrender one allowance or, within a fixed limit, an approved offset credit for
each ton of their verified GHG emissions (CARB, 2019a). Regulated entities must surrender
allowances annually equal to 30% of the previous year’s verified emissions and allowances for
the remaining emissions at the end of every three-year compliance period (ibid).
Launched in 2012, California was the second mandatory carbon market in the U.S. after the
Regional Greenhouse Gas Initiative (RGGI) but the first to cover sectors beyond electricity. The
CaT program was established through Assembly Bill 32 in 2006, which delegated regulatory
authority to the California Air Resources Board (CARB). The passage of Assembly Bill 398 in
2017 extended the program until 2030 and required CARB to implement a regulatory overhaul
that included limits to offsets and changes to allocation provisions and the market stability
mechanisms (Assembly Bill 398).
California has been a member of the Western Climate Initiative (WCI) since 2007 and the CaT is
linked to Québec’s cap-and-trade program since January 2014 (CARB, 2015). The two
jurisdictions hold joint auctions quarterly. California is unique among ETSs in that it requires
some regulated entities (e.g. electrical distribution utilities and natural gas suppliers) to consign
at least a portion of their free allocation to auction and stipulates how they use the proceeds (see
Section 2.1.2 for more details).
Table 1 gives an overview of supply and demand side design features in the California CaT
Program. In the following, we describe the individual design features of the California CaT
Program. In chapter 3, we reflect on the design features’ impact on the environmental
effectiveness of the system and the quality of the allowance price signal along three dimensions:
(1) price volatility, (2) reflection of the marginal abatement cost (MAC), and (3) long-term
predictability.
3The California Air Resources Board (CARB) reports total GHG emissions in 2017 of 424 Mt CO 2eq (CARB,
2019b), from which 363 Mt CO2eq were covered by the CaT.
18CLIMATE CHANGE - The Californian Emission Trading System and the Electricity Market
Table 1: Overview supply and demand side design features in the CaT Program
Feature California CaT Design Comment
Allowance Cap Absolute Absolute cap: 334.2 Mt CO2e (2020)
Average annual reduction factor (compared
to avg. yearly emissions)
- 2015-2017: 3.1%
- 2018-2020: 3.4%
- 2021-2030: 5%
Mid-term 2030 target: adopted 2030: 40% reduction from 1990 levels
Target
2045 target: established 2045 target through Executive Order B-55-18
Long-term by executive order sets target of GHG neutrality
Target
Primary Consignment auctions, Investor-owned electric utilities required to
Allocation (in free allocation, and consign all freely allocated allowances to
electricity auctioning auction; publicly owned electric utilities and
sector) electric cooperatives receive free allocation
that they can hold for compliance or consign
to auction
Banking Allowed Within & across periods but subject to a
holding limit
Borrowing Not allowed Future allowance vintages can be purchased
at auction but not used for compliance until
their year of validity
Market Stability Price bounds Minimum price (Auction Reserve Price) that
Mechanism increases every year; Allowance Price
Containment Reserve that supplies
allowances when prices reach specific points;
additional price ceiling starting 2021
Voluntary Allowed
Cancellation
Coverage ~80% of state GHG Mostly CO2 but also CH4, N2O, SF6, HFCs, PFCs,
emissions (2020) NF3, and other fluorinated GHGs.
Market Open system
participation
19CLIMATE CHANGE - The Californian Emission Trading System and the Electricity Market
2.1 Allowance supply
This section describes the supply side features of California’s CaT Program.
2.1.1 Allowance Cap and Long-term Targets
The California CaT Program has an absolute allowance cap aligned to the 2030 reduction target
of 40% below 1990 levels. By 2031, the cap will stand at 193.8 Mt CO2eq. To reach that target
the allowance budget declines annually by 12 Mt (3.4% of average yearly emissions) from 2018
to 2020 and by 13.4 Mt (5% of average yearly emissions) from 2021 to 2030 (ICAP, 2020). No
targets have been established in law after 2030, but under current CARB CaT regulations
allowance budgets between 2032 and 2050 are set to decline by 6.7 Mt per year from the 2031
cap of 193.8 Mt CO2e (CARB, 2019a). As the absolute yearly emission reduction remains constant
from 2032 to 2050 while the emissions decrease, the annual decline rate (compared to the
previous years’ emissions) steadily increases, reaching 9.2% by 2050 and a cap of 66.5 Mt. The
current cap trajectory aligns with California’s 2030 target of 40% below 1990s levels, which is
mandated by legislation. California’s 2045 target of carbon neutrality was specified by executive
order, meaning it could be abandoned or modified by any future governor without a legislative
process.
2.1.2 Initial allocation of allowances
California uses a combination of free allocation (about 35%), consignment, and auctioning to
distribute allowances (ICAP 2020). Auctioning accounts for about 65% of allocation, with 40%
available allowances owned by CARB and 25% consigned to auction by utilities (ibid).
Emissions-intensive manufacturers deemed vulnerable to carbon leakage receive free allocation
using output-based benchmarking. Carbon leakage vulnerability is assessed through a
combination of emissions intensity and trade exposure. Those that are deemed to be at risk
receive free allowances based on their recent output, a product-specific benchmark or historic
fuel use as a fallback benchmark, and an industry-specific assistance factor.
Electricity-sector entities receive a combination of free allocation and allowances that must be
returned – or consigned – to the state for sale at auction but with the resulting proceeds
distributed to the original recipients. All proceeds for consigned allowances must be used for the
“primary benefit of ratepayers” e.g. rebates to consumers and emissions mitigation that reduces
the utility’s compliance obligations. The implications of consignment for the electricity sector
are discussed in Section 5.
Allocation to electric utilities amounts to about 25% of California’s overall allowance budget
(CARB, 2019c). Allocation levels until 2020 are determined by a combination of the utility’s
customer cost burden, anticipated energy efficiency, and early action taken to reduce emissions
(CARB, 2010a). Post-2020 allocation is determined based on expected customer cost burdens
from program compliance by forecasting the utility’s supply and demand, assuming compliance
with California’s renewable portfolio standard.
The six investor-owned electrical distribution utilities (IOUs) in California must consign all
freely allocated allowances to auction. They deliver approximately three-quarters of electricity
produced in the state and receive about two-thirds of the sector’s share of allowances (CARB,
2019c) (see Section 4 for electricity market characteristics). From 2013-2017 about 96% of
consignment proceeds was returned to residential, small business, and energy-intensive and
trade exposed consumers, with only 0.4% going towards clean energy investment (ibid). As long
20CLIMATE CHANGE - The Californian Emission Trading System and the Electricity Market
as consignment proceeds are returned based on volumetric tariffs, price pass-through would be
reduced, particularly for residential customers, who received 82% of revenues from 2013-2017.
However, volumetric returns were phased out in 2017, and residential returns are distributed
equally across all ratepayers in a manner designed to maintain incentives to reduce usage or
improve efficiency (CARB, 2018a). The impact of consignment on the price signal for emissions-
intensive industries is likely minimal, as they received only 7% of IOU consignment proceeds
from 2013-2017.
Publicly owned electrical distribution utilities (POUs) and electrical cooperatives may choose
between holding their freely allocated allowances for compliance or consigning them to auction.
The choice is given since they typically own their generating capacity and do not compete with
independent operators (see Fehler! Verweisquelle konnte nicht gefunden werden. for an
overview of capacity owners) to the extent of IOUs (CARB, 2010b). POUs and electrical
cooperatives account for approximately one-quarter of the market. From 2013-2017 POUs and
electrical cooperatives used 66% of their allowances for compliance and consigned the
remainder to auction (CARB, 2019c). Of the 34% of allowances consigned to auction, 13% of
proceeds were used to purchase additional allowances at auction4, 13% for renewable energy
and energy efficiency, and 2% returned to ratepayers (ibid). Because POUs and electrical
cooperatives are able to determine the share of allowances they use for compliance and return a
minimal portion of proceeds to consumers, consignment does not likely significantly impact
price signals. Allowance prices are instead largely determined by the degree to which POUs and
electrical cooperatives pass on the opportunity cost of freely allocated allowances to customers
and the cost of additional allowances purchased at auction.
Auctions are held quarterly. They include allowances owned by CARB, Québec, and the utilities
that receive consigned allowances. Auctions of allowances from the current year and unsold
allowances from previous years are held separately from auctions of future vintages, known as
advance auctions. Consigned allowances are the first to be sold at auction, with consignment
entities receiving the proceeds for each of their designated allowances at the settlement price.
Notices and results are publicly posted by both California and Québec. An auction reserve price
designates a price floor for the year and increases annually. The purchase limit for covered
entities is 25% of the total allowances offered for sale at both current and advance auctions.
2.1.3 Banking and Borrowing
Banking is allowed within and across three-year compliance periods, but regulated entities are
subject to a holding limit that declines annually based on the current year’s cap. Formally,
borrowing is not allowed, but entities can purchase allowances from future vintages at current
settlement prices that cannot be used for compliance until their year of validity. Regulated
entities must surrender allowances annually equal to 30% of the previous year’s verified
emissions and allowances for the remaining emissions at the end of every three-year compliance
period. Thus, there is a form of limited intertemporal-flexibility allowing restricted borrowing
within the three-year period.
4 Effective April 1, 2019, purchasing allowances with consignment proceeds is prohibited (CARB, 2019c)
21CLIMATE CHANGE - The Californian Emission Trading System and the Electricity Market
2.1.4 Provisions for additional allowances supply
Offsets
Offsets are allowed for compliance on a limited basis and only from approved standards, or
protocols, established by CARB. Regulated entities can meet up to 8% of their compliance
obligations with offsets until 2020. Assembly Bill 398 set further limits between 2021 and 2030.
Between 2021-2025 offset usage will decrease to a maximum of 4% of compliance obligations,
increasing to 6% from 2026-2030. In addition, starting 2021 half of offsets used for compliance
must provide “direct environmental benefits” to California. Assembly Bill 398 defines “direct
environmental benefits” broadly as the “reduction or avoidance of emissions of any air pollutant
in the state” or pollutants that “could have an adverse impact on waters of the state”. The
Compliance Offsets Protocol Task Force, whose membership was approved in January 2020, is
charged with providing guidance to CARB on establishing new offset protocols with direct
environmental benefits to the state. CARB has indicated that it will also review projects from
existing protocols for direct environmental benefits (CARB, 2018b).
The six current offset protocols are for US forestry; urban forestry; livestock (e.g. methane
management); ozone-depleting substances; mine methane capture; and rice cultivation. CARB
has approved 149 million offset credits for compliance as of March 2020, which is equivalent to
6.8 % of total allowance budgets from 2015 to 2020. Most of these credits have come from US
forestry projects at 125 million units (84%), followed by ozone-depleting substances at 16
million units (10%). CARB is considering new offset protocols, including wetland restoration
and enhanced management or conservation of agricultural and natural lands.
CARB sets detailed requirements for each project type in its offset protocols. Forestry projects,
for instance, come with permanence requirements that mandate a buffer account as insurance
against reversals of emission reductions due to intentional actions and unintentional causes e.g.
wildfire. Buffer requirements are determined based on project-specific risk ratings. Offsets are
subject to the principle of “buyer liability”, whereby the state can invalidate a credit that is later
found to not meet the requirements of the respective offset protocol. Any facility that used an
invalidated offset for compliance must substitute with a valid offset credit or allowance.
Offsets are sold under bilateral purchase agreements. CARB does not release data on offset price
trends, but in past years they have traded significantly below allowance prices (IETA, 2015).
Before the program was extended to 2030 with Assembly Bill 398, offsets sold about 20% below
allowance prices on average, but the price gap began to narrow after the bill’s passage (Climate
Trust, 2019).
Linking
Allowances from Québec are also allowed for compliance. The two programs have been linked
since 2014 and hold joint quarterly auctions. Québec’s market is significantly smaller, with a cap
of 54.74 Mt CO2eq for 2020 (16% of California’s 2020 cap), but with similar sectoral coverage
and other regulatory elements, including the same price floor at auctions.5 Once linked,
allowance prices in the two markets have converged. However, a key distinction is that Québec’s
electricity emissions are close to zero, and the province does not use consignment allocation for
any covered entities.
5As trades are not reported and allowances are jointly auctioned, i.e., we observe a uniform allowances
price and are not able to conclude in which direction the effect goes.
22CLIMATE CHANGE - The Californian Emission Trading System and the Electricity Market
California and Québec were briefly linked to Ontario in 2018, but the election of a new provincial
government led to Ontario’s withdrawal. California and Québec subsequently suspended trading
with Ontario entities and later cancelled more than 13 million allowances to ensure the
environmental integrity of their programs.
2.1.5 Market stability mechanisms
California has a number of mechanisms to maintain market stability. An Auction Reserve Price
sets a minimum threshold below which bids at auction are not accepted. The Auction Reserve
Price increases each year by 5% plus inflation, standing at USD 16.68 in 2020 (and will continue
to rise annually).
With the exception of several months in 2013 and 2019, settlement prices have rather closely
followed the Auction Reserve Price (see Figure 1).
Unsold allowances from previous auctions are reoffered at current auctions if two consecutive
auctions result in settlement prices above the Auction Reserve Price. The maximum number of
unsold allowances that can be returned is 25 % of the California allowances offered at the
current auction. Any unsold allowances above that amount remain in the Auction Holding
Account. If allowances remain unsold for more than 24 months, they are placed in the Allowance
Price Containment Reserve (Acworth et al. 2020). California has only cancelled allowances in the
case of Ontario’s 2018 departure from the linked market, which was aimed at maintaining the
environmental integrity of the system.
In tandem with a price floor, California operates an Allowance Price Containment Reserve, but it
has never been triggered because prices have generally remained near the price floor since the
CaT program’s launch. The Allowance Price Containment Reserve contains a percentage of
yearly allowance budgets, which are released at three different price points that increase
annually by 5% plus inflation (see Figure 1). Assembly Bill 398 reforms the price points starting
2021. All three points will be lowered to USD 41.40, USD 53.20, and USD 65.00 respectively, with
the last serving as a price ceiling at which covered entities can purchase “price ceiling units” up
to their unmet compliance obligations. CARB is required to finance verifiable emissions
reductions for each unit sold at the price ceiling on a tonne for tonne basis. CARB has stated that
future regulatory amendments will likely be necessary to determine eligibility for emissions
reductions purchased from the proceeds of price ceiling units but that possible sources could be
state-approved offset credits from uncapped sectors (CARB, 2018b). The three price tiers in the
Allowance Price Containment Reserve will continue to increase annually by 5% plus inflation
after they are lowered in 2021.
Prices settling at or near the floor price was highly likely from the outset of the program
owing to a generous cap in view of strong complementary policies such as renewable
portfolio standards, and low price-responsiveness of abatement (Borenstein et al., 2019).
According to Borenstein et al. 2019, complementary policies lead to a steep marginal
abatement cost (MAC) curve because the cheaper abatement measures will be implemented
through complementary policies, i.e., the cheap abatement options will be “cut away” and
thus not incentivized through CaT. The authors show that for low reduction targets (as
observed in the past) little additional abatement is needed, and thus it was very likely that the
California Carbon Allowance (CCA) prices would clear at or near the price floor. When
reduction targets become more stringent (as expected in the future), marginal abatement costs
23You can also read