Electricity Sector Transition in the National Electricity Market of Australia
←
→
Page content transcription
If your browser does not render page correctly, please read the page content below
November 2018

Electricity Sector Transition in the National
              Electricity Market of Australia:
                    Managing Reliability and Security
                           in an Energy-Only Market

OIES Paper: EL 31          Farhad Billimoria, Visiting Reseach Fellow, OIES and
                       Rahmatallah Poudineh, Lead Senior Research Fellow, OIES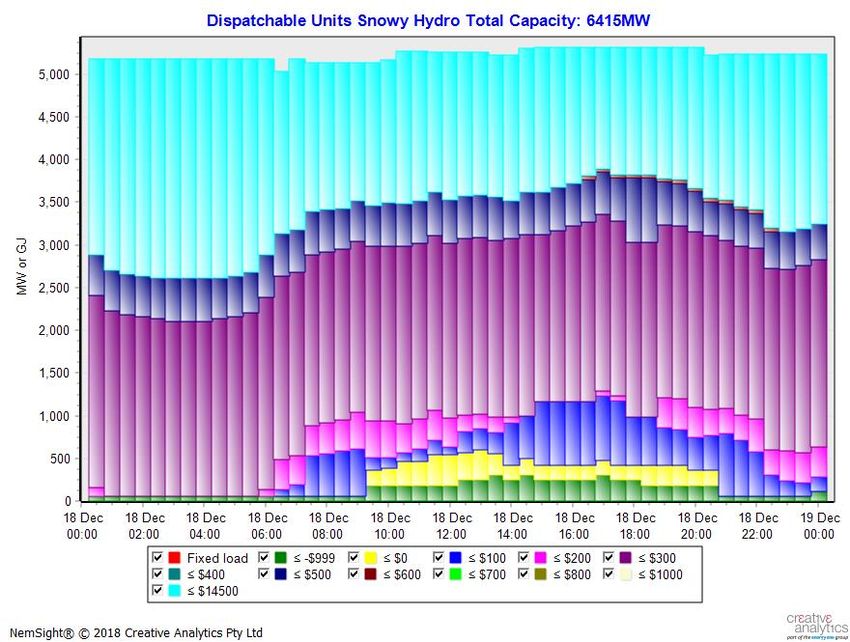
The contents of this paper are the authors’ sole responsibility. They do not
         necessarily represent the views of the Oxford Institute for Energy Studies or any of
                                            its members.

                                          Copyright © 2018
                               Oxford Institute for Energy Studies
                                  (Registered Charity, No. 286084)

  This publication may be reproduced in part for educational or non-profit purposes without special
permission from the copyright holder, provided acknowledgment of the source is made. No use of this
  publication may be made for resale or for any other commercial purpose whatsoever without prior
                  permission in writing from the Oxford Institute for Energy Studies.

                                      ISBN 978-1-78467-122-8

                           DOI: https://doi.org/10.26889/9781784671228

                                                                                                  i
Electricity Sector Transition in the National Electricity
                       Market of Australia:
      Managing Reliability and Security in an Energy-Only
                             Market

                                                   Farhad Billimoria
                 Visiting Research Fellow, Oxford Institute for Energy Studies, Oxford, UK

                                              Rahmatallah Poudineh1
              Lead Senior Research Fellow, Oxford Institute for Energy Studies, Oxford, UK

Abstract
Australia’s National Electricity Market is an important global test case of the impacts of electricity sector
transition in a large-scale liberalized energy-only market. The integration of variable and distributed
energy resources has provided opportunities for clean, low-cost generation, but has also challenged
existing market frameworks and resulted in a debate about the necessity for new designs. The market’s
delayed and insufficient response to disorderly retirement and the need for certain system services
have resulted in government and system operator intervention to bridge the gap. There are difficulties
in securing timely new investment under policy uncertainty and integrated capital models. Furthermore,
contributions to system services that were previously provided as a consequence of energy provision
are not inherently provided by many new-generation technologies. A range of solutions have been
proposed to address these challenges, although none to date have harnessed the potential of
comprehensive alignment between operational requirements and economic signals. For example, the
government’s flagship National Energy Guarantee, while providing a new framework for emissions
intensity and reliability, did not address the ‘missing markets’ in energy security. Measures such as
forward markets may provide hedging options, but are limited to energy. Centralized commitment could
provide operating robustness, but might not be able to provide sufficient transparency of the various
electricity value streams, as the experience of international markets shows. Furthermore, while reliability
has taken centre stage in the policy discourse, system security is as important in managing a large-
scale complex grid with a significant share of asynchronous generation. We argue that an efficient and
transparent real-time energy market must reflect the comprehensive operational requirements of
electricity dispatch. This necessitates an extension of energy-only design to an ‘energy+services’ model
in which efficient price signals are provided for the ‘missing products’ necessary for operational security.
Clear service specifications provide transparent signals that enable clear price discovery and facilitate
competition from new providers and technologies.

1
 This study represents the authors’ own work. Any views expressed are those of the authors and do not represent the views of
any organization or company. Any errors or omissions remain those of the authors.

                                                                                                                           ii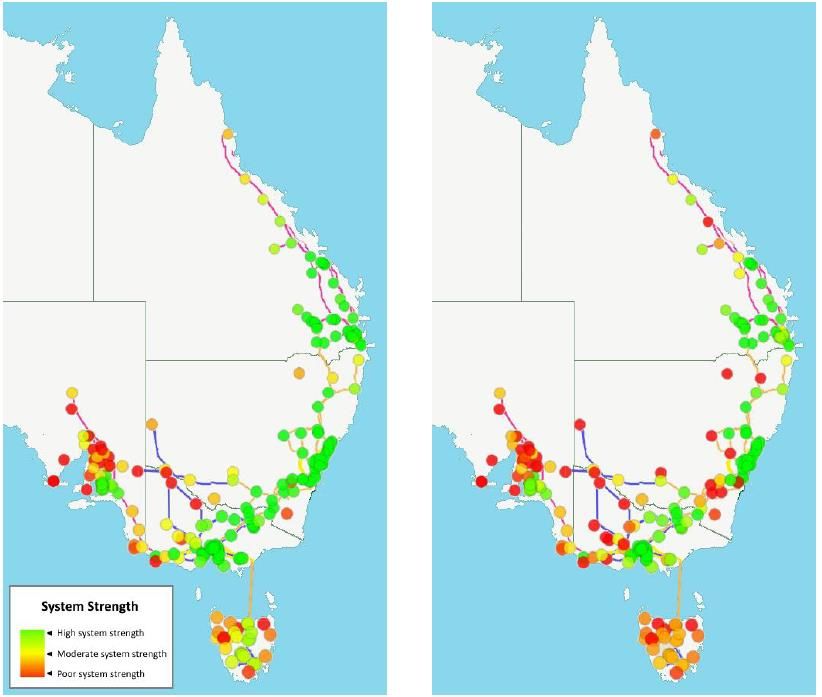
Acknowledgements
We would like to thank David Robinson and Malcolm Keay of Oxford Institute for Energy Studies, Bruce
Mountain of Victoria Energy Policy Centre, Fernando Lasheras from Iberdrola and Tyson Vaughan and
Silvia Piana from Enel Green Power for their robust and detailed comments on the early version of this
paper.

                                                                                                    iii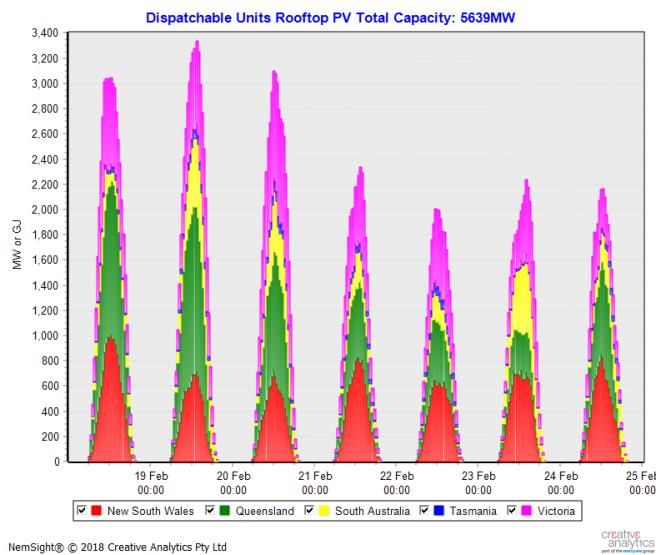
Contents
Abstract .................................................................................................................................................. ii
Acknowledgements ............................................................................................................................. iii
Contents ................................................................................................................................................ iv
Figures ................................................................................................................................................... v
1. Introduction ....................................................................................................................................... 7
2. The changing dynamics of the electricity system ......................................................................... 8
   2.1      The buildout of utility-scale renewables ................................................................................ 10
   2.2      The state of the legacy fleet .................................................................................................. 12
   2.3      The energy crisis ................................................................................................................... 13
   2.4      The regulatory response ....................................................................................................... 14
3. Challenges to the energy-only design under the energy transition .......................................... 15
   3.1      Resource adequacy in uncertain markets ............................................................................. 15
     3.1.1 The reliability value of renewables ....................................................................................... 15
     3.1.2 Disorderly retirement and the sufficiency of dispatchable reserves ..................................... 16
     3.1.3 More renewables = lower average prices but more uncertainty? ......................................... 17
     3.1.4 The economics of new dispatchable investment .................................................................. 18
     3.1.5 Contractual liquidity .............................................................................................................. 19
   3.2      The complexities of system security ..................................................................................... 20
     3.2.1 Near-term concerns for security ........................................................................................... 20
     3.2.3 The value of ‘spin’ in an AC network .................................................................................... 22
     3.2.3 Increasing intervention in the market .................................................................................... 23
     3.2.4 Security frameworks: Securing efficient, timely investment in system security .................... 23
     3.2.5 Future system security considerations ................................................................................. 24
   3.3      Risk and portfolio management challenges .......................................................................... 25
     3.3.1 Managing portfolios in transitioning markets ........................................................................ 25
   3.4      The effectiveness of the scarcity price signal ....................................................................... 26
     3.4.1 Renewable energy policy, contracting, and bidding interactions .......................................... 26
     3.4.2 RET interactions with hydro generation strategies ............................................................... 27
     3.4.3 Scarcity pricing and system security: Missing signals .......................................................... 28
     3.4.4 Government intervention ...................................................................................................... 29
   3.5      Is the market responding? ..................................................................................................... 30
     3.5.1 Optimising and reintroducing existing resources .................................................................. 30
     3.5.2 Five-minute settlement and new investment ........................................................................ 31
     3.5.3 Trialling and enabling new technology ................................................................................. 31
4. The solutions plethora and future pathways for the NEM .......................................................... 33
   4.1 The National Energy Guarantee and strategic reserves ............................................................. 33
   4.2 Enhancements to the energy-only design................................................................................... 34
     4.2.1 Generator notice of closure .................................................................................................. 34
     4.2.2 Forward markets for energy.................................................................................................. 35
     4.2.3 Dynamic reserves ................................................................................................................. 37
     4.2.4 Flexibility markets ................................................................................................................. 37
   4.3 Getting the prices right: Towards an ‘energy+services’ approach .............................................. 38
5. Conclusions ..................................................................................................................................... 39
References: .......................................................................................................................................... 41
Appendix .............................................................................................................................................. 49
   A. An overview of the National Electricity Market ............................................................................. 51
     i. Governance................................................................................................................................. 51
     ii. Regulatory design ...................................................................................................................... 51
     iii. Environmental markets .............................................................................................................. 52
   B. Price formation and bidding in the NEM ....................................................................................... 54

                                                                                                                                                           iv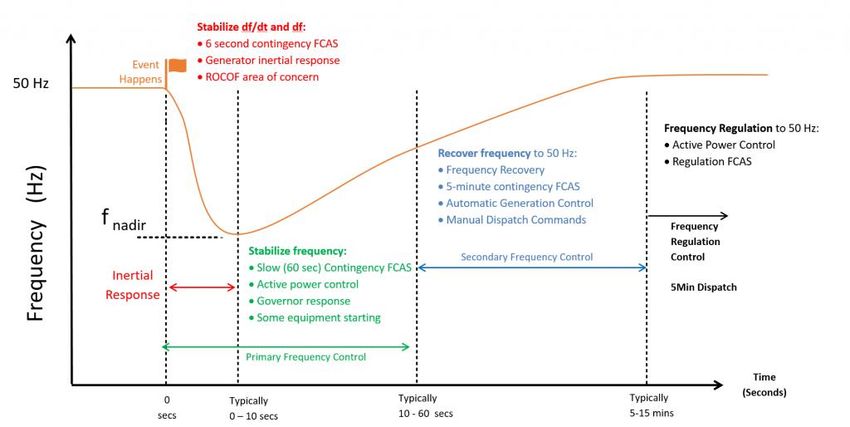
i. Bidding and dispatch ................................................................................................................... 54
     ii. Semi-scheduled generation ....................................................................................................... 55
     iii. Unit commitment in the NEM ..................................................................................................... 55
     iv. Ancillary services....................................................................................................................... 57
   C. NEM frameworks .......................................................................................................................... 57
   D. Market participants and structures ............................................................................................... 59
     i. The rise of the second-tier retailer .............................................................................................. 60
     ii. Market players and their roles in the NEM ................................................................................. 61
   E. Hedging, contracting, and integrated portfolio management in the NEM ..................................... 64
     i. Hedging and risk management approaches ............................................................................... 64
     ii. The integrated portfolio management model ............................................................................. 65
     iii. Traditional hedging of retail load profiles in the NEM................................................................ 66

Figures
Figure 1: Sources of generation in the NEM (excluding rooftop solar PV), 2017 ................................... 8
Figure 2: Cumulative rooftop PV capacity (LHS) and residential rooftop penetration (RHS) in Australia
 ................................................................................................................................................................ 9
Figure 3: Operational demand in South Australia ................................................................................. 10
Figure 4: South Australia minimum operational demand projection ..................................................... 10
Figure 5: Renewables buildout to date and expected future buildout in the NEM ................................ 11
Figure 6: Projections of NEM generation capacity mix ......................................................................... 12
Figure 7: Coal generation fleet operating life (LHS) and gas generation fleet age (RHS) .................. 13
Figure 8: Electricity pricing in the NEM ................................................................................................. 14
Figure 9: Sample variability of rooftop solar PV generation (LHS) and wind generation (RHS) .......... 16
Figure 10: Capacity and reserve margins in the NEM .......................................................................... 17
Figure 11: Renewables penetration and market pricing in South Australia, 2014-17 .......................... 18
Figure 12: Electricity futures curve ........................................................................................................ 19
Figure 13: Economics of new gas-fired capacity .................................................................................. 19
Figure 14: ASX Energy, electricity swap and cap contract volumes .................................................... 20
Figure 15: Mainland frequency deviations ............................................................................................ 21
Figure 16: System inertia in South Australia ......................................................................................... 21
Figure 17: AEMO system strength assessment in 2016-17 (left) and 2035-36 (right) ......................... 22
Figure 18: Directions for system strength purposes in South Australia ................................................ 23
Figure 19: Synchronous condenser sites in South Australia ................................................................ 24
Figure 20: Impact of DER on contracted load and portfolio positions .................................................. 26
Figure 21: Variable renewable supply stack in the NEM, FYTD2018 .................................................. 27
Figure 22: Hydro generation bidding interactions ................................................................................. 28
Figure 23: Incentives to de-commit thermal units ................................................................................. 29
Figure 24: Bidding for the Queensland government-owned generator over summer 2016 and 2017 . 29
Figure 25: Changes in dispatchable capacity operating in the NEM .................................................... 30
Figure 26: Summer availability and availability factors for dispatchable units ...................................... 30
Figure 27: Solar firming product – inverse solar shape ........................................................................ 31
Figure 28: Wind firming product ............................................................................................................ 31
Figure 29: Supply of raise FCAS by fuel type ....................................................................................... 33
Figure 30: Sequence of resource schedule development in the United States .................................... 36
Figure 31: ERCOT Day-Ahead Make-Whole payment ......................................................................... 37
Figure 32: Opportunities for FFR in the NEM ....................................................................................... 38
Figure A1: Large-scale map of the National Electricity Market, including generating stations and
transmission lines .................................................................................................................................. 49
Figure A2: Required services in the market .......................................................................................... 50

                                                                                                                                                                 v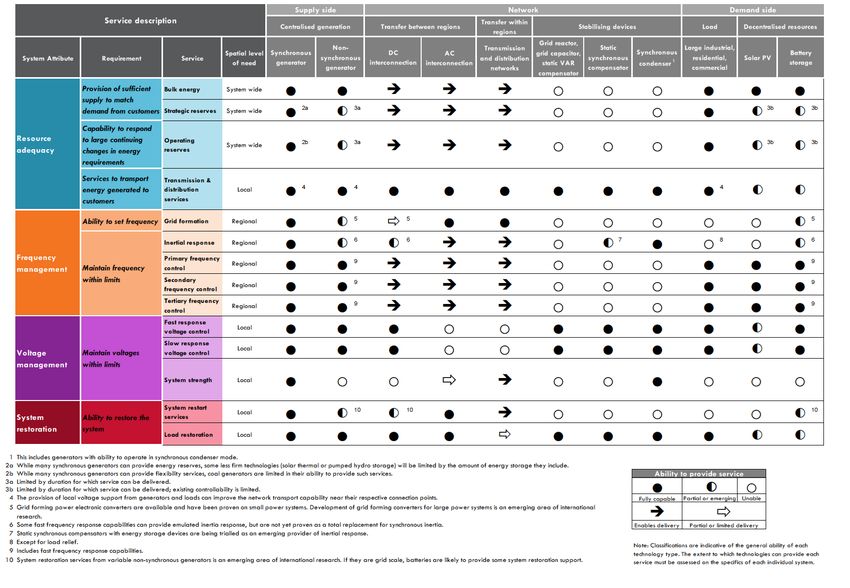
Figure A3: Energy retail contestability .................................................................................................. 52
Figure A4: Large-Scale RET (LHS) and LGC spot price (RHS) .......................................................... 53
Figure B1: Sample supply curve .......................................................................................................... 55
Figure B2: Torrens Island sample bidding structure ............................................................................. 56
Figure B3: Sample – NEM supply stack below AUD 400/MWh ........................................................... 57
Figure C1: Reliability design in the NEM .............................................................................................. 58
Figure C2: Frequency contingency response ....................................................................................... 59
Figure D1: Generation capacity market share (top three players) ........................................................ 60
Figure D2: Retailer market share .......................................................................................................... 61
Figure D3: NEM – Annualized small customer switching activity ......................................................... 61
Figure D4: Sample bid stack for Energy Insurance Provider (EIP)....................................................... 63
Figure E1: Exposure management in the NEM .................................................................................... 65
Figure E2: Hedging in contract markets................................................................................................ 67
Figure E3: Self-hedging model ............................................................................................................. 67

                                                                                                                                            vi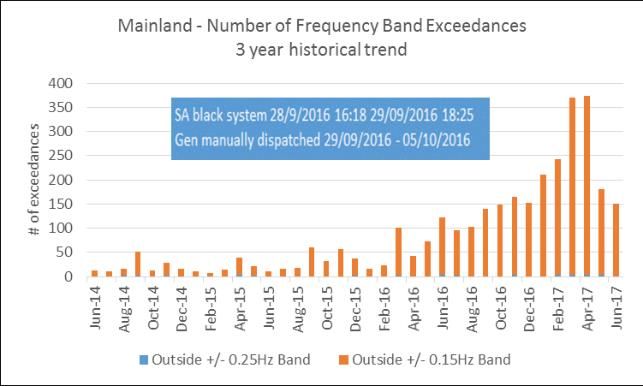
1. Introduction
Australia’s National Electricity Market (NEM) is an important global test case of the impacts of electricity
sector transition in a large-scale liberalized energy-only market. The growth of utility-scale variable
renewable energy (VRE) and distributed energy resources (DER) has changed the operational and
market dynamics of the electricity system in the NEM. South Australia, in particular, has been labelled
the ‘canary in the coalmine’ of electricity market transition, with a high penetration of variable renewable
and distributed generation. Looking ahead, Australia is expected to become one of the most
decentralized electricity markets in the world over the coming decades.
Over the last few years the NEM has faced a number of disruptions, tests, and pressures from an
economic, technical, and socio-political perspective. On a technical level, changes to demand, resource
availability, and dispatch profiles have required a rethink of operational management of the grid. This is
more critical in South Australia, which has only one alternating current (AC) interconnection with the
rest of the NEM. Traditionally, thermal generation provided aspects of system security, such as inertia
and system strength, simply by virtue of their participation in the market. The provision of these services
has declined as thermal units retire and are increasingly pushed out of the merit order stack by low
marginal cost renewables. This has necessitated new operational requirements and increased operator
intervention to ensure system security. Furthermore, increased penetration of low marginal cost
generation has changed pricing dynamics, with subsequent impacts on investment. 2 Variable
renewables have also necessitated new approaches to hedging and risk management. For example,
the notion of baseload generation becomes less relevant as there is less constant load in the system.
Energy and carbon policy are also increasingly political, with high electricity prices and reliability
concerns motivating government intervention. Several attempts to formulate a national carbon policy
have also failed to obtain the requisite political support. The government’s flagship National Energy
Guarantee initiative, after a year of design and consultation, failed to get party approval, and ultimately
set off a series of events that resulted in a national leadership change. These issues have led to
questions about the appropriateness of existing market frameworks to meet the challenges of the
electricity system today and in the future (Finkel et al., 2017). As such, the efficacy of market design at
a wholesale and retail level has been subject to policy concerns and reviews.
However, the current market also provides opportunities. Robust and strategic responses to the
challenges being faced have the potential to lead to new approaches to the management of the
electricity market transition. Regions such as South Australia can act as a test case for the viability of
islanded markets with high renewables penetration. The design of their market and regulatory
frameworks to ensure the provision of system services could offer learnings for international and
regional market design. Furthermore, with current challenges creating commercial opportunities, market
response in the form of innovative technology solutions can be observed, such as energy storage and
demand response. Thus the identification of successful transition pathways for an island market ‘of
scale’ is of importance and relevance not only to Australia, but also to many major markets around the
world.
This paper analyses the challenges that the NEM has been facing as a result of the energy transition
and discusses regulatory responses that have been planned. It also explores the pathways forward for
the NEM.
The paper is structured as follows. Section 2 outlines the transformational changes taking place in the
electricity system, while Section 3 sets out their impacts on the achievement of electricity market

2
 Reliability refers to the ability of generation and transmission capacity to meet consumer demand. Security refers to the ability
of the power system to tolerate disturbances and maintain a stable operating state for electricity supply (Finkel at al., 2017).

                                                                                                                                 7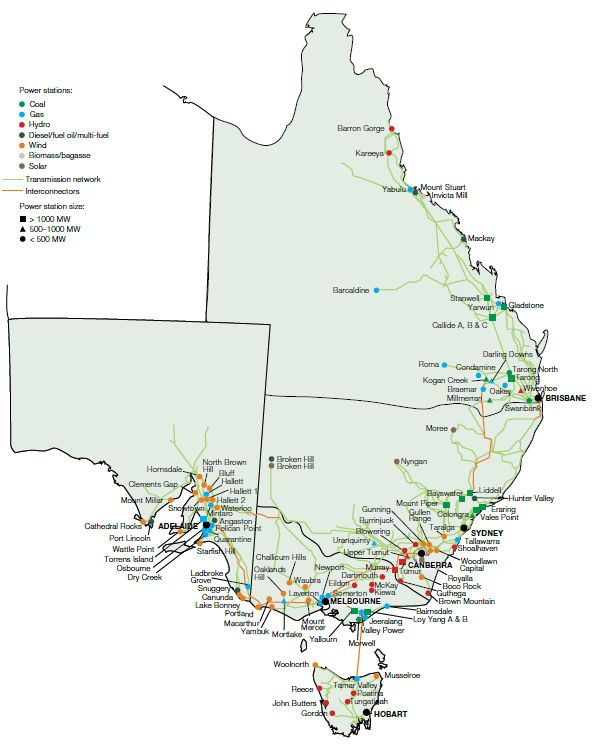
objectives, pricing signals, and risk management. Section 4 discusses the range of solutions proposed
and the pathways for achieving the NEM’s reliability and security aims. Finally, Section 5 provides
concluding remarks. The Appendix provides an overview of the NEM, including governance, regulatory
design, pricing formation, frameworks for reliability and security, and key market participants, as well
as approaches to hedging, and portfolio and risk management.

2. The changing dynamics of the electricity system
The NEM – Australia’s national electricity market – is a large grid connecting the major population
centres across the country’s east and south coasts. There is also a much smaller interconnected grid
in Western Australia (the South West Interconnected System) and an ‘archipelago’ of smaller grids and
systems located in Australia’s remote interior.
The NEM is the core focus of this study. It is the longest interconnected power network in the world,
extending over 40,000 kilometres and connecting major population centres on the southern and eastern
seaboards of Australia (AEMO, 2017i). It has an annual electricity demand of around 200 terawatt hours
(TWh) across 9 million customers. 3 The main sources of generation currently in the NEM are coal
(23 gigawatts [GW]), gas (12 GW), hydro (9 GW) and wind (4.4 GW) (see Figure 1).
The design of wholesale market is based on an energy-only gross pool, with zonal pricing across five
regions delineated by state boundaries. Participants bidding and offering energy and resources on a
regional basis are centrally cleared along with frequency control ancillary services (FCAS) via a dispatch
optimization engine (AER, 2017) (for a detailed discussion on the basics of market design in the NEM
please see the Appendix). While dispatch prices are set every five minutes, the market is settled on a
30-minute basis, with the price set at an average of the six 5-minute intervals within the settlement
interval. The Australian Energy Market Commission (AEMC) recently approved a rule change that will
align both dispatch and settlement intervals at five minutes (AEMC, 2017b).
At the moment, there is no formal day-ahead or forward dispatch market, although participants are free
to contract externally. Market indicators such as pre-dispatch and projected assessment of system
adequacy (PASA) provide guidance for market participants with respect to future system conditions,
dispatch, and pricing. Regulatory changes to implement organized forward markets are currently being
considered by rule makers.
Figure 1: Sources of generation in the NEM (excluding rooftop solar PV), 2017

Note: PV = photovoltaic.
Source: AEMO (2018b)

3
    A detailed map setting out the network and the location of generation stations is set out in the Appendix (Figure A1).

                                                                                                                             8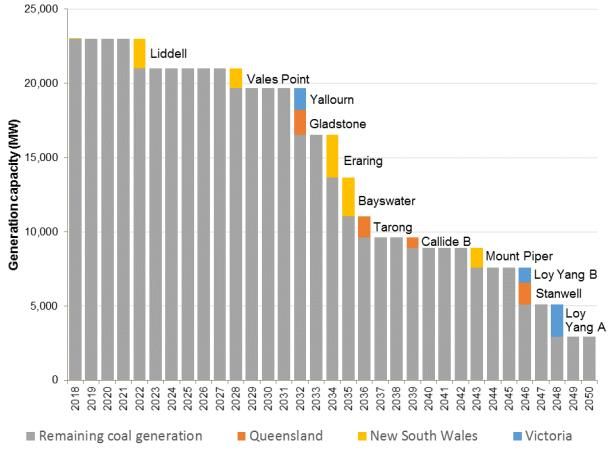
The energy needs of Australian electricity consumers have changed from the perspective of a centrally
dispatched system. Since 2010 there has been transformational growth in the installation of distributed
rooftop PV, primarily across residential customers, driven in part by government incentives and the
avoidance of high retail electricity rates (see Figure 2). As of December 2017, over 7.0 GW of distributed
rooftop solar PV capacity was installed in Australia, with rooftop PV penetration rates in excess of 50 per
cent in Queensland (ACIL Tasman, 2018; APVI, 2018).
This has resulted in changes to the diurnal patterns of demand that must be met by the centralized
market. Operational demand4 in states such as South Australia at certain times of the year is showing
clear ‘duck-curve’ net demand patterns (see Figure 3) (AEMO, 2018a).
This pattern is expected to become more extreme, based on projections for additional solar PV
installations over time driven by commercial and industrial deployment. Expectations are that rooftop
solar capacity will exceed 10 GW by 2020 (Green Energy Markets, 2018; Hyland, 2018), with long-term
expectations ranging from 20 GW to 37 GW (AEMO, 2017e; CSIRO-ENA, 2017). Australia is expected
to become one of the most decentralized systems in the world, with up to 43 per cent of generation
capacity located behind the meter by 2040 (BNEF, 2018).
South Australia, in particular, is expected on average to have very low or negative net demand during
peak solar generation times and to become a net exporter of generation to other regions. By 2024-25
it is expected that minimum summer operational demand for South Australia will go negative (see Figure
4).
Figure 2: Cumulative rooftop PV capacity (LHS) and residential rooftop penetration (RHS) in
Australia

Notes: ACT = Australian Capital Territory; NSW = New South Wales; NT = Northern Territory; QLD =
Queensland; SA = South Australia; TAS = Tasmania; VIC = Victoria; WA = Western Australia.
Source: ACIL Tasman (2018).

4
 According to AEMO (2018k) Operational Demand in a region is demand that is met by local scheduled generation, semi-
scheduled generation and non-scheduled wind/solar generation of aggregate capacity more than 30 MW, and by generation
imports to the region, excluding the demand of local scheduled loads.

                                                                                                                        9
Figure 3: Operational demand in South Australia
Source: AEMO (2018a).
Figure 4: South Australia minimum operational demand projection
Source: AEMO (2018i).
2.1 The buildout of utility-scale renewables
The growth of utility- or large-scale renewables generation has also been remarkable. The Renewable
Energy Target (RET) scheme, combined with technology cost reductions, has driven additional
investment in over 6 GW of renewable generation capacity over the last ten years (for more on the RET
please see the Appendix). The bulk of this buildout to date has been in wind generation, with over 5 GW
10of existing and operational capacity in the market (see Figure 5). In recent months, utility-scale solar
PV capacity additions have also been strong, with over 600 megawatts (MW) added in the second
quarter of 2018, taking total existing capacity to approximately 1 GW.
Further increases in renewables investment are expected across both wind and solar, driven in part by
the already low and still decreasing technology costs (Nelson, 2018). The pipeline for solar investment
comprises 1.9 GW of committed projects,5 with an additional 17 GW of proposed projects. For wind, a
further 2 GW are committed and an additional 18 GW proposed (AEMO, 2018b). By 2040, modelling
from the Australian Energy Market Operator (AEMO) suggests that VRE will be the dominant source of
electricity generation in the NEM (AEMO, 2018d) (see Figure 6).
Figure 5: Renewables buildout to date and expected future buildout in the NEM
Max. Generation Capaicty (GW)
Historical Forecast
12
+ 2GW expected + 35GW in
over balance of 2018 project pipeline
8
4
0
2005 2006 2007 2008 2009 2010 2011 2012 2013 2014 2015 2016 2017 2018 2019
Commissioning Date
Solar Wind Additional projects - date TBC + Project Pipeline
Notes: Historical capacity is based on AEMO registered capacity; estimated capacity additions based on
Integrated System Plan capacity (AEMO, 2018c) and proposed developments sourced from AEMO Generation
Information webpage; max. = maximum; TBC = to be confirmed.
Source: Based on AEMO (2018c) and adapted by the authors.
5
Projects that have received formal commitment for construction or installation.
11Figure 6: Projections of NEM generation capacity mix
Forecast NEM installed capacity in the Neutral case
Forecast NEM generation mix in the Neutral case
Notes: CCGT = combined-cycle gas turbine; GWh = gigawatt hour.
Source: AEMO (2018d).
2.2 The state of the legacy fleet
In contrast to renewables, the existing coal generation fleet in the NEM is ageing, with over 70 per cent
of coal facilities expected to exceed 50 years of full operation by 2040 and be approaching the end of
their operating lifetime (AEMO, 2017e) (see Figure 7). The gas fleet is younger, in general, with around
48 per cent of it less than 15 years old.
12Since 2012 approximately 5.2 GW of dispatchable coal-fired generation has permanently retired from
the market – including in recent years the Northern and Playford power stations in South Australia, and
the 1,600 MW Hazelwood power station in Victoria (Nelson, 2018), the latter with less than five months’
notice to the market. One of the key risks to the system is that of disorderly generation retirement without
sufficient time for the market to respond.
Figure 7: Coal generation fleet operating life (LHS) and gas generation fleet age (RHS)
Sources: AEMO (2017e), AEMO (2018b), Global Energy Observatory (www.globalenergyobservatory.org )
2.3 The energy crisis
In recent times, all three legs of the energy trilemma – affordability, reliability, and sustainability – have
been tested in the NEM.
First with regard to affordability, retail electricity prices have increased over the last ten years. Initially
retail increases were primarily attributable to higher regulated transmission and distribution charges,
but in recent years the wholesale cost of electricity has also increased (see Figure 8), partly resulting
from baseload retirements.
Second, a number of security and reliability challenges have also been experienced over the past three
years, the most notable of which was a statewide blackout in South Australia on 28 September 2016. 6
This was caused by storms which brought down transmission lines and resulted in voltage instability,
affecting wind farms and the South Australia to Victoria interconnector. 7
Third, from a sustainability perspective, the design of an appropriate emissions regulation scheme has
in recent years been hampered by political divisions that have made for a difficult and uncertain policy-
making environment. Australia has had a storied history with respect to environmental markets. In 2012,
the country established a carbon dioxide (CO2) emissions trading scheme that was to apply to large
emitters (over 25 million tonnes [mt] of CO2 equivalent [CO2e] per year), including large thermal
generation facilities. That scheme was subsequently abolished on a change of government in July 2014.
The Australian Government committed under the Paris Agreement to reduce Australia’s greenhouse
gas emissions by 26 to 28 per cent from 2005 levels by 2030 (Finkel et al., 2017). To date this has not
6
Other events included load shedding of customers in South Australia on 1 December 2016 and 8 February 2017, and load
shedding of large industrial customers in New South Wales on 10 February 2017.
7
Two tornadoes damaged a single-circuit 275 kilovolt (kV) transmission line and a double-circuit 275 kV transmission line and
resulted in nine wind farms in the mid-north of South Australia to exhibit a sustained reduction in power as a protection feature
activated. The reduction in wind farm output caused a significant increase in imported power through the Heywood
Interconnector to such a level that it tripped the interconnector offline and caused the state-wide black out. Full supply recovery
was not complete until 11 October and the market was suspended till that date. For further details see AEMO (2017j).
13led to the establishment of any new national emissions regulation scheme, although various guises
have been proposed. As a further example of the politically contested nature of energy/carbon policy,
the government’s flagship National Energy Guarantee failed to gain ultimate political party approval,
despite being approved by industry and the Council of Australian Governments (COAG), and was part
of a series of events that ultimately led to the replacement of the Prime Minister (Williams, 2018).
This situation has been further compounded by high prices and projected supply shortages in domestic
natural gas markets, with the potential for consequent impacts on the reliability and marginal cost of
gas-powered generation. While a review of the natural gas sector is outside the scope of this paper, the
efficient functioning of the domestic gas market was highlighted by the Finkel review as being important
to securing an efficient and reliable electricity system (Finkel et al., 2017).
Figure 8: Electricity pricing in the NEM
Average wholesale prices Average retail prices
Note: MWh = megawatt hour. Source: AER (2017).
Source: AEMO (2018b).
Note : $ refers to AUD
2.4 The regulatory response
These events have led to a number of policy reviews including: a comprehensive review of the electricity
market led by Chief Scientist Dr Alan Finkel (the Finkel review); reviews by regulatory bodies such as
the AEMC (on reliability and security frameworks) and the Australian Consumer and Competition
Commission (on market competition); and state-based reviews (such as on the retail market structure
in Victoria).
There have also been a number of regulatory responses and governmental interventions in response
to the crisis:
The (ultimately unsuccessful) proposal by the Commonwealth Government to establish new
reliability and environmental mechanisms via the National Energy Guarantee.
Market concerns over near-term reliability, which prompted:
o The market operator to source 1,054 MW of emergency reserves (Reliability and Emergency
Reserve Trader reserves) for summer 2017/18 (AEMO, 2017h).
o The return to service of the previously mothballed 385 MW Swanbank E gas-fired generation
facility, owned by a Queensland state-owned independent power producer (IPP) (Department
of Natural Resources, Mines and Energy, 2017).
o Directions by the Queensland government to its state-owned IPP to place downward pressure
on wholesale prices (Department of Natural Resources, Mines and Energy 2017).
14 A Commonwealth Government-driven initiative to expand the Snowy Hydro scheme by adding
2 GW of pumped hydro capacity, known as Snowy Hydro 2.0.
A set of energy initiatives by the South Australian government, which involved the buildout of
170 MW of diesel generation facilities, and the subsidized buildout of the world’s largest utility-
scale battery (100 MW/129 MWh), built by Tesla and owned by Neoen.
3. Challenges to the energy-only design under the energy transition
In the NEM, the recent events and challenges have led some to conclude that the energy-only market
is ‘broken’ and a fundamental redesign is required. Others have argued for a modification of the existing
design. However, before we can address solutions, we must first diagnose the specific nature of the
problem. This section highlights the specific challenges being faced in the NEM and identifies the
degree to which the existing market mechanisms are responding.
3.1 Resource adequacy in uncertain markets
The appropriateness of an energy-only market design versus its alternatives has long been debated –
indeed since the introduction of competitive energy markets. The theoretical basis for energy-only
markets, established by Schweppe et al. (1988), is the assumption of equilibrium, which is argued to
be rare in a practical context (de Vries and Heijnen, 2008; Hirth , Ueckerdt and Edenhofer, 2016).
Specifically, concerns have been raised with respect to the ability of the market to incentivize investment
to ensure resource adequacy (Cramton and Stoft, 2006). This is compounded by the prospect of political
or regulatory intervention supressing legitimate price signals (Simshauser, 2018).
Under a scarcity pricing approach, the market must be allowed to reach scarcity in order to establish
pricing signals sufficient to incentivize new investment (Hogan, 2005), which implies that the system is
unreliable during those times, with potential load shedding. This is a difficult proposition for electricity
given its essentiality and its nature as a core service in modern economies (Nelson, Orton and Chappel.,
2017). Energy-only designs can also conflict with the reality of financing capital-intensive assets, making
it difficult to meet debt repayment schedules, especially in the absence of long-term contract markets
(Simshauser, 2010; Nelson and Simshauser, 2013). This impacts risk appetite and the willingness to
make timely investments in new generation under a merchant generator model. Many markets around
the world have implemented or are considering implementing additional modules, such as capacity
mechanisms, in order to incentivize investment (Peng and Poudineh, 2017; Doorman et al., 2016).
3.1.1 The reliability value of renewables
The concept of reliability in the NEM is intimately connected with the adequacy of the existing resource
base to satisfy demand under a variety of conditions, including extreme or ‘tail risk’ conditions given a
99.998 per cent reliability standard specification.
The introduction of VRE and DER brings new challenges to maintaining reliability in the grid. Traditional
generation resources are dispatchable, meaning that generator power levels can be controlled and
shifted up or down to meet demand. System reserves can also be sized to deal with distinct credible
risks, for example the outage of a generation unit or a transmission line.
Wind and solar are by their nature variable, with generation patterns changing according to the
availability of the resource. Key issues for resource adequacy include: (i) the need to assess and
forecast generation contributions during peak grid demand, over a variety of timeframes; (ii) as much
of the solar generation base is distributed, the level of DER generation is itself a determinant of peak
grid demand; and (iii) a dispatchable and flexible resource base is thus still required to firm up supply
at times when VRE is unavailable.
15Patterns of generation for wind and solar can vary on a seasonal basis, but also quite significantly over
shorter periods (see Figure 9). An increasingly probabilistic approach is required to understand the
range of potential outcomes and reflect the need to account for multiple factors, including:
variability and uncertainty of the VRE generation base, including correlation between VRE
generation and forecasting errors/uncertainties
variability and uncertainty of demand, especially given DER
risks to the transmission network
risks of dispatchable generator outages and de-rating.
Figure 9: Sample variability of rooftop solar PV generation (LHS) and wind generation (RHS)
Rooftop PV: Variation in NEM wind
variation of 1.3 generation of over 3
GW GW
Note: GJ = gigajoule. Source: NEMSight (over week of 15 April 2018).
Source: NEMSight (over week of 18 February-2018).
3.1.2 Disorderly retirement and the sufficiency of dispatchable reserves
Since 2012 over 4.8 GW of new renewable generation capacity has been brought online across the
NEM, driven by in part by environmental and renewable energy policies and subsidies. Over the same
period, 5.2 GW of ageing dispatchable coal-fired generation has permanently retired from the market,
including in recent years the retirement of the Northern and Playford power stations in South Australia,
and the 1,600 MW Hazelwood power station in Victoria (Nelson, 2018).
However, there has been very limited investment in new dispatchable generation– for every MW of coal
capacity retired, only 0.5 MW of new dispatchable capacity has been brought online. This compares
with a ratio of 1.9 MW of gas investment for every MW of coal retired in the United States (Simshauser,
2018). Total system capacity of all dispatchable generation resources in the NEM has declined from
45.1 GW in 2011-12 to a low of 39.7 GW by 2016-17 (see Figure 10).
On a regional basis, local reliability concerns have been raised in Victoria and South Australia. As part
of its 2017/18 summer preparedness plans, AEMO highlighted increased risk of breaching reliability
standards in those regions (AEMO 2017b, 2017c).
Retirement of dispatchable plant (especially under timeframes that are insufficient to allow market
investment response) is argued to drive a ‘disorderly transition’ of the market (Nelson, 2018; Wood and
Blowers, 2017) and has prompted a reviews of reliability frameworks and design.
16Figure 10: Capacity and reserve margins in the NEM
Note: YTD = year to date.
Source: Data sourced from AER (www.aer.gov.au) and adapted by authors.
3.1.3 More renewables = lower average prices but more uncertainty?
Increased renewable capacity in the NEM has changed the pricing dynamics in the market. As variable
renewables have very low short-run marginal costs, system prices are likely to be low when renewables
are generating, but higher and more volatile otherwise (Nelson, 2016; Wiser et al., 2017; Bushnell and
Novan, 2018), especially in the situation where variable renewable generation is subsidized (such as
under the RET). The remaining dispatchable generation in the market is thus forced to recover more of
its revenue through a reducing number of high price events (Riesz, Gilmore and MacGill, 2016) which
adversely affects the economics of existing dispatchable generators (Nelson, 2017). Figure 11
illustrates the relationship between renewables penetration and price in South Australia.
17Figure 11: Renewables penetration and market pricing in South Australia, 2014-17
700
SA Regional Reference Price ($/MWh)
600
500 More volatility, higher prices at
low penetrations
400
300
Lower prices at high
200
penetrations
100
0
-100
0% 20% 40% 60% 80% 100% 120% 140% 160%
Wind Generation as a percent of Scheduled Demand (%)
Notes: This analysis covers trading intervals for the period from 1 January 2014 to 1 September 2017, excluding
the period of the SA blackout and consequent SA market suspension; 219 outliers with prices above $700/MWh
(out of over 60,000 observations) are not shown on this graph, all of which occur at renewable penetrations
below 13 per cent. References to $ are to Australian dollar.
Source: NEMWeb (www.nemweb.com.au).
3.1.4 The economics of new dispatchable investment
The scarcity pricing model relies on pricing signals translating into investment or retirement decisions
that provide for reliable electricity supply in an efficient manner. Despite concerns over reliability,
electricity markets have been in backwardation, that is, the price of electricity for future delivery has
been lower than the spot price (the current price of electricity). This is driven, in part, by expectations
of over 4 GW of new renewable investment supressing prices (see Figure 12). Looking ahead, wind is
anticipated to have the lowest levelized cost of energy (LCOE) in the NEM (Simshauser, 2018; Nelson,
2018). Combined with high gas prices, this has had a negative impact on the economics of new
baseload gas-fired generation, which would be expected to ‘firm up’ renewables.
The economics of fast-start generation, such as open-cycle gas turbine (OCGT) or reciprocating engine
technology, are also uncertain. While the ‘five-minute settlement’ rule change is intended to incentivize
fast start and flexible forms of generation once active in 2021, the economics of new investment at
electricity forward prices had not appeared highly attractive in the intervening period (see Figure 13).
Recent secondary market acquisitions of legacy gas portfolios have taken place at AUD 216 per kilowatt
(kW), relative to the cost of new generation at AUD 1,000/kW (OCGT) and AUD 1,600/kW (CCGT)
(Macdonald-Smith, 2018; AEMO, 2018c). To date, new investment of this form has been measured and
has focused on replacing lost capacity rather than adding incremental capacity to the system (see for
example AGL Energy, 2017).
New investment has also been more difficult in the context of:
difficulties in securing long-term gas supply and transport agreements (ACCC, 2017a)
broader environmental and carbon policy uncertainty (Nelson, Orton and Chappel, 2017)
assessing the risk of further government intervention
assessing portfolio impacts – for a merchant player the impact of a new supply source could
crowd out and cannibalize its existing assets.
18The state of financing markets and capital adequacy can also affect which parties are able to finance
new plant. Merchant generators may struggle to obtain attractive project finance, while independent
retailers are unable to offer long-term offtake (Simshauser, Tian and Whish-Wilson, 2014; Nelson and
Simshauser 2013).
Figure 12: Electricity futures curve
Note: FY = financial year; FYTD = financial year to date.
Source: ASX Energy (www.asxenergy.com.au) as at 7 June 2018. References to $ are to Australian dollar.
Figure 13: Economics of new gas-fired capacity
Economics of new Economics of new OCGT and
CCGT capacity reciprocating engine capacity
Notes: Electricity caps are a derivative instrument that provide price protection against high prices; see
www.asxenergy.com.au/products/overview_of_the_australian_el for further details; CF = capacity factor.
Source: Calculation of LCOE based on approach in AEMO (2018a) using assumptions in AEMO (2018c).
References to $ are to Australian dollar.
3.1.5 Contractual liquidity
An active, transparent, and liquid contract market is important for the reliable operation of the market.
Due to its variable nature, VRE generation is not able to offer the firm-volume contracts that is typical
for exchange-traded products (Simshauser, 2018). Financial innovation is required to allow VRE to
participate actively in contract and hedging markets.
19A noticeable decline in Australian Stock Exchange (ASX) energy contract liquidity was observed
between 2014 and 2017 for cap and swap products, particularly for the New South Wales and South
Australia regions (AEMO, 2018a) (see Figure 14). There is no consensus as to the reasons for such a
decline. Some have argued that the vertical integration model has driven this decline, as parties are
increasingly able to self-hedge, thereby reducing reliance on contract markets for management of their
net exposure (Wood and Blowers, 2017). By contrast, assessments by Simshauser, Tian and Whish-
Wilson (2014), Mansur (2007) and Bushnell, Mansur and Saravia (2008) suggest that vertical
integration does not account for reduced liquidity.
Figure 14: ASX Energy, electricity swap and cap contract volumes
Source: AEMO (2018a).
3.2 The complexities of system security
Managing the stability and security of a large-scale AC system is a complex and multi-faceted operation.
Wind and solar PV generation technologies are typically ‘asynchronous’, which means they are
connected to the grid via inverters (which convert DC electricity into grid-compatible AC electricity). This
introduces new challenges for system security, but also provides the opportunity for new technologies
to resolve the issues.
3.2.1 Near-term concerns for security
Regulatory bodies (AEMO and the AEMC) have identified frequency control and system strength as
two near-term priority areas for system security (AEMC, 2017f; AEMO, 2016).
In recent years, the regulation of frequency has become more challenging (see Figures 15 and 16)
(Crisp, 2017), driven by:
The retirement of large thermal synchronous generators, which has reduced the level of inertia
in the system. Inertia determines the speed at which frequency degrades after a disturbance. 8
Larger sources of variability in the system from wind and solar PV.
8
The rate at which frequency degrades after a system disturbance is known as the ‘rate of change of frequency’ (ROCOF). If
the ROCOF is too high (i.e. frequency degrades very quickly), frequency control ancillary services may not be able to respond
effectively to bring frequency back to normal ranges. All else being equal, a system with less inertia will have a higher ROCOF,
which could present risks to system security. Further information is www.aemo.com.au/-/media/Files/Electricity/.../Power-
system-requirements.pdf.
20 A reduction in the amount of governor response from synchronous generation. Governors are
feedback control systems at power plants that change power output in response to frequency
changes (also termed primary frequency control).
System strength is also a concern for the system in areas with high renewable generation, such as
South Australia and western regions of Victoria. System strength is an umbrella term that reflects the
ability of the power system to maintain stability after a disturbance (AEMO 2017a; 2017f). System
strength is a highly localized issue and varies across parts of the network (see Figure 17). It is
determined by the number of synchronous machines connected nearby, and the number of
transmission lines or distribution lines (or both) connecting synchronous machines to the rest of the
network.
Figure 15: Mainland frequency deviations Figure 16: System inertia in South Australia
Note: Graph shows number of frequency band Source: AEMC (2017f)
exceedences in a three-year historical trend.
Source: AEMO (www.aemo.com.au).
21Figure 17: AEMO system strength assessment in 2016-17 (left) and 2035-36 (right)
Source: AEMO (2017e).
3.2.3 The value of ‘spin’ in an AC network
Synchronous units (such as synchronous generators, synchronous condensers, and synchronous
motors) provide an inherent contribution to inertia and system strength as a result of their spinning
turbine mass. Asynchronous generators do not presently provide significant contributions.
System strength and inertia are both based on ‘commitment’ rather than ‘generation’. This means that
the amount of inertia and system strength provided by a synchronous unit depends on whether it is
online and synchronized to the system and the turbine is ‘spinning’. It is effectively a binary outcome –
the unit provides its full contribution to inertia if it is generating and zero if it is not. Its contribution does
not scale with the amount of active power being generated.
While services such as inertia can be transferred across AC transmission interconnections, regions
such as South Australia are more vulnerable given that it currently has only one AC interconnection
with the rest of the NEM (AEMO, 2017g).
Some non-synchronous technologies, such as wind generation or battery systems, can provide a very
fast frequency response (FFR), which may be equivalent to an ‘emulated’ synchronous inertial
22response. Requirements for this ‘emulated’ response are in place in international markets, 9 and the
Finkel review recommended that FFR requirements be incorporated as part of licensing requirements
for new asynchronous generation. Trials are have been undertaken to test the functionality and efficacy
of these technologies for frequency response (AEMC, 2018b). An example includes the recent trial
project that saw the Hornsdale 2 wind farm, an asynchronous and intermittent generation source,
provide FCAS into the market.10
3.2.3 Increasing intervention in the market
Given concerns around system strength in South Australia, AEMO has imposed operating
arrangements for the minimum configuration of synchronous generation that is required to be online in
the region (AEMO, 2017f). The minimum increases with the output of non-synchronous generation. If
the minimum level is not expected to be met via dispatch, AEMO will intervene in the market to direct
generation plant to come online.
In recent months, AEMO has increasingly been required to intervene in the markets, at times when
market prices do not provide sufficient incentive for thermal generators to be online (see Figure 18)
(AEMO, 2018a). In April and May 2018 in South Australia, directions were in place for the majority of
the month in order to maintain sufficient system strength.
Figure 18: Directions for system strength purposes in South Australia
Source: AEMO (2018j).
3.2.4 Security frameworks: Securing efficient, timely investment in system security
Both system strength and inertia were traditionally provided by thermal synchronous generators by
virtue of their participation in wholesale markets rather than through designated centralized markets or
procurement via contract.
Recent rule changes by the AEMC now designate transmission network service providers (TNSPs) as
the entities responsible for providing minimum levels of inertia and system strength. The framework
relies upon the identification of gaps in system security requirements by AEMO, which then triggers a
9
This includes Canada, Saudi Arabia, Brazil, Ontario, and Norway. See Tamrakar et al. (2017).
10
For further details see https://arena.gov.au/blog/when-the-wind-changes/. Further trials are being considered for the
Musselroe wind farm (https://arena.gov.au/assets/2018/03/ARENA-Media-Release_Musselroe-Woolnorth-FCAS-wind-farm-
trial-07032018.pdf).
23process with the relevant TNSP to resolve the issue. 11 This approach relies upon AEMO having clear,
accurate, and fully updated information on the operating plans of generation units. It also emphasizes
the need for greater lead times for permanent or temporary withdrawal of capacity from the market.
The rule change is a positive step as it ensures that responsibility for these system requirements is
clearly allocated. However, over the longer term there is a broader question of whether a utility
regulation framework, based upon asset-based revenue recovery, is the right mechanism to deal with
real-time system strength and inertia conditions, or whether a competitive services market is more
appropriate. For the former to work, the framework must appropriately incentivize the relevant network
operator to canvass the full range of procurement options (including contracting or tendering for the
service) and technologies available. The framework must also allow the utility to respond flexibly to
changing market dynamics. For example, regulatory processes must envisage the possibility of fast-
tracked processes to deal with unplanned generator retirements.
In South Australia, a gap relating to system strength was identified and the resolution process triggered
in October 2017. The regional TNSP, Electranet, has announced the buildout of synchronous
condensers (‘syncons’) by 2021 to deal with the issue (see Figure 19). 12 This, however, still leaves the
system at risk over the interim period and reliant upon ongoing market intervention by the operator,
especially given the upcoming retirement of some thermal units in the state.
Figure 19: Synchronous condenser sites in South Australia
Source: Electranet (www.electranet.com.au)
3.2.5 Future system security considerations
As renewables penetration increases and the legacy synchronous fleet retires, an enhanced suite of
services is likely to be required to maintain system security. Additional considerations include:
Grid forming – frequency is traditionally set by large synchronous generation units by virtue of
normal operation. Asynchronous plant in the NEM does not currently provide grid-forming
11
Similar requirements have also been established in the European Union. Regulation 2017/1485 establishes minimum inertia
requirements at the synchronous area level, with transmission system operators required to conduct studies to identify whether
the minimum required inertia needs to be established.
12
Synchronous condensers are effectively electric motors whose shaft is not connected to anything. They can provide multiple
services including inertia, system strength, and reactive power.
24You can also read


