SOUTH AFRICA SOLAR HEAT FOR INDUSTRY - Solarthermalworld
←
→
Page content transcription
If your browser does not render page correctly, please read the page content below
SOLAR HEAT FOR INDUSTRY
     SOUTH AFRICA
                   Solar
                   Payback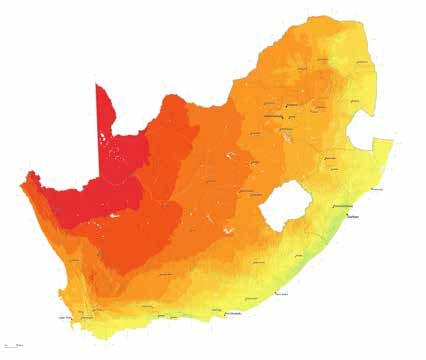
CONTENTS
ACKNOWLEDGEMENT AND AUTHORS......................................................................2
        About Solar Payback................................................................................... 2
        Economic Support...................................................................................... 2

EXECUTIVE SUMMARY.................................................................................................3

 1. THE MACROECONOMIC FRAMEWORK AND ENERGY POLICY
    IN SOUTH AFRICA .................................................................................................4
        1.1 Introduction.......................................................................................... 5
        1.2 The Economic and Industry Development in South Africa............................ 5
        1.4 Incentive Programmes and Financing . . ..................................................... 8
        1.5 Industrial Energy Usage in South Africa.. ................................................... 9
        1.6 Energy Costs in South Africa . . ................................................................. 10
        1.7 Energy Infrastructure for Industrial Facilities............................................... 14

 2. SOLAR THERMAL MARKET FOR INDUSTRIAL PROCESSES............................19
        2.1 Description of Solar Thermal Technologies for Industrial Processes. . ............. 20
        2.2 Temperature Ranges.............................................................................. 23
        2.3 Local Solar Thermal Technologies............................................................ 24

 3. INDUSTRY LANDSCAPE AT LOW AND MID TEMPERATURE LEVELS..............28
        3.1 Global Context of Industries Implementing SHIP......................................... 29
        3.2 Local Industry Landscape in Target Industries............................................ 30
        3.3 Target Industry Overviews....................................................................... 35
        3.4 Companies that Expressed Interest in Solar Payback ................................. 39
        3.5 The Potential of Low and Medium Temperature Applications .. ...................... 40

 4. PROJECT DEVELOPMENT PROCESS FOR SHIP PLANTS ................................42
        4.1 Description of the Design and Planning of SHIP Plants . . ............................. 43
        4.2 Structure of a SHIP Project in South Africa................................................ 46
        4.3 Project Operation and Maintenance . . ....................................................... 48

 5. ECONOMIC PROFITABILITY OF SHIP SYSTEMS............................... 50
        5.1 Methodological Considerations . . ............................................................. 51
        5.2 Economic Calculations of Case Studies under Certain Frame Conditions....... 54

 6. CONCLUSIONS AND RECOMMENDATIONS...................................... 58
        6.1 Potential for SHIP in South Africa............................................................. 59
        6.2 Barriers and Recommendations .............................................................. 59

REFERENCES................................................................................................................62

APPENDICES.................................................................................................................64

GLOSSARY....................................................................................................................68
ACKNOWLEDGEMENT
AND AUTHORS
Editors: Jan Knaack (German Solar Association, BSW), Dr Peter Klein (Council for Scientific
and Industrial research, CSIR), Dr Karen Surridge (South African National Development
Agency, SANEDI), Markus Wolf (Previously South African German Chamber of Commerce,
AHK), Pedro Horta (Fraunhofer Institute for Solar Energy)

Acknowledgements: Sashay Ramdharee (South African National Cleaner Production
Centre, NCPC), Henry Laing (Ozone Business Consulting, O 3BC)

About Solar Payback
The objective of the three-year Solar Payback project is to promote the use of Solar Heat for
Industrial Processes (SHIP) in four countries: South Africa, India, Mexico and Brazil.
As part of the International Climate Protection Initiative (IKI), the project raises awareness of
the technical and economic potential of SHIP technologies through clear and transparent
information about the costs and benefits of SHIP applications, and helps to create reference
systems. Solar Payback also collaborates with financial institutions to develop models that
assist different actors and investors in accessing financing.
www.solar-payback.com

Economic Support
Solar Payback is a project that is part of the International Initiative for Climate Protection (IKI).
The Federal Ministry of the Environment, Protection of Nature, Public Works and Nuclear
Safety (BMUB) encourages the initiative by decision of the German Parliament.

Project Coordinator

                     BSW - Bundesverband Solarwirtschaft e.V.
                     – German Solar Association –
                     Lietzenburger Straße 53
                     10719 Berlin
                     Germany
EXECUTIVE SUMMARY The industrial sector in South Africa is the largest consumer of energy, accounting for 37.3% of final energy consumption. Industrial energy use is predominantly thermal with process heating estimated to account for two thirds of energy end-use. Currently, this thermal energy is primarily supplied by fossil fuels, which contribute to greenhouse gas emissions. In order for South Africa to achieve its emissions reduction targets it is critical to decarbonise the supply of process heat in combination with the decarbonisation of the electricity sector. The use of solar thermal systems to supply process heat for industry at temperatures below 400℃ has the potential to reduce emissions, whilst improving industrial competitiveness and achieving a diversified energy mix. Currently solar thermal technologies have been considered for power generation (CSP) in South Africa, but these technologies have not been widely utilised to supply solar heat for industrial processes (SHIP). South Africa’s extensive solar resource, coupled with the most developed economy on the African continent, presents significant opportunities for growth in the SHIP market. This report presents an overview of the industrial sectors in South Africa that have a high potential for SHIP deployment. Industrial energy consumption within South Africa is contextualised in Chapter 1 of this report through a macro-economic analysis. Energy policies and incentive schemes that relate to SHIP are also discussed. Chapter 2 presents a description of solar thermal technologies for industrial process heat. This includes a description of relevant technologies for the production of hot water or steam up to 400℃. An overview of the local solar thermal industry is also provided. Chapter 3 presents an analysis of the South African landscape of industrial sectors that require heat at low (
CHAPTER 1
        THE MACROECONOMIC FRAMEWORK
        AND ENERGY POLICY IN SOUTH
        AFRICA

4I   SOLAR HEAT FOR INDUSTRY: SOUTH AFRICA
1.1 Introduction
South Africa (SA) is located in the sun-belt and therefore has an extensive solar resource, with
annual solar irradiation in many industrial areas in the order of 2,000 kWh/m2. Due to the high
solar resource there is already a widespread utilisation of solar power for electricity generation
but surprisingly only a small niche market for large solar thermal (ST) applications. The most
common types of large ST installations in SA, with a gross collector area exceeding 10m 2, are
for domestic hot water purposes with a share of 69% of the total installed capacity, while the
usage for solar heat in industrial processes (SHIP) accounts only for only 7% (Joubert, Hess,
& Van Niekerk, 2016).
The preconditions and the potential for SHIP in SA are very good due the high solar resource,
combined with a strong economy and existing infrastructure. South Africa has the most
developed and well-established economy on the African continent, which results in a number
of possible commercial users for SHIP from a range of industries. Despite these promising
characteristics, the market for SHIP installations in SA is in its infancy, with a limited number
of plants and a general low level of awareness amongst industry regarding the potential for
SHIP deployment. Due to the rapid decrease in the cost of photovoltaic (PV) panels many
companies who deal with renewable energy sources first look into the mainstream ‘plug and
play’ PV power solutions. Another challenge for SHIP installations is the extensive use of coal
for process heating purposes, which constitutes a challenge for the economic competition of
SHIP installations, due to low coal prices from a large domestic coal industry.
The fact that the SHIP market in SA is not mature presents an obstacle to getting a critical mass
in the deployment of plants. The project Solar Payback aims at assisting SA to realise its large
SHIP potential through raising the awareness of the technological and economic benefits of
solar thermal technologies. This enabling study considers the framework conditions for SHIP in
SA and identifies the country’s key industries with a high SHIP potential.
1.2 The Economic and Industry Development in South Africa
In 1994, South Africa re-joined the international trade markets and is now one of the dominating
economies and driving force on the African continent. It is populated with almost 56 million
(2016) people and it has the third highest gross domestic product (GDP) on the African
continent, amounting to 295,456 million USD and a GDP per capita of 5,274.5 USD (World
Bank, n.d.). For more than five years the GDP growth rate was below 2% and in the last two
years it dropped below 1%. These rates were highly unsatisfactory as the population growth
rate was higher, resulting in a decrease in the general living standard. A significant challenge
in the country is the high unemployment rate that exceeds 26%. The latest monthly inflation
rates were 4.4% in January 2018 and 4.0% in February 2018, which is in a satisfactory range
(StatsSA, n.d.)
In general, the economy is diversified and the industrial sector’s structure is similar to international
developed countries. However, South Africa’s economy is generally characterized by strong
opposites and fundamental structural problems. This is shown by the Global Competitiveness
Index 2017/18 of the World Economic Forum in which South Africa fell from rank 47 (2016/17)
to rank number 61 of 137 evaluated countries. Nevertheless, ranking 61 still makes South
Africa the third best rated African country.
CHAPTER 1: THE MACROECONOMIC FRAMEWORK AND ENERGY POLICY IN SOUTH AFRICA I5The national currency, South African Rand (ZAR), lost value compared to the Euro over recent
years. The currency is volatile and sensitive to public policy announcements and decisions, as
well as to movements on the international financial markets, resulting in high currency fluctuations
causing problems for the economy as project planning with imported goods becomes more
unpredictable. The current prime lending rate is 10%, which is relatively high compared to
western countries and sets a substantial burden for bank financed investments and especially
for renewable energy projects, which usually have a higher CAPEX than conventional energy
investments. The level of direct foreign investments has shown a downward trend over the last
couple years, and in the last census in 2016 it was at 2.25 billion USD (World Bank, n.d.).
In April 2017, the credit rating of South Africa has been downgraded by Standard’s & Poor
(S&P) and Fitch to BB+ which is better known in public as “junk status”.
Table I: South Africa’s credit rating by international Rating Agencies
Standard & Poor’s BB, stable
Moody’s Baa3, stable
Fitch BB+-, stable
Trading Economics Rating 49, non-investment grade speculative
In the country rating of Euler Hermes, the export credit insurance of the Federal Republic of
Germany, South Africa is assigned to country category 4 (category 0 = lowest risk, category 7
= highest risk) in 2018. Euler Hermes defines the South African market as “medium risk” with
a stable outlook and no formal coverage restrictions. Critical points mentioned are the high
unemployment rate, the unequal income distribution, the insufficient education system as well
as the growing budget deficit and the weak exchange rate.
South Africa’s most important trade partner is China, while the European Union (EU) is another
important trade partner of South Africa, importing 20% of the country’s exports. At the same
time the EU delivers about 30% of the imports of South Africa. Among the EU countries Germany
and the United Kingdom are the leading trade partners. South Africa’s foreign trade is strongly
shaped by its raw material exports, which makes the economy to some stage vulnerable due to
international raw material price fluctuations. Also, South Africa has no major oil sources, which
makes it dependent on the world market price for crude oil imports.
Due to the fluctuating character of the economy and its development, it is quite difficult to predict
a prefund economic outlook. The governmental outlook during the last years was always quite
optimistic but finally could not achieve its predictions. Due to the downgrading of the rating
agencies, prospectively, it will be even more difficult to uplift the economic growth. However,
since 17th December 2017, Cyril Ramaphosa became the new President and with him a lot of
hope to economical improvements raised.
Table II: Economic Forecast 2018–2020 Outlook (tradingeconomics.com)
Actual Q1/2018 Q2/2018 Q3/2018 Q4/2018 2020
GDP Growth Rate (in %) 3.1 2.5 2.0 1.5 1.9 2.1
Unemployment Rate (in %) 26.7 28 27.8 27 27 24
Inflation Rate (in %) 4.0 4.4 4.6 4.8 4.9 5.1
Competitiveness Index (points out of 7) 4.32 4.45
Balance of Trade (in mil ZAR) -27,700 -565 -5434 -7176 472 -1700
Government Debt to GDP (in %) 53.1 54 54 54 54 56
6I SOLAR HEAT FOR INDUSTRY: SOUTH AFRICA1.3 Energy Policies in South Africa
South Africa’s energy policy in the past focused heavily on issues of security of energy supply
and self-reliance. With the publication of the White Paper on Energy (1998), and the White
Paper of Renewable Energy (2003), more focus was placed on pursuing energy supply security
through greater diversification. This was one of the earliest indications that the government
would promote cleaner energy (such as solar thermal) and diversify away from coal. The National
Strategy on Climate Change of 2011 looked more specifically on emissions and South Africa is
now deliberating on implementation of a carbon tax and carbon budget.
At present, there are no policies directly targeting Solar Heat for Industrial Processes (SHIP).
Efforts are still under way to produce a solar energy technology roadmap that does include
SHIP. Once the potential benefit to the country is demonstrated in this manner, the merits of
introducing supportive policies will be clear. Solar water heating in the residential and commercial
sector, does enjoy some policy support as it is a more mature sector in South Africa than
the solar process heating sector. The South African Government’s National Development Plan
2030 has a target of 3 million solar water heaters by 2030.
1.3.1 Carbon Budgets and Tax Policy
South Africa made a voluntary commitment to reduce its greenhouse gas (GHG) emissions by
34% in 2020 and 42% in 2025 relative to business-as-usual (BAU). This was reaffirmed in its
Intended Nationally Determined Contribution (INDC) submission to the United Nations Framework
Convention on Climate Change UNFCCC, which stated emissions should peak in 2025 within
a range of 398-614 MtCO2e; plateau for a decade; and then decline to between 212-428
MtCO2e by 2050. Two measures are envisaged to contribute to achieve this goal. The first is a
Carbon tax which is currently the subject of a bill to be deliberated by lawmakers. The second
measure involves a series of carbon budgets designed by the Department of Environmental
Affairs (DEA) to provide a GHG emissions allowance or cap, against which physical emissions
arising from the operations of a company during a defined time period will be tracked. In the
period to 2020, the carbon budgets will not be a compliance instrument but rather will be used
to increase understanding of the emissions profile of participating companies, and to establish
monitoring, reporting, and verification (MRV) processes. Beyond 2020, they are intended to
become compulsory.
1.3.2 Industrial Policy Action Plan
The Industrial Policy Action Plan (IPAP) stems from the National Industrial Policy Framework
(NIPF) that was adopted by government in January 2007 and set out government’s board
approach to industrialisation. IPAP identified significant opportunities to develop new green
and energy efficient industries and related services in South Africa, and highlights that the
country’s manufacturing sector will need to improve its energy efficiency. IPAP identifies key
sectors, many of which are relevant to SHIP, namely: agro-processing (including food and
beverage); chemicals, plastics and pharmaceuticals; clothing, textiles, leather and footwear;
and automotive products and components.
CHAPTER 1: THE MACROECONOMIC FRAMEWORK AND ENERGY POLICY IN SOUTH AFRICA I71.4 Incentive Programmes and Financing
Table 1 outlines incentive programmes and financing schemes, beneficial to SHIP projects.
TABLE 1: Relevant Incentive Schemes Identified
Instrument Name Impact/effect
Tax Carbon Tax Bill Increases the competitiveness of clean technologies such as SHIP by placing a
price on carbon emissions. The tax will be phased in over a period of time to allow
for smooth transition in adopting cleaner and more efficient technologies and
behaviours. The proposed initial marginal carbon tax rate will be R120 per tonne of
CO2e (carbon dioxide equivalent). However, up to 2020 a series of basic tax-free
allowances will be made available that will see companies effectively pay between
6-48 ZAR/tCO2e.
Tax incentive Section 12B of the Provides for a capital allowance for assets used in the production of renewable
Income Tax Act of energy. It allows for a deduction/depreciation on a 100% basis (1MW) over 3 years in respect to a qualifying
asset owned by the taxpayer. Assuming a company tax rate of 28%, the use of
accelerated depreciation improves the economics of investing in solar thermal
plants in comparison to maintaining the status quo and burning fossil fuels or using
electricity. It is recommended that a company applies for a binding ruling from
the South African Revenue Service (SARS) before investing in solar equipment to
determine if they qualify for deductions under the 12B Act amendment.
Incentive Manufacturing The objective of Manufacturing Competitiveness Enhancement Programme (MCEP)
Competitiveness is to improve and promote enterprise competitiveness and job retention. MCEP
Enhancement consists of two programmes, namely: The Production Incentive (managed by DTI)
Programme (MCEP) and the Industrial Financing Loan facility (managed by IDC).
https://www.thedti.gov.za/DownloadFileAction?id=670&filename=pi_
guidelines_2012_2013.pdf
Production Agro-Processing The scheme offers a 20-30% cost sharing grant to a maximum of twenty million
support/ incentive Support Scheme rand (R20 million) over a two (2) year investment period, with at last claim to be
(APSS) submitted within six (6) months after the final approved milestone.
https://www.thedti.gov.za/news2017/Agro-Processing_Support_Scheme_
Guidelines.pdf
Incentive Production Incentive The Production Incentive Programme (PIP) is aimed at structurally changing the
Programme (PIP) Clothing, Textiles, Footwear, Leather and Leather Goods manufacturing industries
by providing funding assistance to invest in competitiveness improvement
interventions. An Upgrade Grant can be used for the following qualifying
expenditure: upgrading of existing plant and equipment; acquisition of new plant
and equipment which will have the effect of improving the overall competitiveness
of the applicant (SHIP may potentially improve the competitiveness of any textile
factory with lower energy costs). Details on how to apply the PIP may be found
here:
http://www.ctcp.co.za/tmp/PIP GUIDELINES 2016-2017.pdf
Support on Climate Change/Energy Efficiency Strategy from National Cleaner
Production Centre (NCPC)
The NCPC supports industry in quantifying opportunities for improving energy and resource
efficiency (i.e. energy, water, waste reduction). This programme is funded through the Department
of Trade and Industry (DTI) with the specialised energy component supported by the United
Nations Industrial Development Organization (UNIDO). Although the core focus is not exclusively
solar heating, the programme is well-positioned to identify industrial processes that may be
made more competitive using solar-based process heat and recommending these interventions
to their client companies. Upon request, the programme is able to access funds from the DTI/
UNIDO to support investigations into where client companies may use solar process heating
to improve profitability. This service offering is provided under the NCPC programmes that give
effect to the country’s policies on improving energy and resource efficiency.
8I SOLAR HEAT FOR INDUSTRY: SOUTH AFRICA1.5 Industrial Energy Usage in South Africa
As shown in Figure 1 final energy consumption in South Africa has been experiencing sustained
growth between 2000 and 2015. The industrial sector is currently the largest energy consumer,
Figure 1
accounting for 37.3% of final energy consumption.
Industry
Transport
Residential
1 200 Commercial
Other
1 000
Final Energy Consumption [PJ]
800
600
400
200
0
2000 2005 2010 2015
FIGURE 1: Final energy consumption in South Africa per sector (PJ) from 2000 to 2016
Source 1: International Energy Agency Energy Balances for South Africa
The latest available energy balances from the International Energy Agency for South Africa are
for the year 2015 and indicate that the industrial sector consumed 1167 PJ of energy. Fuel
accounted for 730 PJ (62.5%) of the industrial energy consumption and electricity 438 PJ
Figure 2
(37.5%). Due to the availability of local coal reserves coal is the dominant fuel that is used in
industry with 476 PJ consumed in 2015.
Industry
Transport Coal
Residential
Other 63%
heat
Oil
Biofuels
16% and waste
Natural gas
37%
23%
37%
24% electricity
FIGURE 2: Final energy consumption for South Africa in 2015 (total: 3131 PJ)
Source 2: International Energy Agency Energy Balances for South Africa
CHAPTER 1: THE MACROECONOMIC FRAMEWORK AND ENERGY POLICY IN SOUTH AFRICA I9Thermal energy is the dominant end-use of energy in the industrial sector. Fossil fuels are
primarily used in the industrial sector for process heating, while the end-use of electricity is
diverse, but includes significant amounts of heating and cooling in a number of industries. As
shown in Figure 3, the South African Department of Energy (DoE) estimates that overall 71% of
energy end use in the industrial sector is for thermal
Figure 3 applications.
Other
29.34%
Process
Water heating heating
0.50% 3.38%
Process 66.27%
HVAC cooling ;
0.51%
FIGURE 3: End use of energy in the industrial sector
Source 3: (Department of Energy, 2016)
Figure 4
1.6 Energy Costs in South Africa
The economic viability of a solar thermal system is dependent on the fuel offset from competing
heating systems, typically steam boilers. Table 2 provides an overview of the estimated heating
costs for different energy carriers used for process heating in mid-2017. Input energy costs
are based on the calorific value of the energy carrier, whilst steam/heat costs are calculated
assuming a 60-80% conversion and distribution efficiency.
TABLE 2: Indicative energy costs for process heating in mid-2017
Energy Source Cost Unit Cost1 kg CO2 per Input cost Heat cost
(ZAR) (ZAR/GJ) kWh input (ZAR/kWh) (ZAR/kWh)
energy2
80% 60%
Coal Gauteng 3
0.9 kg 34 0.34 0.12 0.15 0.20
Coal Western Cape3 1.5 kg 57 0.34 0.20 0.25 0.33
SASOL Gas C5 4
90 GJ 90 0.20 0.32 0.41 0.54
SASOL Gas C34 124 GJ 124 0.20 0.45 0.56 0.74
SASOL Gas C1 4
149 GJ 149 0.20 0.54 0.67 0.89
Heavy Fuel Oil (HFO) 5
5.2 litre 126 0.28 0.45 0.57 0.76
Paraffin6 7.14 litre 190 0.26 0.69 0.86 1.14
Electricity Eskom Night Save 7
0.65 kWh 180 1.06 0.65 0.81 1.08
Electricity City Power 8
1.14 kWh 317 1.06 1.14 1.43 1.90
Diesel6 11.6 litre 304 0.27 1.09 1.37 1.82
Liquefied Petroleum Gas (LPG) 6
18.81 kg 408 0.23 1.47 1.84 2.45
1 Conversion factors (Department of Environmental Affairs, 2017), prices exclusive of VAT; 2 Based on (Intergovernmental Panel on Climate Change, 2006); 3 Grade B
assumed, transportation costs estimated and included, ash disposal excluded ; 4 Assumed Gauteng zone, C1: 0-0.4 TJ p.a. C3: 4-40 TJ p.a. C5: 400-4000 TJ p.a.
(Department of Energy, 2016) ; 5 Average market price per supplier; 6 (South African Petroleum Industry Association, 2017), VAT excluded for LPG price.; 7 Average
of summer and winter tariffs for Eskom Night Save industrial customers (0.5-66kVA in Gauteng), excludes average peak demand charge of 71 ZAR/kVA/m and 42 ZAR/
kVA/m network charge (Eskom, 2017); 8 Average of summer and winter tariffs for City Power industrial customers (1-33 kVA in Johannesburg), excludes peak demand
charge of 160 ZAR/kVA/m (MV) and 4322 ZAR/m service and capacity charge (City Power Johannesburg, 2016)
10 I SOLAR HEAT FOR INDUSTRY: SOUTH AFRICAThe low cost of coal as an energy carrier indicates why it is extensively used in boiler systems
across South African industries. South African coal prices are strongly dependent on location
due to transport costs, with prices lowest in areas near to the mines, predominantly in the
Mpumalanga province.
As an alternative to coal, companies located in regions that are connected to the gas distribution
network can make use of gas as a low-cost energy carrier. A description of the gas infrastructure
is provided in Section 1.7 and excludes many industrial areas. Smaller companies are also
likely to use Heavy Fuel Oil (HFO) or paraffin as an alternative energy carrier to coal, due to the
logistics of coal supply, storage and ash disposal.
1.6.1 Outlook on Future Energy Cost Developments
Rising energy costs should be taken into consideration when analysing the value of a solar
thermal system. In Figure 4 (a)/(b) the historic prices of key energy carriers are presented in
real terms over the past 10 years to exclude the effects of inflation. Therefore, any Levelized
Cost of Heat (LCOH) analysis should be conducted in real terms not nominal. Over the past 10
years, inflation has averaged to approximately 6% p.a. in South Africa, leading to rising energy
prices in nominal terms. Real energy costs, however, fixed in Dec 2016 ZAR, present a more
descriptive picture by adjusting for inflation.
South Africa is a net importer of crude oil. According to DoE, in excess of 60% of products that
are refined in South Africa are produced from imported crude oil, while 36% is produced by
coal-to-liquid (CTL) and gas-to-liquid (GTL) synthetic fuels (Department of Energy, 2017). Costs
of diesel, paraffin, HFO, and Liquefied Petroleum Gas (LPG) are dependent on the international
oil price and the ZAR/USD exchange rate, which is particularly volatile. This exposes companies
that utilise petroleum fuels to a significant price uncertainty. As shown in Figure 4(a), the real
price for petroleum-based fuels has varied significantly about the average real value since
2006.
The Energy Information Administration (EIA) in the U.S. predicts a recovery in the oil price over
the next 20 years for the reference case, which is in line with OPEC predictions (EIA, 2017).
However, as shown in Figure 4(b), there is a significant variation between the high and low oil
price predictions, indicating significant uncertainty in future oil prices. A recovery in the oil price
and a continued depreciation of the ZAR/USD exchange rate will lead to rising real fuel prices.
Typically, industrial customers in South Africa utilise coal that is a higher calorific grade than that
which Eskom utilises. As shown in Figure 4 (a), the estimated price of industrial coal in Gauteng
of 900 ZAR/ton is now in line with Free On Board (FOB) export coal costs. As large coal
mines in the Central Basin coalfields of Witbank, Highveld and Ermelo become depleted, new
mines will have to be established in more remote areas, which could lead to rising coal prices.
Increasing fuel prices and deteriorating transport infrastructure could also further increase the
coal price for local industrial customers.
CHAPTER 1: THE MACROECONOMIC FRAMEWORK AND ENERGY POLICY IN SOUTH AFRICA I 11Figure 5
2 250
1.8 1 500 EIA high
201 USD/barrel
EIA low
1.6 200 EIA reference Industrial Estimate Range
Dec 2016 ZAR/tonne
1.4
DOE (2016) Export FOB
Dec 2016 ZAR/kWh
1.2 1 000 150
2016 USD/barrel
EIA price uncertainty
1
0.8 100
0.6 500
0.4 50
HFO Paraffin Diesel LPG DOE (2016) Local Average FOR incl.
42 USD/barrel
0.2 Eskom
0 0
2006 2008 2011 2014 2016 0 2006 2011 2016 2021 2026 2031 2036
2006 2008 2010 2012 2014 2016 2018
Figure 5
FIGURE 4: Petroleum fuel costs: (a) Historical (dashed lines indicate average) (b) Projected
international oil price
Source 4: (South African Petroleum Industry Association, 2017), (EIA, 2017)
1 500 1.8
Industrial Estimate Range
1.6
Dec 2016 ZAR/tonne
DOE (2016) Export FOB 1.4
2016 ZAR/kWh
1 000 1.2
1
0.8
Medium Voltage Connection
500 0.6
Range of modelled IRP
tariff increases
DOE (2016) Local Average FOR incl. 0.4
Eskom
0.2
0 0
2006 2008 2010 2012 2014 2016 2018 2006 2011 2016 2021 2026 2031 2036
FIGURE 5: (a) Historical local and export coal prices (b) Historical and projected electricity
prices
Source 5:(Department of Energy, 2016), (City Power Johannesburg, 2016), (CSIR, 2017)
1.8
Subsequent to rolling electricity blackouts in 2008 due to insufficient generation capacity,
1.6
Eskom began a large capacity expansion programme. As shown in Figure 4(b), this has led
1.4to rapid increases in real electricity prices. Models from the CSIR Energy Centre that served
2016 ZAR/kWh
1.2as comments to the draft Integrated Resource Plan 2016 indicate that the average price of
1electricity generation in the country will continue to increase (CSIR, 2017). The tariffs presented
0.8
in Figure 4 (b) are based on the prices for industrial customers from City Power Johannesburg,
which are higher than for Medium
Eskom Voltage direct
Connection industrial customers. The projected increases are
0.6
scaled from the CSIR model Range for predicted prices in average electricity costs. The results show
of modelled
tariff increases
IRP
0.4
that industrial customers can expect above inflation increases in electricity prices over the next
0.2
20 years.
0
2006 2011 2016 2021 2026 2031 2036
12 I SOLAR HEAT FOR INDUSTRY: SOUTH AFRICAIn 2012, the maximum natural gas price was regulated by NERSA (National Energy Regulator
of South Africa). Thus, there is limited historical data based on the new pricing methodology.
Currently, this pricing methodology is based on a blend of several energy carriers, namely: coal
(37%), diesel (24%), electricity (37%), LPG (1%) and HFO (1%) (Sasol, 2017). Therefore, rising
costs in the aforementioned energy carriers will lead to rising natural gas costs as well, which
introduces a high level of uncertainty into prices.
1.6.2 Effect of Carbon Tax
The amount of CO 2 emissions for each energy source is presented in Table 2. It should be
noted that electricity has the highest carbon intensity due to heavy reliance on nationally grid-
connected coal fired power generation in South Africa. Assuming 120 ZAR/tCO2, the costs of
electricity will increase at 0.13 ZAR/kWh above predictions. Natural gas and LPG are the least
affected by carbon tax. A summary of the key energy data is presented in Table 3.
TABLE 3: Summary of Key Energy Data
Energy price estimations Price development
Inflation (avg. index 2016)/ (avg. index 2006) 1.84
Inflation (avg. index 2016)/ (avg. index 2011) 1.31
Average inflation (2006-2016) 6.2%
Historical increases (2006-2016, excluding inflation)
Export coal (ZAR/kWh, Dec 2006-Dec 2016) + 72%
International oil price (USD/b, avg 2006- avg 2016) - 43%
Paraffin (ZAR/kWh, Dec 2006-Dec 2016) - 14%
Electricity (City Power, avg. Energy Charge) + 279%
Projections (2016-2040, excluding inflation)
International oil price (USD/b) – EIA reference + 150%
International oil price (USD/b) – EIA high + 416%
International oil price (USD/b) – EIA low - 1%
Electricity (City Power, avg. Energy Charge) – low increase based on CSIR
+ 24%
2016 draft IRP comments
Electricity (City Power, avg. Energy Charge) – high increase based on CSIR
+ 49%
2016 draft IRP comments
Increase in Input Energy Costs due to Carbon Tax
Electricity 0.13 ZAR/kWh
Coal 0.04 ZAR/kWh
Liquefied Petroleum Gas 0.03 ZAR/kWh
Source 6: Own research
CHAPTER 1: THE MACROECONOMIC FRAMEWORK AND ENERGY POLICY IN SOUTH AFRICA I 131.7 Energy Infrastructure for Industrial Facilities
Due to historically low costs, electricity and coal developed as the dominant energy carriers in
South Africa for a wide range of energy-related services. Partly because of this, South Africa
has a well-developed transmission grid that enables delivery of electricity to all major demand
centres in the country. Over 40% of all electricity generated by the national utility (Eskom) is
sold to municipalities. This indicates the important role of municipalities in terms of electricity
distribution. The cost of electricity to industrial customers varies (sometimes significantly) based
on whether the supply is from the national utility or from the relevant local municipality.
The cost of coal is strongly dependent on the transport required from mines, which are typically
located in the Mpumalanga province. Therefore, the transport costs of coal for steam boilers
in Cape Town (estimated 600-800 ZAR/ton) are significantly higher than in Gauteng (estimated
100-200 ZAR/ton). Transport by rail is one of the cheapest options for moving coal from mining
operations to destinations at industrial operations. These favourable freight costs are only
possible if industries are located in close proximity to main railway routes.
Figure 6
Musina
Core network
Louis Trichardt
MOZAMBIQUE
Lephalale Groenbult
Closed lines
Polokwane Phalaborwa
Vaalwater
Zebediela
Middelwit Steelpoort
BOTSWANA
Modimolle Marble Hall
Nelspruit
Komatipoort
Witbank
Mafikeng Kaapmuiden
Vermaas SWAZILAND
Ermelo
Ottosdal
Vryburg Vereeniging
NAMIBIA Hotazel Klerksdorp
Pudimoe
Makwassie Vrede
Kroonstad Vryheid
Nakop Sishen Warden
Veertien Strome
Upington Virginia Harrismith
Bethlehem
Kimberley Ladysmith
Kakamas
Douglas Bloemfontein Richards Bay
Belmont
Koffiefontein
LESOTHO
Pietermaritzburg
Durban
Springfontein Franklin
Harding
De Aar Aliwal North
Sakrivier
Port Shepstone
Maclear
Noupoort
Calvinia Rosmead
Hutchinson Umtata
Hofmeyer Queenstown
Beaufort West
Porterville Cookhouse
Saldanha Klipplaat Blaney East London
Prince Alfred Hamlet Alicedale
Oudtshoorn
Worcester Port Alfred
Cape Town Ngqura
Knysna Port Elizabeth Lifted lines
Mosselbaai
Branch lines
FIGURE 6: Transnet Railway Network ◊ Coal basin region
Source 7: Transnet
14 I SOLAR HEAT FOR INDUSTRY: SOUTH AFRICAProcess heating using natural gas presents a credible low-cost option for process heating.
However, the gas supply network is far from reaching the geographical footprint of the electricity,
road and rail networks. The gas network was clearly designed for delivering product from the
country’s national ports to major gas and petrochemical processing hubs particularly Secunda
(in Mpumalanga Province) that hosts many of the operations of Sasol (South Africa’s largest
petroleum and chemicals processing company). Figure 7 shows the current extent of the gas
supply network in South Africa.
Although the transmission network is mostly owned by Transnet and PetroSAa few other entities
have access to the majority of these pipelines as well. The prices for products or energy
carriers sourced from these networks are regulated by NERSA.
Since South Africa does not make use of extensive district heating networks, they are not
considered in this study. The regulated price of petroleum products is based on assigned
demarcated zones. Therefore, the costs of these fuels are typically more expensive inland due
to transportation from the refineries. However, South Africa has well developed pipelines from
the refineries to Gauteng. For example, the cost increase for inland diesel is in the order of 3.4%
over coastal regions.
Figure 7
LIMPOPO
MPUMALANGA
GAUTENG
NORTH WEST
FREE STATE
KWAZULU-NATAL
Distribution pipeline
Transmission pipeline
Petronet Lily pipeline
Rompco pipeline RSA
FIGURE 7a: Gas distribution networks in South Africa
Source 8: (SASOL, 2012) LIMPOPO
NORTH WEST
City of Tshwane
CHAPTER 1: THE MACROECONOMIC FRAMEWORK AND ENERGY POLICY IN SOUTH AFRICA I 15Distribution pipeline
Transmission pipeline
Petronet Lily pipeline
Rompco pipeline RSA
LIMPOPO
NORTH WEST
City of Tshwane
City
of MPUMALANGA
Ekurhuleni
Johannesburg
West Rand
Sedibeng
Distribution pipeline
Transmission pipeline
Province
FREE STATE
FIGURE 7b: Gas reticulation network in Gauteng (owned by Egoli Gas)
Source 8: (SASOL, 2012)
16 I SOLAR HEAT FOR INDUSTRY: SOUTH AFRICA1.8 Solar Potential
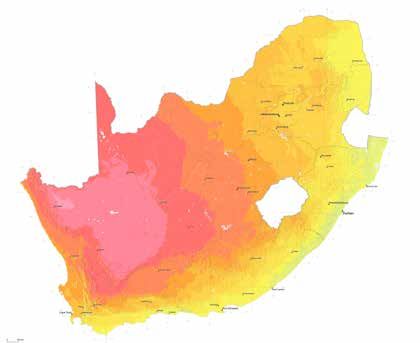
South Africa is located in the sun-belt and therefore has an extensive solar resource. Maps of
Global Horizontal Irradiation (GHI) and Direct Normal Irradiation (DNI) for South Africa are presented
in Figure 8. Manufacturing is concentrated in the Gauteng province, which is the smallest of South
Africa’s nine provinces accounting for only 1.4% of the country’s land area. The GHI values in
Gauteng exceed 2000 kWh/m 2/yr., which is a favourable solar resource compared to several
industrial plants around the world where solar systems have been implemented. An optimally
tilted, north facing, flat plate collector in Johannesburg would generate approximately 1.6 MWh th/
m 2/yr. (assuming 70% collector efficiency).
FIGURE 8A: Annual Global Horizontal Irradiation (GHI)
Source 9: The World Bank, Solar resource data: Solargis
FIGURE 8B: Direct Normal Irradiation (DNI) for South Africa
Source 10: The World Bank, Solar resource data: Solargis
CHAPTER 1: THE MACROECONOMIC FRAMEWORK AND ENERGY POLICY IN SOUTH AFRICA I 17Conclusions of the Energy and Policy Landscape in South
Africa
• South Africa’s climate policies aim at a reduction of CO 2 emissions by 42% relative
to BAU by 2025.
• A proposed carbon tax could increase the costs of fossil fuel generated energy,
though implementation steps are yet not known.
• Incentives such as accelerated depreciation (Section 12B of the Income Tax Act
of 1962), or incentives for manufacturing and agro-processing as well as energy
efficiency programmes exist and could stimulate investments in new technologies.
• Energy costs for industry vary significantly based on energy source. Local coal is
the cheapest source, whilst other sources such as gas, oil and LPG often depend
on international fuel prices and transport infrastructure. Coal in the Mpumalanga
and Gauteng regions is the cheapest energy source, LPG is the most expensive.
• Prices for coal and electricity will likely increase due to the depletion of existing
coal mines, the exploration of new coal mines and transport logistics to those
resources as well as the construction of new power generation plants.
• There is uncertainty in the future price of gas and petroleum fuels.
• The gas network will have to be extended for South Africa-wide distribution.
• South Africa has an excellent solar potential of 1.8 to 2.3 MWh/m² solar irradiation
(GHI) in major industrial areas.
18 I SOLAR HEAT FOR INDUSTRY: SOUTH AFRICACHAPTER 2
SOLAR THERMAL MARKET FOR
INDUSTRIAL PROCESSES
CHAPTER 2: SOLAR THERMAL MARKET FOR INDUSTRIAL PROCESSES I 192.1 Description of Solar Thermal Technologies for Industrial
Processes
FIGURE 9
Heat
storage
unit
Pump
Heat
storage
Heat
unit Collector
exchanger
Pump
Heat Collector
exchanger
FIGURE 9: Scheme of a SHIP plant
Source 11: Solar Payback 2017
Solar thermal collectors convert solar radiation into usable heat. SHIP is the acronym for Solar
Heat for Industrial Processes and describes systems which provide solar heat in a factory.
Figure 9 shows a SHIP plantFIGURE 10 solar collector field heats a process fluid and a heat
were the
exchanger transfers this heat to a supply a system or production process in the factory as hot
water, air flow or steam. Storage units also make it possible to use the generated heat at night-
time. Usually solar thermal energy only supports an existing heating process and is optimized
FIGURE 10
according to the demand at times of maximum irradiation, especially during the summer.
SOLAR
HEATED WATER
EVACUATED TUBE
COLLECTOR
HOT WATER
INDUSTRIAL FLOW
PROCESS BOILER
FUEL
HOT WATER RETURN HOT WATER RETURN
Example of a solar system which supplies heat directly to an industrial process
SOLAR IRENA [8]
FIGURE 10: Simplified illustration of process heat circle
HEATED WATER
Source 12: Solar Payback 2017, IRENA
EVACUATED TUBE
COLLECTOR
20 I SOLAR HEAT FOR INDUSTRY: SOUTH AFRICA H
INDUSTRIALExposed to the sun, the collector heats up a heat transfer liquid (either hot air, water, water
with glycol for frost protection or thermo oil). The collectors are connected to the production
process or to a storage tank, either directly or via a heat exchanger. Electric pumps move the
heat transfer liquid within the solar circle.
There are a number of collector technologies available on the market that supply heat at different
temperature levels and can, therefore, be used in different processes. They can be classified
in stationary and concentrating collectors.
Stationary collectors are orientated towards the sun on fixed racks. They can be unglazed,
air, flat plate, and evacuated tube collectors.
Concentrating collectors work on the principle of reflecting and concentrating direct solar
radiation at its focus (a point or line), thereby using the concentrated solar radiation as a high
temperature thermal energy source to produce process heat. The mirror elements that reflect
and concentrate solar radiation vary in geometry and size. To facilitate concentration of direct
normal irradiation (DNI), the mirrors need to be continuously tracked following the path of the
sun in single or two-axes.
Fresnel and parabolic trough collectors are 1-axis tracking systems. Concentrating dish
collectors are mostly 2 axis tracking solutions. Thus, they make sense in areas with a lot of
direct solar irradiation. They can generate heat with temperatures of up to 400°C and even
higher for electricity production and can be operated by pressurized water or thermal oil.
CHAPTER 2: SOLAR THERMAL MARKET FOR INDUSTRIAL PROCESSES I 21TABLE 4: Overview of collector types for solar process heat generation
Source 13: Own research
Air collector
Air collectors use air to transport heat. Various types of air collectors either use glazed,
unglazed or vacuum tubes to collect usable heat. They either rely on natural convection
or use fans to transport the air via a well-insulated tube system. In industrial processes
air collectors are well suited to drying processes providing hot air at between 20 to
70°C.
Photo: Grammer
Flat plate collector
Flat plate collectors use water to transport heat to the heat exchanger, the storage
tank or the production process. They consist of an insulated case containing a
metallic absorber which has an absorber sheet and a piping system below to transport
the heat. The casing is covered with a single or double glass plate alternatively
antireflective coated to reduce transmission losses. They achieve operating
temperatures between 30 and 90°C and are produced in many countries. For solar
process heat applications, usually large-scale collectors are used. Evacuated flat plate Photo: E3 Energy group
collectors can supply even higher temperatures due to reduced convection losses.
Evacuated tube collector
Evacuated tube collectors use vacuum as an insulation to protect the absorber from
the environment. Double-glass evacuated tube collectors consist of two tubes which
are evacuated between them; single-glass evacuated tube collectors consist of one
evacuated tube. With direct flow types the heat transfer liquid flows through the tube.
With so-called heat pipe or U-pipe collectors a separated circuit inside the tube
transports the heat collected to the top of the tube. Inside the header the energy is
transferred to the heating circuit.
Photo: Himin
To improve efficiency, some types of evacuated tube collectors are equipped
with a reflective metal sheet behind the tubes that are called compound parabolic
concentrators (CPC). Evacuated tube collectors can deliver temperatures between 50
and 150°C.
Parabolic Trough Collectors
In parabolic trough collectors bent mirrors reflect the sunlight to the receiver tubes.
The mirrors or troughs are mostly aligned on a north-south axis and rotates from east
to west to track the sun along its daily path. Temperatures of up to 400°C can be
produced and direct steam generation is possible. The temperature level depends on
the size of the parabolic trough and the evacuation of the receiver tube.
Photo: Amul Fed Dairy
Linear Fresnel Collectors
Fresnel collectors concentrate the sun with several flat mirrors that track the sunlight
on one axis onto a central receiver tube. The single mirrors are easy to replace and the
exposure to wind is only minimal. There are Fresnel collectors that have a secondary
mirror that is placed above the receiver tube to reflect light back down to the absorber.
Temperatures of up to 400°C can be produced and direct steam generation is
possible.
Photo: Industrial Solar
Concentrating Dish Collector
Parabolic Dishes concentrate solar irradiation on one spot and produce high
temperatures up to 400°C depending on the size of the mirror field and the evacuation
of the receiver tube. Examples are Scheffler dishes used for cooking in India. The
tracking via two axes requires a high level of precision.
Photo: ARS Glasstech
22 I SOLAR HEAT FOR INDUSTRY: SOUTH AFRICA2.2 Temperature Ranges
Industrial process temperatures typically vary according to the respective production process.
They are classified into three ranges (see Figure 11): first below 150°C (called low temperature),
a second range of 150°C to 400°C (medium temperature) and above 400°C (high temperature).
Many industrial processes in the chemical, food and beverage, machinery, mining, textile, and
wood industry use temperatures that can be easily generated with solar thermal technologies
either as hot water or steam. Since fixed costs dominate the overall cost structure of solar
thermal energy, processes that have a summer peak load as well as those that can be applied
all year long are of special interest for the use of solar thermal applications. Economics improve,
the higher the costs for competing energy sources are.
Which solar thermal collector type is used depends greatly on the temperature level required.
In some applications, e.g. for washing or drying processes, only a low temperature of about
50°C is needed. For this temperature mainly, flat plate collectors or air collectors are used.
Numerous industrial processes require temperature levels up to 95°C. Both evacuated tube
collectors and improved flat plate collectors are able to provide this temperature level with a
very good efficiency. Higher temperature levels can be reached if vacuum is used for insulation,
either evacuated flat plate or evacuated tube collectors are collector types which are used with
FIGURE 11
industrial applications up to 150°C.
Above approximately 140℃ the solar radiation must be concentrated. The higher concentration
factors of parabolic trough, linear Fresnel collectors or concentrating dish systems provide
operating temperatures up to 400°C. For most applications more than one collector type could
be used. The criteria are available space, economics, and location among others.
INDUSTRY LOW MEDIUM HIGH
Below 150 ºC 150 to 400 ºC > 400 ºC
Chemical • Boiling • Distilling
Food and • Drying • Boiling
beverage • Pasteurising • Sterilising
Machinery • Cleaning • Drying
Mining • Nitrate melting
• Mineral drying processes
Textile • Washing • Bleaching • Dyeing
Wood • Steaming • Pickling • Compression • Drying
• Cooking
100 ºC 150 ºC 250 ºC 350 ºC
Flat plate
Evacuated tube
Evacuated tube CPC
Small parabolic trough
Evacuated flat plate / linear Fresnel
without evacuated receiver
Large parabolic trough
Concentrating dish / linear Fresnel
with evacuated receiver
FIGURE 11: Collector temperature ranges, applications and technologies
Source 14: Solar Payback 2017, IEA/SHC 2012-2016
CHAPTER 2: SOLAR THERMAL MARKET FOR INDUSTRIAL PROCESSES I 232.3 Local Solar Thermal Technologies
2.3.1 Solar Thermal Industry Overview and Players
This section outlines the identified companies that are active in the solar thermal industry in
South Africa. The notable players are described below along with significant projects. According
to Joubert et. al (2016) there are 89 large scale solar thermal systems in South Africa, where
the collector area exceeds 10 m 2. However, the dominant applications are for hot water supply
(domestic and staff ablutions account for 80 systems). Currently, only 7% of the installed
collector area is for industrial process heating and 4 % for industrial cooling.
Solar Heat Exchangers: installs solar water heating, heat pumps, swimming pool heating
and underfloor heating. Significant projects include a 540 m 2 flat plate solar collector system
installed at Anglo Platinum in Brakfontein and a 1220 m 2 flat plat solar collector installed in
Twistdraai, Secunda.
Holms and Friends: provides consulting and design services, including component selection,
for solar water heating systems. Notable projects include a 612 m 2 system with vented storage
at University of Pretoria’s Prinshof student residences a similar 812 m 2 system installed at the
Boekenhout and Olienhout residences.
KAYEMA Energy Solutions: designed and installed a 200 m 2 solar thermal system at the
Standard Bank building in Braamfontein. The system is a hybrid system using solar thermal,
heat pump and electrical technologies. It is one of the largest of its kind in Southern Africa.
GENERGY: is an EPC (Engineering, Procurement, Construction) company. This company has
a portfolio of hot water production plants as well as rooftop photovoltaic projects. Notable
projects include a 504 m 2 evacuated tube collector system installed at Xtrata Elands Mine and
a 390 m 2 flat plat panel collector system installed at the BHP Billiton Wolwekrans colliery.
REACH Renewable: has designed and installed the first industrial size Linear Fresnel system
providing a solar cooling system for the telecommunication industry. This system was installed
at the MTN Headquarters Datacentre in Roodepoort, Johannesburg. REACH provides solar
heating, air conditioning and power generation solutions offering consulting, design, import and
implementation services.
GREENCON: is a company belonging to HBC Group. This company was responsible for
installing a 200 m 2 flat plate solar collector system at the BMW manufacturing plant in Rosslyn,
north of Pretoria. The water that is heated by the system is used to achieve optimum temperatures
for the paint application process.
SOLARZONE: provides a range of services including solar water heating, heat pumps,
solar cooling and underfloor heating. This company installed a 720 m 2 array of flat plate solar
collectors at Ceres Correctional Prison in the Cape. The system is complete with 50 000 litres
of water storage and saves the prison 617 580 kWh in energy for hot water annually.
SONNENKRAFT SA: is an international company with presence in South Africa supplying
solar energy equipment. Sonnenkraft SA successfully designed and installed a 22 000 litre
solar system with 322 m 2 of flat plate solar collectors (Blackdot Energy, 2016).
24 I SOLAR HEAT FOR INDUSTRY: SOUTH AFRICAE3 Energy: this group of companies provides engineering, project execution and finance for
the renewable energy industry. They focus on heating cooling and power. In 2015 they won a
tender to install a 120m 2 solar water heating system at Cape Brewing Company (CBC) in the
Western Cape (E3 Energy , 2017).
BBEnergy: known as BBE, is a power and energy management company. The company
has constructed South Africa’s first locally developed linear Fresnel demonstration plant at
its premises in Johannesburg. In 2012 BBE obtained approval and funding from Eskom to
construct similar systems at Gold Fields and AngloGold Ashanti mines as part of Eskom’s
budget for Integrated Demand Management (BIZCO Business Consulting, 2012).
2.3.2 South Africa Specific Information
Most of the companies described in the previous section perform Engineering, Procurement
and Construction (EPC). Thus, project planning and implementation is all done in-house and
turn-key solutions are provided. Hardware and components are procured by these companies
from multiple manufactures both locally and abroad. Thus, a client seeking to implement a solar
solution does not need to be concerned with several specific manufacturers because the EPC
contractor will design a system and provide a bill of quantities with components from specific
manufacturers.
Manufacturers and distributers of solar system hardware and components are distributed
worldwide. Secon, based in the UK, distributes products from Resol, PAW and Solarmetaflex
which have been used for South African projects. Sonnenkraft, an international company with
South African presence, manufactures and distributes its own range of collectors, heat pumps,
tanks and other components and hardware needed in solar thermal projects. The company’s
products have been used in a number of local projects.
The main two components of solar water heaters, the collectors and the geysers, are generally
manufactured by separate companies in South Africa. There are very few, if any, local
manufacturers that manufacture complete factory-made systems comprising of all components.
Thus, it is the norm in South Africa for components to be sourced separately and combined into
integrated systems by EPCs on site (Hertzog, 2012).
2.3.3 Cost of large Scale Solar Thermal Projects
The total cost of large solar thermal projects is somewhat dependent on the collector gross
area, with a larger area achieving a lower cost per square meter of collector area. An analysis of
South African projects up to 2016 has shown that the price of such systems ranges between
EUR 400-800 per square meter of collector area. A trend-line and equation has been fitted to
this data indicating the dependence of the price on collector gross area. As shown in Figure 12
there is a wide variation in plant costs even for similar collector areas.
CHAPTER 2: SOLAR THERMAL MARKET FOR INDUSTRIAL PROCESSES I 251 400
1 200
y=-0.41x+770.34
Specific system cost [EUR/m2] 1 000
800
600
400
200
0
0 100 200 300 400 500 600 700 800 900 1 000
Gross collector area [m2]
FIGURE 12: Estimated system costs
Source 15: (Joubert, Hess, & Van Niekerk, 2016)
2.3.4 Quality Standards, Certification and Norms
The local norm in South Africa is to manufacture solar water heating components separately,
in opposition to complete factory-made systems. Therefore, it is the South African practice to
ensure that quality standards are met through component testing rather than international practice
of system testing (Hertzog, 2012).
In light of this component testing approach, the SABS has a product services department that
offers a scheme for solar water heating component manufacturers to obtain a qualification
certificate. This scheme enables the industry to demonstrate compliance through independent
qualification. Related certifications for this qualification certificate include the following:
• ISO 9806-2:1995 – Test methods for solar collectors -- Part 2: Qualification test procedures
• ISO 9806-3:1995 – Test methods for solar collectors -- Part 3: Thermal performance of
unglazed liquid heating collectors (sensible heat transfer only) including pressure drop
• ISO/TR 10217:1989 – Solar energy -- Water heating systems -- Guide to material selection
with regard to internal corrosion
A more comprehensive list may be obtained from the SABS website https://www.sabs.co.za/
Sectors-and-Services/Sectors/Solar/solar_ac.asp (SABS, 2017).
The qualifications and certification of solar thermal installers in South Africa is based on the
National Qualifications Framework (NQF) by the South African Qualifications Authority (SAQA).
There are two standards that are applicable to installers for certification:
• SANS 10106:2006 - The installation, maintenance, repair and replacement of domestic solar
water heating systems
• SANS 10254:2004: The installation, maintenance, replacement and repair of fixed electric
storage water heating systems (Global Solar Water Heating Market Transformation and
Strengthening Initiative, 2012)
In addition to these standards, the SABS provides a range of standards that are relevant to the
solar water heating industry which include standards concerning quality management systems,
test methods for specific materials and parts, qualification tests for mechanical parts, testing of
thermal performance. A list of these standards can be obtained from the SABS website https://
www.sabs.co.za/Sectors-and-Services/Sectors/Solar/solar_sp.asp (SABS, 2017).
26 I SOLAR HEAT FOR INDUSTRY: SOUTH AFRICAYou can also read