ELECTRIC LONG-RANGE PLAN 2019 - 2038 - January 2019 - Con Edison
←
→
Page content transcription
If your browser does not render page correctly, please read the page content below
ELECTRIC
LONG-RANGE PLAN
2019 - 2038

January 2019
1

Note

This document and the statements and analysis contained within are based on the information available as of
2018.

© Consolidated Edison Company of New York, Inc. All Rights Reserved

                                    © Consolidated Edison Company of New York
2
Table of Contents

1.0    Executive Summary........................................................................................................................... 3
2.0    Background ....................................................................................................................................... 6
       Service Territory ...................................................................................................................................... 6
       Electric System ........................................................................................................................................ 6
3.0    Electric Long-Range Plan Process ...................................................................................................... 8
4.0    Industry Trends ................................................................................................................................. 10
       Technology ..............................................................................................................................................10
       Policy .......................................................................................................................................................15
       Customer Expectations ...........................................................................................................................17
5.0    Demand, Volume, and Supply Forecasts ........................................................................................... 19
       Long-Term Electric Peak Demand System-Level Forecast....................................................................... 19
       Long-Term Electric Volume Forecast ...................................................................................................... 21
       Supply Outlook ........................................................................................................................................ 22
6.0    Strategy ............................................................................................................................................ 24
       Improving Public and Employee Safety ................................................................................................... 24
       Achieving Operational Excellence ........................................................................................................... 24
       Enhancing Customer Experience ............................................................................................................. 25
7.0    Planning for New Capabilities ........................................................................................................... 27
       Grid Modernization ................................................................................................................................. 28
       Customer Engagement ............................................................................................................................ 36
       Rate Redesign .......................................................................................................................................... 42
8.0    Clean Energy Grid Planning ............................................................................................................... 44
       Energy Efficiency ..................................................................................................................................... 44
       Transmission ........................................................................................................................................... 46
       Energy Storage ........................................................................................................................................ 47
       Electrification of Transportation ............................................................................................................. 49
9.0    Core Infrastructure Planning ............................................................................................................. 50
       Risk Management.................................................................................................................................... 50
       Asset Management ................................................................................................................................. 53
       System Expansion .................................................................................................................................... 56
       New Business .......................................................................................................................................... 58
       Other ....................................................................................................................................................... 59
10.0   Continued Focus on Cost Management ............................................................................................. 60
       Capital Optimization................................................................................................................................ 60
       Bill Impact................................................................................................................................................ 60
11.0   Planning Uncertainties ...................................................................................................................... 64
12.0   Conclusion ........................................................................................................................................ 66
       Glossary of Acronyms ....................................................................................................................... 67

                                                      © Consolidated Edison Company of New York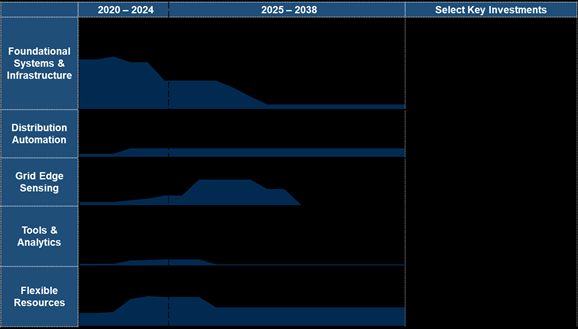
3
1. Executive Summary

   Consolidated Edison Company of New York (CECONY) energizes the lives of more than 9.5 million people
   across the New York City metropolitan area. New York’s economy and residents depend on safe, reliable,
   resilient, and secure energy. The energy industry is undergoing dramatic change due to developments in
   technology, government policy, and customer expectations that will change the way energy is supplied and
   consumed. These changes will require us to build, operate, and maintain the grid differently going forward.
   Our long-range plan outlines how we are designing and investing in our electric grid to create a sustainable
   energy future.
   Technological innovation will impact the energy industry in several key ways. In addition to a majority of the
   electricity consumed by our customers being supplied by renewable generation, we anticipate that many
   customers will install distributed energy resources (DERs) that will significantly change how energy is supplied.
   Transportation systems will increasingly rely on the grid as their primary source of energy. Improvements in
   data analytics and communications will also change the way energy is consumed by giving consumers greater
   control over energy use and costs.
   Energy policy trends increasingly include ambitious clean energy, emissions-reduction, and consumption
   related goals, with regulators looking to utilities as integral partners in achieving those objectives. Resilience
   and security also remain important to policymakers. As more frequent severe storms damage infrastructure
   and cause extended outages, utilities are expected to keep pace through resiliency investments.
   Customers continue to value the comfort and convenience provided by utility delivered energy. They are
   making greater use of apps, social media, and constant connectivity and so they expect a greater degree of
   control, personalized products and services, and the ability to interact with companies via a variety of
   interfaces. We anticipate a greater demand for choice in rate plans, energy sources, and a stronger desire to
   adopt DERs and integrate energy with other home services.
   As these trends change the energy landscape, we will respond by transforming the grid from a one-way
   delivery system into a two-way platform while maintaining safety, reliability, resiliency, and security. We are
   committed to being a next-generation clean energy company and will also make the necessary investments to
   support policy goals. Our long-range plan outlines how we will achieve these objectives through our core
   strategic priorities of safety, operational excellence, and customer experience.
   Nothing is more important than our first strategic priority: the safety of the public we serve and our employees
   and contractors. We seek to prevent events before they occur, detect events that are in the process of
   occurring, and effectively respond to events that have occurred in order to minimize their impact and quickly
   restore our systems to normal. For example, we currently perform industry leading safety surveys of our entire
   electric system. We also have an extensive network of sensors that provide real-time information about the
   health of our underground transformer fleet. Continuing these efforts, our long-range plan includes
   investments specifically focused on keeping customers, employees, and contractors safe over the next 20
   years.

                                          © Consolidated Edison Company of New York
4
Our strategic priority to enhance our customers’ experience emphasizes a customer-first mentality. We seek to
meet customer expectations in all areas, and we look for opportunities to exceed those expectations whenever
possible.
During the early years of our long-range plan, we will install over 4.5 million smart meters. Those meters will
serve as the backbone of future digital advances for our energy systems. Information from smart meters will
help customers reduce energy use and save money, while also enabling us to operate the grid more efficiently,
more easily integrate energy produced within the distribution system, and cut operating costs.
Our investments in information technology will improve our customer’s experience, making it easier to report
outages, analyze energy use, receive bill alerts, and interact with us via live chat and smart phones. These
investments will also help customers adopt DERs such as rooftop solar and energy storage. Thus far we have
connected more than 24,000 private solar projects to our grid. A new initiative to install solar panels on
CECONY facilities will allow approximately 1,000 low-income electric customers to participate in local
renewable projects and benefit from cleaner energy options and reduced costs. Our long-range plan continues
investments to support this momentum and we expect nearly one gigawatt (1,000 MW) of solar connected to
our grid over the next 20 years.
Since 2009, our energy efficiency programs have helped prevent about 1.4 million tons of carbon emissions,
equal to removing almost 300,000 vehicles from New York streets. Over the next ten years, accelerating our
energy efficiency investments will result in over three times the energy savings of the previous ten years. This
will help customers lower costs and reduce emissions to advance New York State and New York City clean-
energy goals. These investments include programs that facilitate the installation of energy-efficient systems
and allow sharing of usage data to help optimize energy consumption and usage technology to provide greater
convenience and control over energy use and costs.
Our third strategic priority, excellence in operations, recognizes that we are constantly striving to make our
business better. We continue to develop our employee’s knowledge and skills, to incorporate new
technologies that improve our work processes, and to invest in new technologies and equipment that position
us to continue to safely and reliably provide energy to our customers.
Our plans include investments to modernize our grid, transforming it into a distributed system platform that
integrates DERs and providing the infrastructure needed for a reliable, cleaner, and more sustainable energy
future. Our planned investments include sensing technology that provides more situational awareness of the
electric system; advanced communications infrastructure; advanced data analytics; and advanced
management systems.
We are already preparing for a future that includes more diverse energy sources. We used energy efficiency,
energy storage, and other DERs in our industry leading Brooklyn Queens Demand Management (BQDM)
Program where we deferred installation of $1 billion in traditional infrastructure investments, including a
substation, and we are now developing additional non-wires projects. We are also responsible for New York
City’s largest solar installation in the Brooklyn Navy Yard.
© Consolidated Edison Company of New York5
We expect over one million electric vehicles within our service territory over the next 20 years and our long-
range plan includes investments in grid infrastructure that will supply energy to vehicle-charging stations. This
grid enhancement will help New York State meet its goals for electric-vehicle deployment. We have also begun
several programs that lower the cost of charging infrastructure, and we offer financial incentives for electric-
vehicle owners to charge at off-peak times, thereby reducing stress on the grid.
Since we know renewables are more reliable when paired with energy storage, our long-range plan includes
investments to support energy storage policy goals. We have identified locations at our facilities where energy
storage may be able to complement our traditional utility infrastructure, and we are working with third parties
on several energy storage projects to test new business models and explore the use of storage in non-wires
applications.
In addition to investing in reliability, our plans include resiliency investments to meet the challenges of
extreme weather and climate change. These investments will reduce disruptions during extreme weather
events and speed service restoration to those customers who are interrupted during such events. We have
also launched a study to assess the future impact of climate change on our systems and identify strategies to
adapt.
The energy sector has also seen an increase in cyber threats. In addition to working with industry peers, and
government and law enforcement agencies, our plans include investments to protect our assets, detect
intrusions, and respond and recover from incidents.
As we execute our long-range plan, we remain aware of the impact of energy costs on our customers, and we
actively work to limit increases to customer bills. To that end, we are taking an aggressive approach to identify
technologies, process improvements, and capital investments that reduce our overall operations and
maintenance costs.
Planning is an ongoing activity and so we have reflected the uncertainties in our planning assumptions by
ongoing studies that consider alternative outcomes. Our primary “planning case,” outlined in this document,
assumes the need to integrate significant amounts of DERs into the grid while maintaining reliability, resiliency
and security. It also includes support for policy targets articulated in current State and City energy plans. We
are participating in studies that identify potential pathways for achieving New York City’s and New York State’s
goal of reducing greenhouse gas (GHG) emission levels 40% by 2030 and 80% by 2050. These studies examine
achieving the GHG-reduction goals by increasing energy efficiency, renewable electric generation, and
electrification of transportation and heating.
As the energy business transforms, we are thinking and planning ahead by focusing on our three priorities—
keeping employees and the public safe, enhancing the customer experience, and achieving excellence in
operations. Drawing on our resources, talent, vision and long-range plan, CECONY will support a clean,
resilient, safe, economically prosperous, and sustainable future for New York City and Westchester County.
© Consolidated Edison Company of New York6
2. Background
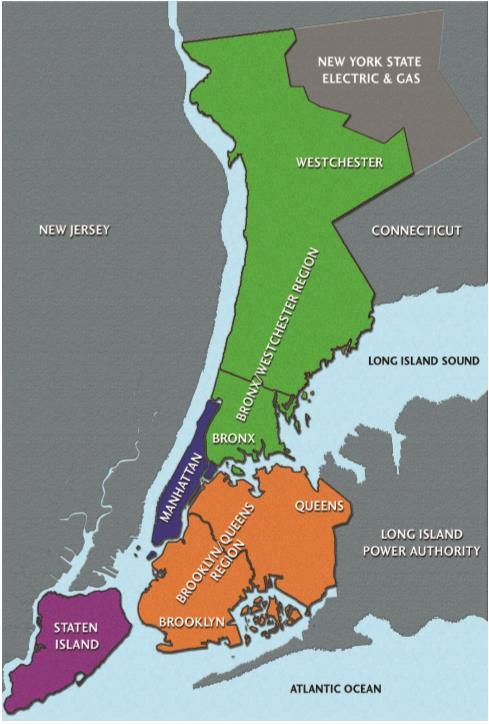
Service Territory
CECONY’s electric, gas, and steam systems deliver energy to one of the most dynamic and exciting urban and
suburban financial capitals of the world. CECONY’s electric system safely and reliably serves 3.4 million
customers in the five boroughs of New York City and Westchester County (see Figure 2-1), an area that is home
to over 9.5 million people.1
Figure 2-1: CECONY service territory
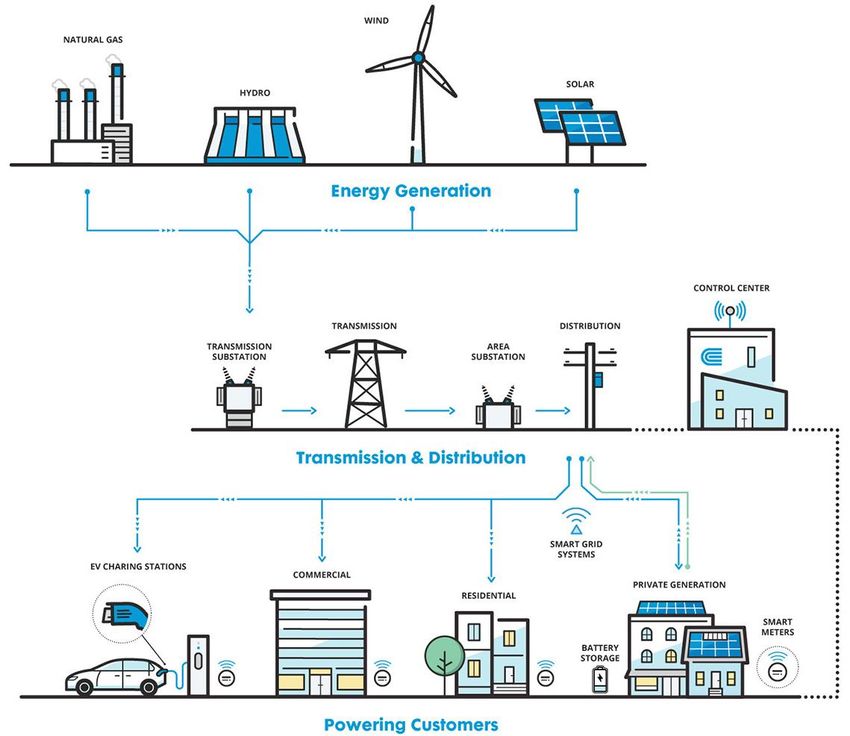
Electric System
The electric system, or “grid,” is a delivery system that connects energy sources with customers. Most
electricity consumed by our customers is still produced by large third-party generating stations and delivered
via CECONY’s transmission and distribution network.2
1
US Census Bureau (2016), https://www.census.gov.
2
CECONY owns less than 5% of the generation assets supplying its customers. All CECONY-owned generation assets are
associated with the Company’s steam system; the remaining 95% of generation assets are owned and operated by market
suppliers.
© Consolidated Edison Company of New York7
CECONY’s transmission infrastructure delivers energy from generating stations to transmission substations.
CECONY solely or jointly owns a network of overhead transmission lines and operates the largest underground
transmission system in the United States. Transmission substations route power to individual area substations,
which then provide power to the overhead and underground distribution system that directly serves our
customers. It is in the distribution system where most evolving utility and customer-sited technologies—like
distributed energy resources (DERs), smart meters, and sensors—are integrated into the grid.
The basic elements of the Company’s electric system are illustrated in Figure 2-2.
Figure 2-2: Elements of the electric system
© Consolidated Edison Company of New York3. Electric Long-Range 8
Plan Process
This Electric System Long-Range Plan (ELRP) provides a transparent look at CECONY’s detailed planning
process, which guides our efforts to translate our corporate vision into a specific, concrete plan of action for
the coming 20 years.
Vision
In a future where electricity will be critical to a prosperous New York City and Westchester County economy
and population, the CECONY corporate vision is to be a premier provider of safe, reliable, clean, innovative,
and cost-effective energy services and solutions that enhance the lives of our customers.
To realize this vision, our ELRP responds to the shifting energy landscape and provides a strategic roadmap
that guides our plans for investments and programs over the next 20 years.
Plan
In developing this ELRP, we seek to answer the following questions:
• What are the key industry trends impacting electricity consumption?
• What value should we deliver to customers based on these trends and what is our strategy for
delivering this value?
• What investments are needed to deliver this value?
• How will these investments impact our customers’ bills?
The sequence and content of the ELRP’s chapters track the Company’s broader planning process, which is
illustrated in Figure 3-1.
Figure 3-1: ELRP Capital Planning Process
© Consolidated Edison Company of New York9
Our success in defining and executing this ELRP depends on a strong partnership with our customers,
regulators, policy stakeholders, employees, and other stakeholders. As we advance towards our energy future,
we will take a collaborative approach that captures multiple points of view.
© Consolidated Edison Company of New York10
4. Industry Trends
The electric power industry is in the early stages of a significant transformation. We expect that by 2038, the
electric usage and supply landscape will look very different than it does today, primarily because of three
trends: technology improvements, policy goals, and customer expectations.
Technological improvements are making new grid capabilities—like distributed energy resources (DERs), grid
automation, and asset monitoring—ever more economically viable and prevalent. Government policies, like
New York State’s Reforming the Energy Vision (REV), are changing our business model and our region’s energy
mix. Further, a focus on clean energy (i.e., renewable portfolio standards, energy efficiency, and greenhouse
gas reduction goals) will require new energy demand and supply solutions. Finally, new customer expectations
of more control, convenience, and choice are changing our customer relationships.
These trends, and their implications for our business, inform our long-range planning process. The ELRP
describes our strategy for identifying investments that are needed in an evolving energy landscape. In the
planning sections of the ELRP, sections 7-9, we detail the planned infrastructure investments that address
these trends.
Technology
The energy landscape will be impacted by several key technological innovations, including demand
management, solar photovoltaic, energy storage, electric vehicles (EVs), data and analytics, and
electrification of space-heating. In each area, we expect technological innovation to significantly shape public
policy and customer expectations, which will in turn change the energy industry. In particular, we expect that
these innovations will change how electricity is generated and used, advance clean energy goals, improve
grid resiliency, and defer traditional transmission and distribution infrastructure investments to meet
growing energy demand.
Demand Management
Demand management encompasses both energy efficiency (EE), which continuously reduces demand, and
demand response (DR), which is used to reduce demand at peak times.
Energy efficiency technologies include advanced building insulation, more efficient appliances/lighting, and
smarter energy management systems. As these technologies continue to proliferate and become more
affordable, we expect our customers to take advantage of opportunities to save money by reducing their
energy use.
Because they reduce overall energy usage, energy efficient technologies have the potential to reduce
greenhouse gas emissions and defer the need for transmission and distribution infrastructure investments.
CECONY forecasts that we will experience greater energy savings in the coming years. As shown in Figure 4-1,
CECONY projects 11 TWh cumulative energy savings—approximately 20% of 2017 sales—in our service territory
over the next 20 years. This forecast aligns with New York State’s energy efficiency target of 3% of sales by 2025.
© Consolidated Edison Company of New York11
Figure 4-1: Cumulative energy efficiency forecasts for CECONY territory3
12
Cumulative energy efficiency (TWh)
8
4
0
2018 2023 2028 2033 2038
CECONY ELRP forecast Forecast 1 Forecast 2
Solar Photovoltaic
Solar photovoltaic (PV) is fast becoming a more prevalent source of renewable generation on electric grids.
Solar PV has gained significant traction not only at utility scale, but also in residential installations in the form
of distributed generation (DG).
Solar PV growth will be driven primarily by reduction in the costs and increased efficiencies of solar modules.
In addition, the cost of inverters and the balance of systems is also expected to decline.
Solar PV offers key benefits: it can reduce greenhouse gas emissions, it can be used as part of a portfolio to
offset the need for transmission and distribution infrastructure investments, and when paired with storage, it
complements back-up generation systems that could provide resiliency.
CECONY expects that solar PV will continue to proliferate. As shown in Figure 4-2, CECONY estimates that by
2038, distributed solar PV installed capacity in our service territory will increase from today’s 250 MW to
nearly 1000 MW.
3
Forecast sources include New York Independent System Operator (NYISO) Gold Book, https://www.nyiso.com/library;
IHS Markit, https://global.ihs.com; and Bloomberg New Energy Finance, https://about.bnef.com.
© Consolidated Edison Company of New York12
Figure 4-2: Behind-the-meter solar PV capacity forecasts for CECONY territory4
1500
Solar PV installed capacity (MW)
1200
900
600
300
0
2018 2023 2028 2033 2038
CECONY ELRP forecast Forecast 1 Forecast 2
Energy Storage
Energy storage technology allows energy to be stored for later use. Energy storage offers key benefits: it can
improve grid efficiency, help balance the intermittency of renewables, defer transmission and distribution
investments, provide supply capacity, and reduce the need to operate carbon-producing peaking generators.
Pumped hydro storage remains the principal method of storing energy, making up 90% of New York’s current
storage capacity. Other energy storage technologies with different storage and duration capabilities—such as
batteries, flywheels, and compressed air—are also already in use.
Lithium-ion batteries have recently emerged as an especially promising energy storage technology. Given their
flexibility, accessibility, and declining module costs, lithium-ion batteries have recently emerged as the energy
storage technology of choice for most projects, at both the utility and residential scales.
As shown in Figure 4-3, CECONY forecasts as much as 1,400 MW of battery storage in our service territory by
2038. This forecast is aligned with New York State’s storage goals of 1,500 MW by 2025 and 3,000 MW by
2030.
4
Forecast sources include New York Independent System Operator (NYISO) Gold Book, https://www.nyiso.com/library;
IHS Markit, https://global.ihs.com; and Bloomberg New Energy Finance, https://about.bnef.com.
© Consolidated Edison Company of New York13
Figure 4-3: Cumulative battery storage capacity forecasts for CECONY territory5
1500
Battery storage installed capacity (MW)
1200
900
600
300
0
2018 2023 2028 2033 2038
CECONY ELRP forecast Forecast 1 Forecast 2
Electric Vehicles
Plug-in electric vehicles (PEVs) are rapidly spreading as a cleaner substitute for internal combustion engine
(ICE) vehicles in the residential market. PEVs are already viable in the commercial market for certain uses, such
as short-range commercial delivery. PEVs fall into two categories: battery electric vehicles (BEV) and plug-in
hybrid electric vehicles (PHEV).
As battery technology costs decline, PEV driving ranges increase, and EV-charging infrastructure is further
integrated into the grid, electric vehicles will likely be adopted more broadly for both personal and commercial
use.
As shown in Figure 4-4, CECONY estimates that approximately 1.1M additional EVs will be in use in our service
territory by 2038. This forecast aligns with New York State’s Zero Emission Vehicle (ZEV) mandate.
5
Forecast sources include New York Independent System Operator (NYISO) Gold Book, https://www.nyiso.com/library;
IHS Markit, https://global.ihs.com; and Bloomberg New Energy Finance, https://about.bnef.com.
© Consolidated Edison Company of New York14
Figure 4-4: Cumulative EV adoption forecasts for CECONY territory6
2,500
2,000
# of EVs (thousands)
1,500
1,000
500
0
2018 2023 2028 2033 2038
CECONY ELRP forecast Forecast 1 Forecast 2
Data and Analytics
Information technology has long supported CECONY’s transactional needs, like billing, payroll, inventory, and
work management. A new wave of operating improvements is now being enabled by emerging digital
technologies, including analytics, mobility, cloud, computational processing, and machine learning. These
emerging technologies improve operational performance and provide both utilities and customers with more
detailed, granular data on energy usage.
One of the key emerging technologies that will change the utility industry is advanced metering infrastructure
(AMI), a system that combines smart meters, next generation communications, grid-edge computing, 7 and
information technology to give customers greater control over their energy usage and costs. AMI also provides
utilities with detailed data that enables them to better monitor and control transmission and distribution
systems, prioritize operational work, and use assets more effectively.
Per CECONY’s AMI business plan, approved in 2016, the Company has already begun deploying AMI.
6
Forecast sources include New York Independent System Operator (NYISO) Gold Book, https://www.nyiso.com/library;
IHS Markit, https://global.ihs.com; and Bloomberg New Energy Finance, https://about.bnef.com.
7
The grid-edge refers to the parts of the electric system closest to end-use customers.
© Consolidated Edison Company of New York15
Building Electrification
Currently a significant portion of greenhouse gas (GHG) emissions in the CECONY territory come from heating
and other building end-uses that rely on oil- or propane-fueled equipment. Converting these non-electric end-
uses—notably, heating systems—to cleaner, more renewable electricity presents a significant opportunity to
reduce GHG emissions.
Building electrification refers to the process of converting these non-electric end-uses to electric solutions. The
most significant opportunity for building electrification is the use of heat-pump systems, which use electricity
to efficiently move heat from the outdoors into the customer’s building, to replace traditional emissions-
producing equipment. If supplied by renewables, this growing electric solution provides a cleaner source for
both space heating and water heating.
Opportunities to offer programs that promote the use of electric heat pumps may arise, especially for
customers that currently use oil or propane-fueled heating equipment or can reduce peak gas usage.
Electrification of these end-uses will likely have a significant impact on peak demand and could increase winter
electric usage to the point where the system peak shifts from the summer to the winter.
Policy
Energy is central to many of the current environmental, economic, and security debates occurring at all levels
of government. Policymakers are focused on clean energy, safety, reliable service, and affordability. These
goals are driving energy policy changes in several areas, including climate change and clean energy targets;
performance-based regulations; and standards for resiliency and security. Below we summarize current and
anticipated policy changes in each area and explain how we expect these changes to help drive greenhouse-
gas reductions, transform the utility business model, and enable new utility investments.
Climate Change and Clean Energy Targets
As climate change threats continue to grow, New York State and New York City are pursuing ambitious
environmental goals. As shown in Table 4-5, both the city and state have committed to achieving a 40%
reduction in GHG emissions by 2030 (referred to as 40x30) and an 80% reduction by 2050 (80x50). As part of
this commitment, both governments support the Clean Energy Standard (CES) goal of delivering 50% of
electricity from renewables by 2030, as well as goals for energy efficiency, electric vehicles, and energy
storage.
© Consolidated Edison Company of New York16
Table 4-5: New York State and New York City clean energy policies as of December 14, 2018
Policy Focus New York State New York City
Goals • 80% reduction by 20508 • 80% reduction by 20509
• 40% reduction by 20308 • 40% reduction by 20309
Greenhouse Gas Emissions
Supporting • 23% reduction in energy use by buildings by 2030 • 40% reduction in building GHG emission by 2030
initiatives • Zero Emission Credit (ZEC) procurement • Phase-out #4 heating oil by 2030
requirement • 80% reduction of NYC fleet emissions by 2035
• Ongoing NYISO carbon pricing effort (50x25)
• 80% of trips by sustainable transportation mode by
• Zero Emissions Vehicle (ZEV) mandate
2050
• Ongoing EV proceeding
• Member of RGGI
• Member of Climate Alliance – Multi-state coalition
with goals consistent with Paris Agreement
Goals • 50% of electricity from renewables by 2030 • Support NYS CES goal
Supporting • Renewable Energy Credit (REC) procurement • Install 1,000 MW of solar capacity by 2030 and
initiatives
Renewables
requirement 7,000MW by 2050
• 2.4 GW target of offshore wind by 2030 –
procurement of at least 800 MW between two
solicitations issued in 2018 and 2019
• 3 GW target of solar by 2023 (NY Sun Initiative)
• Value of DER and Net Energy Metering
compensation
Goals • 3% annual electric utility savings target by 2025 •
Energy Efficiency
Implicit in GHG emissions goals
Supporting • Clean Energy Fund goal of 10.6 million MWh in 10 • Establishing energy performance standard for new
initiatives years and substantially renovated buildings
• Expanding energy benchmarking and audit
requirements to owners of mid-sized buildings
Goals • Deploy 1,500 MW of energy storage by 2025 and • Install 100 MWh of energy storage by 2020
3,000 MW by 2030
Storage
Supporting • Energy Storage Roadmap proceeding & associated
initiatives bridge incentive program from NYSERDA
Changing Regulatory Model
In addition to setting GHG emissions reduction goals, regulators are also exploring ways to reform the
regulatory model to better align utilities’ business incentives with policy goals. Performance-based regulation
(PBR) has gained renewed interest in New York State with the Public Service Commission (PSC) adopting a
variety of earnings adjustment mechanisms.
New York State has also led the nation in encouraging utilities to deploy “non-wires solutions,” which are
portfolios of alternative resources like energy efficiency and DERs, that meet needs traditionally met by a
8
This reduction is based on 1990 levels.
9
This reduction is based on 2005 levels.
© Consolidated Edison Company of New York17
physical asset (“wires”). Under these programs, utilities can earn a return on their incentive payments to third
parties, just as they have earned a return on traditional physical asset investments and can receive an
additional incentive by retaining a portion of the net benefits from a deferred project.
These innovative efforts are designed to encourage utilities to support DER additions, achieve higher levels of
energy efficiency, and grow demand response programs—efforts that were not part of the traditional
regulatory model.
Storm Resiliency and Security Standards
Policymakers are demonstrating increasing focus on grid resiliency and security.
The need to invest in additional storm resiliency came into sharp focus in New York in 2012, when Superstorm
Sandy caused extensive service disruption and an estimated $19 billion in damages.10 In the years after,
utilities across the state invested billions of dollars not only to repair damages to the grid, but also to increase
grid resilience.
The efforts to increase grid resiliency were renewed following 2018’s winter storms, Riley and Quinn, which
tested our storm-hardening and response efforts. As part of continued storm-hardening efforts, New York City
has established special task forces and partnerships to study and plan for the challenges of climate change.
The other major threat to the grid is terrorism, which could take the form of either cyber or physical attack.
Recent high-profile hacking events have underscored the increasing need to prevent cyber-attacks by securing
information technology (IT) and operational technology (OT). Physical security also remains a key focus, given
that the potential for a blended or coordinated attack against U.S. infrastructure is judged possible by the
military and intelligence community. In light of these threats, we expect additional government standards, at
both the federal and state levels, that require utilities to invest in protecting against cyber and physical
security threats.
Customer Expectations
In addition to delivering safe, secure, reliable, and affordable energy, utilities are increasingly expected to
empower customers with greater convenience, choice, and control over their energy consumption. These
three evolving customer expectations are described in further detail below.
10
City of New York (2013),
http://www.nyc.gov/html/sirr/downloads/pdf/final_report/Ch_1_SandyImpacts_FINAL_singles.pdf
© Consolidated Edison Company of New York18
Convenience
As industry surveys indicate, customers place high value on convenience and ease of use. Customer
satisfaction is closely correlated to proactive communication and customer access to relevant, targeted
information through their communication channel of choice. Popular communication channels include text
messaging, mobile apps, and social media.
In the coming years, customers will expect to access smart-meter data on their devices, which will enable them
to review and manage their energy usage and costs. They will also expect to easily access the most current
information on service work, including outage information and estimated service restoration time.
Choice
In addition to convenience, customers also expect their electric utilities to allow them to choose from an
increasingly wide range of energy-management solutions and customer-sited clean energy solutions. Most
customers prioritize solutions that deliver cost savings, but many customers also place a high value on the
environmental impact of their energy solutions.
To achieve both cost savings and sustainability, a rapidly increasing number of residential and business
customers are demanding customized, value-added products and services, including: innovative rate plans;
energy efficiency and other demand management programs; green-pricing programs; and personalized
recommendations and promotions.
Control
As customers adopt energy-management and customer-sited solutions, they increasingly seek control of their
energy usage. Customers expect CECONY to serve as a trusted advisor that will guide them in implementing
and maintaining their chosen solutions. Embracing the opportunity and educating customers will encourage
them to take further control of their electricity usage and bills, a shift that we believe will translate into
increased customer satisfaction.
© Consolidated Edison Company of New York5. Demand, Volume and 19
Supply Forecasts
Central to the Company's planning is our ability to forecast electric peak demand. Prior to each summer
season, CECONY issues a forecast for electric peak demand, both for the system as a whole and for each of the
84 networks and non-network load areas and 13 radials that comprise CECONY’s electric distribution system.
The forecasted system peak guides our electricity supply purchases and transmission system investments. The
network-level peak forecasts guide the Company’s decisions on distribution infrastructure investment, helping
us directing capital to the areas of greatest need.
In addition to our demand forecasts, CECONY also creates total annual electric volume forecasts, both to
estimate our revenue and ultimately to set rates. Finally, we forecast energy supply costs so that we can
predict the impact of energy supply and delivery on customer bills.
Long-Term Electric Peak Demand System-Level Forecast
Each year, the Company develops a long-term, system-level forecast for electric-peak demand based on three
key inputs, which are explained below: the previous summer’s peak demand adjusted for weather (weather
adjusted peak), the forecasted peak demand growth, and demand modifiers, or counterbalancing effects,
which are subtracted from the previous two inputs. Based on these inputs, the 2018 CECONY system-wide
peak demand was approximately 13,230 MW and has a forecasted five-year compound annual growth rate
(CAGR) of 0.1% and a twenty-year CAGR of 0.4%. Figure 5-1, shows the complete peak-demand forecasting
process subsequently described in further detail.
Figure 5-1: Load forecasting process
EE & DR
Employment
Distributed
Generation
Population
Weather Forecasted
Solar PV
Adjusted Peak Peak
Known
Projects Demand
Energy
Storage
Technology
AMI /VVO
© Consolidated Edison Company of New York20
Weather Adjusted Peak (WAP)
CECONY designs its electric system to provide reliable service during heat waves. However, during a given
summer, we may not experience a heat wave of the intensity and duration we had anticipated. We
nevertheless compute the peak demand the system would have experienced had the peak-day weather
exactly matched the weather conditions we used for planning purposes; the resulting peak demand is referred
to as the weather adjusted peak (WAP). The WAP allows the forecast to include demand growth irrespective of
whether a system peak is experienced in a given summer.
Demand Growth
As illustrated in Figure 5-1, peak demand growth considers four key factors: employment, population, known
projects, and adoption of new technology. The calculation uses econometric models that consider
employment, population and other factors, as well as information derived from customer surveys. The process
also considers demand growth expected from actual planned projects of which the Company has been
officially notified. Finally, technology-driven growth considers EVs as well as steam to electric air conditioning
(A/C) conversion. Our predictions of near-term EV growth are based on the number of current registrations;
longer-term predictions are based on policy objectives such as New York State’s zero-emission vehicle
mandate. Predictions of demand growth due to steam to electric A/C conversion are based on the historical
and current number of customers converting from steam A/C to electric A/C.
Demand Modifiers
The anticipated system-level demand growth based on the first two inputs is then adjusted to account for
"demand modifiers," factors that counteract demand growth.
First, peak demand is reduced by customers’ increasing embrace of energy efficiency (EE) and demand
response (DR) programs. The forecast considers both traditional Company and state incentives, as well as DR
accounts enrolled in CECONY programs.
Distributed generation (DG) includes Combined Heat and Power (CHP) systems, as well as newer technologies
such as fuel cells and micro-turbines. The DG forecast is based on the number of applications for
interconnection in the Company’s tracking system as well as historical trends to extrapolate growth for later
years.
Solar PV is accounted for by considering the number of applications for interconnection in the Company’s
tracking system in the near term. Longer-term growth rates are forecasted based on tax-incentive credit
policies and historical growth rates.
The impact of energy storage is included by blending the historical growth rates of DG/CHP and PV when they
were at similar phases in the initial adoption stages. Going forward, our storage forecast will be informed by
more specific factors, including storage pricing, installed cost, and policy initiatives such as net metering and
tax credits.
© Consolidated Edison Company of New York21
Finally, the forecast is modified to account for the rollout of AMI, which will reduce peak demand by
approximately 1% due to conservation voltage optimization (CVO).
Network Level Forecasts
In addition to our system-wide forecasts, CECONY also prepares peak-demand forecasts for each of our 65
secondary networks, 19 non-network areas, and 13 radials. Like the system-level demand forecast, the process
for forecasting each independent network’s peak demand begins with determining the individual network’s
WAP. After accounting for expected demand growth and demand modifiers, we arrive at a final peak demand
forecast for each network.
Long-Term Electric Volume Forecast
In addition to the demand forecasts described above, CECONY creates overall delivery volume forecasts, which
are used to forecast the Company’s revenue. The Company uses this revenue forecast to set rates and assess
capital requirement needs.
The forecasts of delivery volumes for major service classifications11 are based on econometric models. For
other service classifications, the forecasts of delivery volumes are based on a deterministic model.
The delivery volume forecast derived from the econometric models is then adjusted downward for mitigating
factors, including solar PV, energy efficiency and demand management programs, steam to A/C conversion,
and major projects.
Figure 5-2 shows CECONY's twenty-year forecast for electric volume, which is projected to decline at a CAGR of
0.8% over the next 20 years, primarily driven by the higher adoption of DERs and energy efficiency measures.
11
These classifications include SC 1 (Residential), SC 2 (Small Commercial), SC 8 (Master Metered Apartments), SC 9 (Large
Commercial), and SC 12 (Multiple Dwelling Space-Heating).
© Consolidated Edison Company of New York22
Figure 5-2: CECONY 20-year electric system volume forecast
60
Electric Volume (TWh)
45
30
15
0
2013 2018 2023 2028 2033 2038
Historical (-0.3% '13-'18 CAGR)
2018 Forecast (-0.8% '19-'38 CAGR)
Supply Outlook
While we do not own significant power generation facilities, we do procure energy for our full-service
customers, whose energy consumption in 2017 was approximately 35% of all of our delivered electricity.
CECONY works diligently to achieve reasonable supply costs for these customers in two ways. First, we make
informed and strategic purchase decisions, incorporating our own generation as well as selecting a cost-
effective mix of direct purchases from the energy market and short-term contracts. Second, we use financial
hedging products to protect our customers from the volatility of our spot energy purchases.
While we will continue to make every effort to control our transmission and distribution delivery costs, we
expect supply costs to rise over the next 20 years, resulting from the New York State’s Clean Energy Standard
(CES) requirements, downstate nuclear retirements, carbon pricing, and additional transmission investments.
Figures 5-3 and 5-4 illustrate how we expect the resource mix to shift over the next twenty years to navigate
this changing energy market. The capacity resource mix and associated generation resource mix are driven by
the State’s Clean Energy Standard and other initiatives and are expected to meet the 50X30 renewable goal.
© Consolidated Edison Company of New York23
Figure 5-3: New York State capacity resource mix for 2017 versus 2030 and 2038
60
Coal
Oil
Nuclear
40
Natural Gas
ICAP (GW)
Bio/MSW
Solar
20
Offshore Wind
Onshore Wind
Hydro
0
2017 2030 2038
Figure 5-4: New York State generation resource mix for 2017 versus 2030 and 2038
180
Other
New York State Generation Mix (TWh)
150 Nuclear
Gas
120
Other Imports
90 HQ Imports
Solar
60
Offshore Wind
30 Onshore Wind
Hydro
0
2017 2030 2038
Given the many uncertainties inherent in this forecast—including the pace of distributed-generation adoption,
the mix of renewables built, and options for gas self-supply—this supply mix could change significantly in the
coming years.
© Consolidated Edison Company of New York24
6. Strategy
The Company’s mission comprises four goals: to provide energy services to our customers safely, reliably,
efficiently, and in an environmentally sound manner; to provide a workplace that allows employees to realize
their full potential; to improve the quality of life in the communities we serve; and to provide a fair return to
our investors. The Company achieves these goals through three strategic priorities: improving public and
employee safety, achieving operational excellence, and enhancing the customer experience.
For each of these priorities, we set a level of aspiration; conduct an analysis of the future capabilities needed
to reach that level; identify our current position relative to our aspiration; and then identify investments that
close the gap between our current and desired positions. Below we summarize each of our three strategic
priorities and how they guide our strategy.
Improving Public and Employee Safety
Nothing is more important than our first priority: the safety of the public we serve and our employees. We
approach safety through a framework of prevention, detection, and response, which is fully integrated into our
planning and operations processes.
Our safety strategy seeks to prevent events before they occur through prudent planning, design, and operating
practices. We also utilize technology and processes to detect the conditions that indicate that an event is
developing. Our safety strategy also includes technology and operational processes that allow us to quickly
respond to events that do occur to minimize their impact and speed recovery time.
Achieving Operational Excellence
The strategic priority of achieving operational excellence focuses on strategically planning for the future, and
effectively executing our work every day. We do this by improving our processes by fully engaging our
employees and their capabilities and applying state-of-the-art technologies. The elements of our operational
excellence strategy are described below.
Managing Risk to Deliver Energy with High Reliability and Resiliency
We recognize the importance of electric service to our customers and the New York City metropolitan area
economy. Our goal is to provide reliable electric service during normal conditions and minimize the disruptions
that occur during extreme weather events. We also recognize that the risk environment is expanding to
include cyber-risks and long-term changes in climate that can exacerbate reliability challenges. We embrace
the challenge of meeting this goal while shifting to a more diverse and distributed resource mix.
Advancing System Design to Incorporate Distributed Energy Resources
Over the planning horizon, our electrical energy delivery system will evolve into a modernized grid that
supports distributed and bulk power resources. Non-wires solutions such as energy efficiency and other DERs
© Consolidated Edison Company of New York25
will be integrated with traditional delivery system elements to provide the capacity necessary to meet
demand. The Company continues to seek new ways to integrate DERs and make the delivery system more
adaptable to changing conditions.
Supporting Corporate Sustainability Efforts
CECONY embeds sustainability goals, processes, and metrics into our core business strategy and operations to
create lasting value for our communities and the customers we serve. We have identified 23 sustainability
priorities within our core business areas of focus: Safety & Environment, Operational Excellence, and Customer
& Community. More details on each of these priorities can be found in the Company’s sustainability report.12
Advocating Positions to Advance the Role and Values of our Utilities
We recognize the need to continue to build constructive business relationships with our stakeholders by taking
a proactive and engaging approach based on accountability and open communications. We believe that
advocating our regulatory positions with integrity; maintaining productive relationships with policymakers;
openly sharing our challenges and concerns with a variety of stakeholders; and soliciting feedback will benefit
both our investors and customers.
Promoting Employee Engagement, Diversity, and Inclusion
The Company is committed to advancing employee engagement, diversity, and inclusion. The Company has
made significant progress towards attracting and hiring a workforce that reflects the diversity of the
communities we serve, and we will continue to pursue that goal. Additionally, to fully benefit from the
knowledge, skills, and experience of our employees, we are also creating and nurturing an inclusive
environment, where all employees feel valued, engaged, and motivated to contribute their best work.
Enhancing Customer Experience
Our strategic priority of enhancing our customers’ experience focuses on a customer-first mentality. We
understand that today’s most successful companies are the ones who are most responsive to consumer
desires and needs. Our strategy includes developing initiatives to deliver an enhanced experience that meets
and exceeds our customers’ current needs, and is flexible enough to anticipate, meet, and exceed their future
needs.
We recognize that to offer customers convenience, choice, and control we must provide services,
communication, and information digitally—our customers’ preferred mode of communication. We also
recognize that we need to provide customers with products and services that are customized to their needs.
We are also keenly aware of the impact of energy costs on customers. We aim to provide energy and related
services at a cost our customers deem fair by not only controlling the costs of our investments, but also by
12
Available at: www.coned.com
© Consolidated Edison Company of New York26
helping customers optimize their energy use to control their energy costs. Although we seek to minimize
service disruptions, we recognize the importance of clear and timely communications when customers are
interrupted.
© Consolidated Edison Company of New York7. Planning for New 27
Capabilities
Over the next 20 years, CECONY will implement a host of new capabilities that will increase the delivery
system’s flexibility and enable customers to better manage their energy use and costs. The bulk of our
investment in new capabilities falls within two broad plans: our grid modernization plan and our customer
engagement plan. As part of both plans, CECONY is also working with policymakers and other stakeholders to
evaluate alternatives to the current rate structure that would more effectively promote efficient use of the
electric delivery system.
The grid modernization plan will make our electric grid more flexible and transform it from a one-way delivery
system into a distributed system platform. As described below, CECONY’s planned investments include
technologies such as energy storage, communications infrastructure, DER management systems, advanced
data analytics, and grid-edge sensors. By adopting these technologies, we will more fully integrate clean
energy into our delivery system so that we can continue meeting our customers’ energy needs, regardless of
where and how their energy is generated. The integrated delivery system will also be more reliable and
resilient.
Our customer engagement plan calls for investments that will provide customers greater information and
control. We are improving the customer experience through features like the customer portal, and we are
rolling out advanced metering infrastructure, which allows for more granular data collection that can be
shared with customers in near real time. Finally, in a host of demonstration projects, we are promoting
customer-sited solutions and exploring new product and service offerings.
As shown in Figure 7-1, these investments in new capabilities will total approximately $4 billion over the next
20 years.
Figure 7-1: CECONY 20-year new capabilities capital expenditures
DSP
Capital exependiture types
Customer solutions IT
AMI
Grid modernization
$0 $500 $1,000 $1,500 $2,000
Total capital expenditure ($M)
© Consolidated Edison Company of New York28
Grid Modernization
Central to our plan for the future is a grid modernization strategy, which calls for investment in a portfolio of
technologies and initiatives that will transform the grid into a distributed system platform (DSP). The DSP will
enable the transformation of the traditional one-directional energy delivery system into an advanced two-way
platform for delivering energy both to and from our customers. Equipping the grid to serve as a multi-
directional platform is fundamental to meeting our customers’ future needs.
Throughout the Company, many grid-modernization initiatives are already underway; others are in the
planning phase. CECONY's grid modernization investment portfolio includes investments in five primary areas:
foundational systems and infrastructure, distribution automation, grid-edge sensing, data analytics, and
flexible resources.
• Investments in foundational systems and infrastructure include the foundational information
technology and operational technology systems, equipment, communications, and capabilities
required to support other grid-modernization technologies and applications.
• Distribution automation investments include digital sensors and switches with advanced control and
communication technologies, which enable the Company to improve fault location, isolation, and
service restoration.
• Grid-edge-sensing investments deploy smart devices across the delivery system that communicate
with control centers and provide CECONY with increased visibility and situational awareness of the
system.
• Data analytics investments will enable CECONY to collect and analyze large quantities of data, which
will provide meaningful information needed to support real-time and predictive decision-making.
• Flexible resource investments will enable system operators to better manage the delivery system
while sourcing electricity from a cleaner and more diverse supply mix, including DERs and
intermittent generation.
Table 7-1 shows CECONY's planned grid-modernization investments over a twenty-year period.
© Consolidated Edison Company of New YorkYou can also read