CHANGE MATERIAL INSIGHTS REPORT - Textile Exchange
←
→
Page content transcription
If your browser does not render page correctly, please read the page content below
MATERIAL
CHANGE
INSIGHTS REPORT
      2019

   The state of fiber
 and materials sourcing
Foreword

                                             As companies, organizations and individuals, we might have a great passion
                                             for making the world a better place. But we don’t always know where to start,
                                             or if what we are doing is enough.

                                             This is understandable given the bewildering amount of information available
                                             to us, some of it conflicting. As a non-profit specializing in the sustainability of
                                             raw materials in the textile industry, we recognize that it is impossible to know
                                             where we need to go next until we know where we are.

                                             Benchmarking answers the question, "Where are we now?" It allows us to
                                             define what "the end" of the journey looks like and create a roadmap for
                                             getting there. And crucially, it provides the catalyst and momentum to drive a
                                             race to the top.

                                             We hope these industry-level insights from our latest Corporate Fiber &
                                             Materials Benchmark provide the clarity needed to move your materials
                                             journey forward!

                                                              Liesl Truscott
                                                              Director of European & Materials Strategy
                                                              Textile Exchange

2   Textile Exchange © 2020   Contents                                                                         Material Change Insights Report•• 3
Contents                                                                                                                    Navigating the Report

    State of the Sector█                                                                                                  █6   State of the Sector
     Executive Summary█                                                                                                   █6   The report opens with the executive summary, supported by key 2019 takeaways which provide high-
     Key 2019 Takeaways█                                                                                                  █8   level statistics. Next, topic summaries offer a succinct look at the industry state of play and improvement
     Topic Summaries█                                                                                                   █12    opportunities. The Material Change Leaders Circle celebrates the 16 companies that achieved the top
                                                                                                                                performance banding in the holistic Material Change Index, followed by the full Leaderboard that presents
     2019 Material Change Leaderboard█                                                                                  █14    an overview of leading companies in each of the Material Change indices.

    Part A: Analysis█                            █18     Part B: Data Deep Dive█                                       █62    Part A: Analysis
    Business Integration█                        █20     Business Integration█                                         █64    Part A contains the main body of the analysis and is organized according to the Corporate Fiber and
     Strategy█                                    █20     Strategy█                                                     █64   Materials Benchmark framework: Business Integration, Sustainable Development Goals, Circularity, and
     Sustainable Development Goals█               █24      Sustainable Development Goals█                               █68   Material Portfolios including Cotton, Polyester, Nylon, Manmade Cellulosics, Wool, Down and Leather.
     Circularity█                                 █28      Circularity█                                                 █70   Each topic is comprised of the following:

    Materials Portfolio█                         █34     Materials Portfolio█                                          █74     • Analysis highlights: A round-up of the quantitative and qualitative data; bringing important findings
                                                                                                                                   from Part B: Data Deep Dive into an analytical narrative.
     Cotton█                                      █35     Cotton█                                                       █74
     Polyester█                                   █41     Polyester█                                                    █78    • Material dashboards: An infographic-based dashboard is displayed for each material portfolio,
                                                                                                                                   providing a profile of the participants, outcomes and impacts of their improved sourcing practices, with
     Nylon█                                       █45     Nylon█                                                        █82
                                                                                                                                   a focus on climate change - in collaboration with the Sustainable Apparel Coalition.
     Manmade Cellulosics█                         █49      Manmade Cellulosics█                                         █85
                                                                                                                                 • Company highlights: A snapshot of company actions based on an analysis of comments included in
     Wool█                                        █53      Wool█                                                        █89
                                                                                                                                   survey submissions, and presented as bullet-point summaries designed to spark and inspire.
     Down█                                        █57      Down█                                                        █92
                                                                                                                                 • Progress tables: Alongside the Material Change Leaderboard, Textile Exchange recognizes
     Leather (pilot)█                             █61      Leather (pilot)█                                             █95
                                                                                                                                   companies' progress in their uptake of preferred materials.
                                                                                                                                 • Leveling up stories: A summary of top tips gleaned from interviews with industry leaders.
    Part C: About the Benchmark Program█                                                                               █102
                                                                                                                                 • Extra insights: Additional contributions, analysis and findings that complement the data.
     Methodology█                                                                                                       █104
     Resources█                                                                                                         █107
                                                                                                                                Part B: Data Deep Dive
     2019 Participants█                                                                                                 █108
     Acknowledgements█                                                                                                  █112   Part B contains the quantitative data analysis. Highly visual, Part B is organized according to the
                                                                                                                                benchmark framework, mirroring Part A. Part B also includes a representative selection of company
                                                                                                                                comments (presented as quotes), unattributed but identified by sub sector category.

        Extra Insights                                                      Circularity analysis in partnership with:           Part C: About the Benchmark Program
          A First in Benchmarking Circularity     30                                                                           Further information on the benchmark program.
          Data Improvements                      100

                                                                                                                                   Interactive navigation
                                                                                                                                   The report is color coded. Thematic icons can be found at the bottom of each page, allowing the
                                                                                                                                   reader to easily move between the Analysis in Part A and the Data Deep Dive in Part B.

                                                         Use these icons to navigate to Part A: Analysis                                  Use these icons to navigate to Part B: Data Deep Dive

    Cover image: Carlotta Cataldi

4 ••Textile Exchange © 2020            Contents                                                                                                                                                              Material Change Insights Report•• 5
State of the Sector
    Executive Summary                                                                                                    Executive Summary

    As we publish our 2019 Material Change Insights Report, we acknowledge the unprecedented times in
    which we’re living.                                                                                                     Companies are increasingly sourcing their raw materials from preferred sources.
                                                                                                                            Reporting companies sourced nearly 40% of their materials from preferred sources in 2018. This
    In nearly every way imaginable, the COVID-19 pandemic has upended the world order. It has tested
                                                                                                                            includes cotton, polyester, nylon, manmade cellulosics, wool and down. Textile Exchange defines
    global leaders, disrupted supply chains and deeply impacted individual lives in ways big and small.
                                                                                                                            a preferred material as one which results in improved environmental and/or social sustainability
                                                                                                                            outcomes and impacts in comparison to conventional production.
    It is within this context that we ask ourselves: What are the implications of this crisis for the textiles sector?
    How should we approach our journey to more sustainable materials sourcing when other priorities require
    urgent attention? Does it still matter?
                                                                                                                            More and more companies are incorporating circularity into their strategies — but a deeper
    Yes, it does. Amidst tragedy and chaos, this pandemic has demonstrated the deep                                         rethinking of value chains is still lacking.
    interconnectedness between people and planetary systems. It shows the turmoil that can result when
                                                                                                                            Companies are recognizing the urgent need to reduce dependency on virgin material inputs and
    one element of the system is out of balance — a situation that is certain to repeat itself many times over if
                                                                                                                            eliminate waste by shifting towards a circular value chain. 86% of companies responding to the
    we ignore long-term risks like climate change.
                                                                                                                            circularity questions have a circularity strategy in place - up from just 29% of the same companies
                                                                                                                            two years before. However, the majority are focusing on one or a few circularity activities, with limited
    This interconnectedness is particularly evident in the textiles sector. Raw materials are derived from plants,
                                                                                                                            coverage right across the business. Circularity leaders are moving our industry in the right direction,
    animal fibers and fossil fuel products, supporting livelihoods for many but also risking negative impacts on
                                                                                                                            with design strategies, post-consumer collection, use of recycled content, and other circularity-
    health and ecosystems through pollution, unsustainable land use and climate change. At the same time,
                                                                                                                            enabling practices. To achieve the transformative shift we need, from a linear to circular textile
    the favorable growing conditions, reliable rainfall and fertile soils that so many farmers, companies and
                                                                                                                            system, these efforts must be connected, accelerated, and scaled exponentially.
    consumers depend on are at risk of collapse or simply will not recover and regenerate.

    It’s time to rethink the textiles industry to make it fit for the future. But where do we begin?
                                                                                                                            The UN Sustainable Development Goals (SDGs) are a useful framework for global action.
    First, we need to know where we stand. This is where this Material Change Insights Report comes in.                     However, the majority of companies have not yet set measurable targets within the Goals.
    Our 2019 report summarizes the state of fiber and materials sourcing in the textiles industry, drawing on               The way we produce, (re)use and dispose of or recycle our materials has an impact on nearly
    exclusive data from the industry’s largest voluntary peer-to-peer comparison initiative. It builds on Textile           every one of the SDGs. The textile industry has a powerful opportunity to shift the needle in both
    Exchange’s Material Change Index (MCI) — a family of indices, published earlier this year, that tracks                  producer and consumer contexts. Our study shows that 66% of companies said they have identified
    individual company progress. In an industry lacking consistent and comparable reporting, Textile Exchange               priorities with respect to one or more of the SDGs; The top priority SDG for participants was SDG
    aims to fill the gap by rigorously analyzing and validating self-reported company data in order to track the            12 Sustainable Consumption and Production (93%), and 80% cited SDG 13 Climate Action as their
    materials sourcing progress of individual companies as well as the industry at large.                                   second most important SDG. However, 71% have not set measurable targets in relation to SDGs,
                                                                                                                            which is needed for these commitments to be meaningful.
    Here are a few takeaways from this year’s analysis:

       Climate change and raw materials sourcing are inextricably linked — and sourcing preferred                        The time for urgent action is now.
       materials is a powerful way for a company to reduce its climate impacts.
                                                                                                                         We are encouraged by the progress we are seeing. But we realize that meaningful change requires an
       The climate crisis is already impacting business and has catapulted up the list of corporate risks. The           even deeper commitment to a sourcing model that regenerates instead of extracts, that benefits instead
       choices a company makes when sourcing raw materials can either damage or improve the health                       of exploits, and that prioritizes the health of the planet and all of us people on it. Now is the time to double
       of the planet - and sourcing preferred materials is a demonstrated way to make sure it’s the latter.              down on this commitment. Let’s embrace kindness. Let’s accelerate innovation, rather than stall it.
       In 2018, reporting companies collectively converted 1.7 million metric tons of materials to preferred,
       resulting in a saving of 1 million metric tons of greenhouse gases. We believe the potential to drive             We may not have been able to prevent the current pandemic - but we do have it within our power to
       further reductions is tremendous. Under our new Climate+ strategic direction, Textile Exchange will               prevent future crises. At Textile Exchange, we are here to support you however we can.
       be the driving force for urgent climate action with a goal of 30% reduced CO2 emissions from textile
       fiber and material production by 2030.

6 ••Textile Exchange © 2020           Contents                                                                                                                                                           Material Change Insights Report•• 7
State of the Sector
    Key 2019 Takeaways                                                                                                        Key 2019 Takeaways

       Five big insights                                                                                                       Preferred materials uptake by region

                                                                                                                               Europe accounted for 74% of global preferred materials uptake in 2018.
                         of participants have set
                                                                                  of participants' material use
            85   %       a 100% preferred target
                         for one or more material                    39     %     came from preferred sources
                                                                                  for main materials.
                         categories.

                                                                                                                                                                North
                                                                                                                                                                                            Europe
                                                                                                                                                                                            74%
                                                                                                                                                               America
                                                              of greenhouse gases were saved
                                 1 million                    by shifting to preferred materials                                                                25%
                                       tons                   with lower carbon footprints.

                                                                                                                                                                                                     Africa

                         of participants with                                     an estimated percentage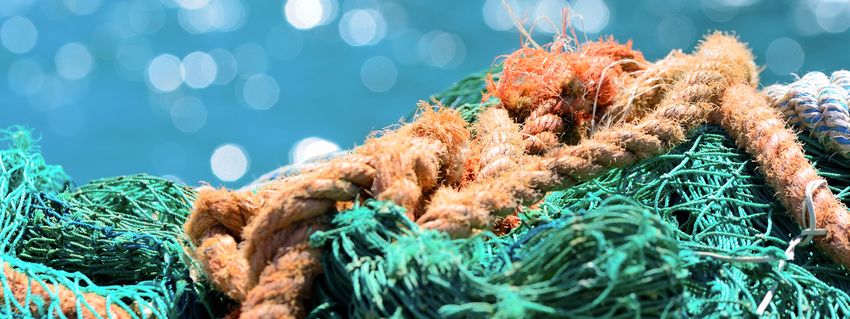
State of the Sector
    Key 2019 Takeaways                                                                                                                                                                      Key 2019 Takeaways

                          Snapshot of preferred materials                                                                                                                                    Positive environmental impacts achieved through preferred materials sourcing

                                                                                 Cotton                                                  Polyester                 MMC             Nylon
                    100%                       100%                      54% of total portfolio                                            33%                     7%              5%             1 million tons CO2e                         22 billion megajoules                              374 billion liters
                                                                                                                                                                                             of greenhouse gas emissions saved                 of fossil fuel energy saved                          of water saved
                                                                      43% conventional cotton
    Share of preferred

                               61%
                                                                         1% recycled cotton                                                 82%                      68%
                                                                                                                                                                              99%
                                6%
                                                                  56% preferred, renewable cotton
                               33%                                                                                                                                   32%
                                                                                                                                            18%                               1%
                                                                                                                                                                                             Equivalent to driving 4.2 billion kms         Equivalent to powering 504,964                Equivalent to the water needs of
                         0%             100%   0%           10%          20%          30%          40%           50%           60%          70%           80%           90%          100%
                                                                                                                                                                                                  in an average sized car                      US homes for one year                      342 million people for one year
                          Total portfolio                                                          Material-specific breakdown                                                 Down
                                                                                                                                                                Wool
                                                                                                                                                                1%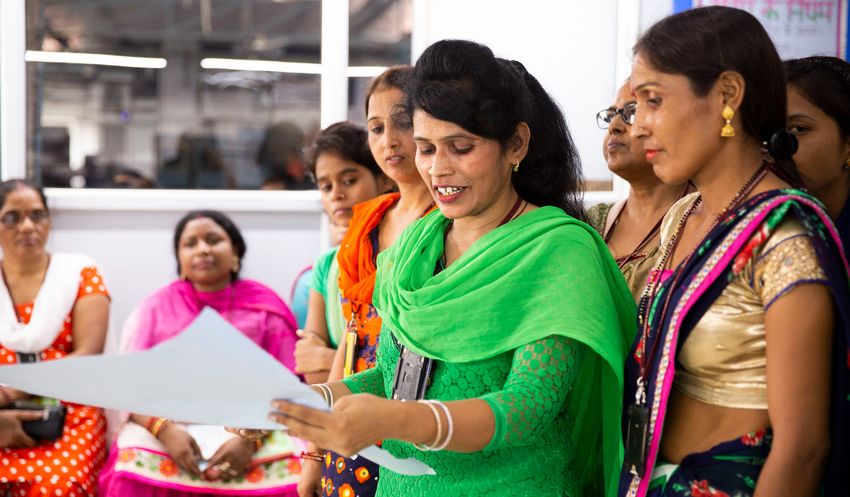
State of the Sector
    Topic Summaries                                                                                                        Topic Summaries

        Strategy                                                                                                               Nylon

    State of play                                               Areas to improve                                           State of play                                             Areas to improve
    Climate change (the most cited business risk) will          Integration can be deepened through greater Board          As a minority fiber (by volume), nylon is                 Nylon carries all the challenges of polyester but
    keep materials front and center. Companies are              penetration, and incentivizing and rewarding materials     overshadowed by polyester and engagement is               without the attention. Like, polyester, there are
    developing integrated strategies that take care             sustainability-related performance across the              minimal. Strengths include investing in specific          growing opportunities to explore alternatives to virgin
    of business at the start of their supply network,           organization. Confidence in data and reporting will be     branded programs, but widespread adoption of these        non-renewables and to connect preferred feedstocks
    engaging stakeholders and increasingly customers.           achieved through better quality assurance.                 programs has yet to occur.                                to positive campaigns such as ocean clean-ups and
                                                                                                                                                                                     worker livelihoods.

        Sustainable Development Goals
                                                                                                                               Manmade Cellulosics
    State of play                                               Areas to improve
    Companies are divided on how best to approach               Embedding the SDGs will require matching                   State of play                                             Areas to improve
    the SDGs. Some are working hard to build strategic          the global imperative of the Goals to business             Deforestation and pollution from fiber production are     Investment and active stakeholder collaboration are
    alignment and systems for implementing and tracking         opportunity, building leadership and creating clarity      identified by companies as top risks. Companies           what's needed. The pace of change is somewhat
    progress. Others are less clear on the pathway or the       of intent. Tapping into global commitments and new         are extending their initial focus on forests to include   dictated by the extent to which experts have agreed
    need to evaluate their current sustainability priorities.   investment opportunities could incentivize action.         pulp and fiber production and exploring alternative       best practice and set strong industry standards.
                                                                                                                           feedstock options.                                        Significant sourcing of conventional viscose remains.

        Circularity
                                                                                                                               Wool
    State of play                                               Areas to improve
    The breadth of circularity strategies and ambition          Textile-to-textile recycled fiber is still nascent – the   State of play                                             Areas to improve
    levels are increasing rapidly, with some aligning           replacement of virgin materials with post-consumer         Conventional wool dominates uptake albeit with            With pressure on agriculture to become more
    circularity with the SDGs. Many companies are               textiles must increase to close the loop. Business         many companies having non-mulesing policies               regenerative and sensitive to biodiversity needs, there
    training design teams and engaging customers and            model innovation, technology investment, and               in place. Recycled wool uptake was higher than            is considerable potential for the industry to do good
    suppliers to develop more circular systems.                 resource efficiency targets will be important levers.      volumes sourced from preferred virgin wool                by transitioning to wool programs with both animal
                                                                                                                           programs, such as the Responsible Wool Standard.          welfare and responsible land use criteria in place.

        Cotton
                                                                                                                               Down
    State of play                                               Areas to improve
    Companies are more advanced on cotton than most             More regional transparency, direct intervention and        State of play                                             Areas to improve
    other materials. Key drivers are the widespread             monitoring of impacts are needed at farm-level.            Awareness of animal welfare issues has led to the         As a by-product of the food industry, influencing at
    availability of preferred cotton programs and cotton        Verification of preferred cotton uptake could be           successful growth in the use of standards such            farm-level is challenging. However, opportunities
    being a large volume material for many. A highlight         stronger, as systems, such as chain of custody, are        as the Responsible Down Standard, with more               to monitor improvements and influence further lies
    was the uptake of preferred, renewable cotton.              seldom complete through the entire supply chain.           companies achieving transition of their entire supply     in achieving greater transparency back to source
                                                                                                                           to a certified source than any other material.            through supply chain mapping.

        Polyester
                                                                                                                              Leather
    State of play                                               Areas to improve
    Accelerating the sustainability of polyester lags           Transition to recycled is slow and companies struggle      State of play                                             Areas to improve
    behind cotton given how cost effective and readily          to certify entire supply chains. Eventually, recycled      Until recently, leather processing risks (tanning,        With developments typically led by the food industry,
    available conventional polyester remains. There are         needs to be from post-consumer textile and not just        chemical use) have been the main focus. The               and very opaque supply chains, it is challenging for
    signs, however, that companies are looking to shift to      plastic packaging. For this to happen, collaboration is    growing interest in animal welfare, deforestation, land   brands to address farm-level risks. Textile Exchange
    recycled and renewable alternatives.                        needed between stakeholders, including consumers.          use (and associated biodiversity loss), and climate       has developed the Leather Impact Accelerator (LIA)
                                                                                                                           change issues is driving interest and investment in       to accelerate positive actions along the full beef/
                                                                                                                           leather.                                                  leather value chain.

12 ••Textile Exchange © 2020           Contents                                                                                                                                                           Material Change Insights Report•• 13
State of the Sector
    2019 Material Change Leaderboard                                                                                         2019 Material Change Leaderboard

    The Material Change Index                                                                                                The Leaders Circle

    Textile Exchange's Material Change Index (MCI) is a voluntary benchmark that tracks the apparel and textile              The Material Change Index (MCI) is the cornerstone of the MCI family of indices. The MCI incorporates
    sector’s progress toward more sustainable materials sourcing, as well as alignment with global efforts like the          scores achieved across the full benchmark framework: strategy and integration, circularity, and the portfolio
    Sustainable Development Goals and the transition to a circular economy. As a voluntary benchmark, the MCI                of materials. The companies included in the Leaders Circle have robust materials sustainability strategies,
    is based on companies’ willingness to be transparent and disclose their materials uptake and management                  comprehensive integration and implementation systems in place, including circularity, and are making good
    practices - in order to learn from each other and promote inclusive progress.                                            progress in transitioning their materials portfolio to preferred options.

    The MCI is a key component of Textile Exchange’s Corporate Fiber & Materials Benchmark (CFMB) program,                   The 16 companies listed here achieved a Level 4 Leading position in the 2019 Material Change Index (MCI) and
    which enables participating companies to measure, manage and integrate a preferred fiber and materials                   form the 2019 Material Change Leaders Circle.
    strategy into their business. The CFMB is one of few transparency benchmarks built on voluntary company
    disclosure of management activities and performance, coupled with evidence to support company claims and
    validated by Textile Exchange. By participating, companies demonstrate a commitment to transparency and                  MCI Level 4 Leading Companies
                                                                                                                             (alphabetical)
    continuous improvement around their materials sourcing strategy.
                                                                                                                              C&A AG

    The MCI Family of Indices                                                                                                 Coyuchi, Inc.
                                                                                                                              DECATHLON SA
    The MCI family of indices consists of an overarching Material Change Index that tracks companies’ holistic                EILEEN FISHER, Inc.
    approach to more sustainable materials sourcing, as well as a number of related indices: Circularity, SDGs, and           H&M Group
    Material Portfolio Indices for Cotton, Polyester, Nylon, Manmade Cellulosics, Wool, and Down.                             IKEA of Sweden AB
                                                                                                                              Levi Strauss & Co.
    Performance Bandings
                                                                                                                              Loomstate, LLC

    Company results are assigned to one of four performance bands.                                                            MUD Jeans
                                                                                                                              Naturaline
                                                                                                                              NIKE, Inc.
                 Developing                                                   Establishing
                                                                                                                              Nudie Jeans
                 This level is for companies that are laying                  This level is for companies that are
                                                                                                                              Patagonia
                 the foundation of their programs and                         strengthening their programs and scored
                 scored 25 or less out of 100 possible                        26-50 out of 100 possible points.               prAna
                 points.                                                                                                      Stanley/Stella SA
                                                                                                                              Tchibo GmbH

                 Maturing                                                     Leading                                        The Leaderboard
                 This level is for companies with emerging                    This level is for companies that are
                 leadership that scored 51-75 out of 100                      pioneering industry transformation and         The new Material Change Leaderboard includes Level 4 Leading companies across the Material Change Index
                 possible points.                                             scored 76-100 out of 100 possible points.      (MCI) and family of indices. As a result of the benchmark program review carried out over Q4 2018 and Q1
                                                                                                                             2019, Textile Exchange has introduced the Material Change Leaderboard this year to provide a more holistic and
                                                                                                                             contemporary assessment of leadership than the volume-based focus of the past.

    Methodology                                                                                                              The Leaderboard is based on a company’s management practices (including risk assessment, transparency,
                                                                                                                             investment, target setting, and impact measurement) as well as the adoption rate of preferred fibers and
    Our methodology is continually refined through consultation with a wide range of stakeholders, including our             materials. In this way it reflects both intention and action. See full listing on next page.
    participating companies. Our program and processes are externally assured by BSD Consulting in accordance
    with Global Reporting Initiative (GRI) guidelines, bringing increased credibility and confidence in the results as the
    program grows in size and importance. See Part C for further details and links to resources.

14 ••Textile Exchange © 2020             Contents                                                                                                                                                            Material Change Insights Report•• 15
State of the Sector
    2019 Material Change Leaderboard                                                                                                2019 Material Change Leaderboard

                                                                                                                                                                   Material                                                   Family of Indices
                               Material                                       Family of Indices                                                                    Change                                                                              Manmade
                                                                                                                                                                    Index          SDG        Circularity     Cotton       Polyester        Nylon                        Wool          Down
                               Change                                                             Manmade                                                                                                                                              Cellulosics
                                Index      SDG      Circularity   Cotton    Polyester    Nylon                   Wool      Down     Company                         Level 4      Level 4        Level 4       Level 4       Level 4       Level 4       Level 4        Level 4       Level 4
                                                                                                  Cellulosics
    Company                     Level 4   Level 4     Level 4     Level 4   Level 4     Level 4    Level 4      Level 4   Level 4   (alphabetical)                 Leading       Leading       Leading        Leading       Leading       Leading       Leading        Leading       Leading
    (alphabetical)             Leading    Leading    Leading      Leading   Leading     Leading    Leading      Leading   Leading   NIKE, Inc.
    AB Lindex                                                                                                                       Norrøna Sport
    adidas AG                                                                                                                       Nudie Jeans
    Aritzia                                                                                                                         Otto Group
    ARMEDANGELS                                                                                                                     Patagonia
    ASOS Plc.                                                                                                                       prAna
    BESTSELLER A/S                                                                                                                  PUMA SE
    Boll & Branch                                                                                                                   PVH Corp
    Burberry                                                                                                                        Recreational
                                                                                                                                    Equipment, Inc. (REI)
    C&A AG
                                                                                                                                    Stanley/Stella SA
    Columbia Sportswear
    Company                                                                                                                         Stella McCartney
    Cotonea                                                                                                                         Tchibo GmbH

    Coyuchi, Inc.                                                                                                                   Tesco Stores Ltd

    DECATHLON SA                                                                                                                    The North Face
    Dedicated Sweden                                                                                                                UGG
    AB                                                                                                                              Veja Fair Trade SARL
    EILEEN FISHER, Inc.
                                                                                                                                    Wear Pact, LLC
    Fjällräven International
                                                                                                                                    WOOLWORTHS
    AB
                                                                                                                                    (PTY) LTD
    H&M Group
    IceBreaker
                                                                                                                                    Table notes:
    IKEA of Sweden AB                                                                                                               1. The Material Change Leaderboard comprises of Level 4 Leading companies who are pioneering industry transformation and scored 76-100 out of 100
                                                                                                                                       possible points in the Material Change Index or one or more of the indices that make up the MCI family of indices.
    Inditex Group
                                                                                                                                    2. The MCI is derived from the Corporate Fiber and Materials Benchmark full survey responses, including Strategy and Integration, SDGs, Circularity, and the
    KALANI S.A.                                                                                                                        company's priority Materials Portfolio.
                                                                                                                                    3. The MCI family of indices includes the SDGs, Circularity, Cotton, Polyester, Nylon, Manmade Cellulosics, Wool, and Down.
    KappAhl Sverige AB
                                                                                                                                    4. See the MCI website and our methodology for further details.
    Kathmandu Limited
    KID Interiør AS
    KnowledgeCotton
    Apparel
    Levi Strauss & Co.
    Loomstate, LLC
    Marks and Spencer
    MEC
    Mini Rodini
    MUD Jeans
    Naturaline

16 ••Textile Exchange © 2020              Contents                                                                                                                                                                                                Material Change Insights Report•• 17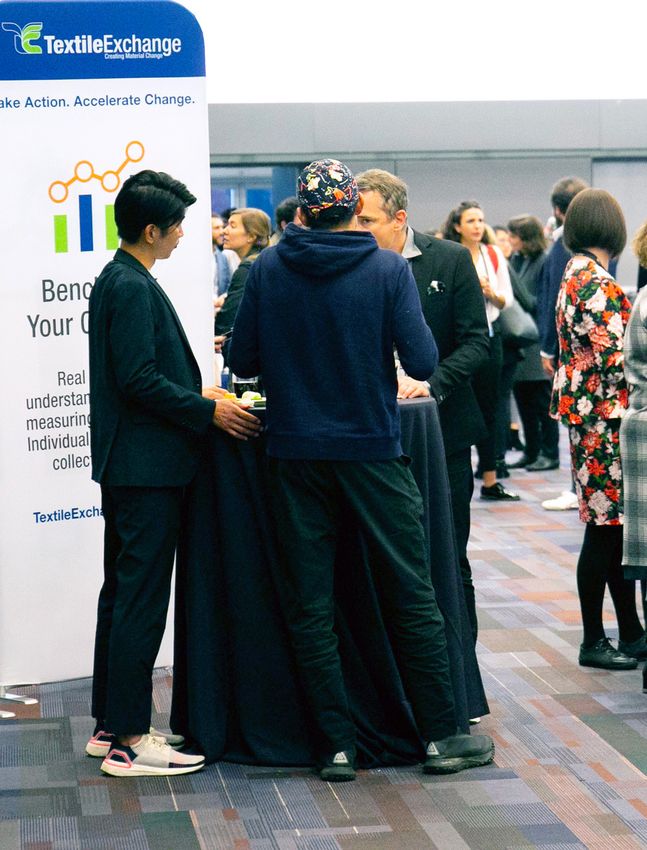
Part A:
                                          Analysis

18 ••Textile Exchange © 2020   Contents              Material Change Insights Report•• 19
Business Integration
Strategy Strategy
Analysis Highlights Deep dive into data Analysis Highlights Deep dive into data
1. Strategy - Table stakes for business 4. Materiality - Climate dominates, while biodiversity is increasing in importance
Almost all participants (96%) have a materials strategy, with the majority (76%) integrating materials Climate change is the top materials-related business risk identified by participants. The risk list is derived
into corporate strategy, indicating that materials sustainability is not an add-on but considered core from companies disclosing their top 5 most significant materials-related risks. Other responses include
to business for many. Leading companies (33%) have aligned strategies with the UN Sustainable availability of preferred materials and consumers no longer valuing sustainability.
Development Goals (SDGs).
Public commitments growing
Over half (58%) of companies are signatories to one or more industry-wide or global commitment,
most commonly the Global Fashion Agenda’s Circular Fashion System Commitment (27%), Science
Climate change Water Human rights Resource scarcity Chemicals Forests & Biodiversity
Based Targets (24%), United Nations Fashion Industry Charter (24%), United Nations Global Compact 74% 50% 47% 42% 42% 35%
(22%), and the Sustainable Development Goals (12%). Other important global commitments made by
participants include the Transparency Pledge and the We Mean Business Climate Action Commitment.
Risk and opportunity assessments still not the norm
36% of companies assess the risks and opportunities across all materials used, a similar share (37%)
focus on their key materials, while 7% do not assess risks at all. Around half of companies carry out a
materials-related risk assessment outside of their business risk review. The most commonly consulted
stakeholder group during materiality assessments are suppliers (94%), followed by employees (85%),
non-profits (76%), independent experts (58%), and feedstock producers (53%). Companies typically
conduct a qualitative assessment (69%), with 39% quantifying risk and 18% undertaking a monetized
assessment (e.g. Environmental Profit & Loss). Many companies make use of decision-making tools
to quantify impacts - with the majority using Life Cycle Assessments (49%) or the Sustainable Apparel
27% 24% 24% 22% 12% Coalition's Higg Materials Sustainability Index (47%).
Signatories to the 2020 Set science-based targets Signatories to the Signatories to the United Signatories to the United
Circular Fashion System for greenhouse gas UNFCCC Fashion Industry Nations Global Compact Nations Sustainable
Commitment reduction Charter for Climate Action Development Goals 5. Customer Engagement - Communications go beyond product labeling
Participants reported very high rates of customer engagement, with only 7% not having any
communication at all with consumers about their use of preferred materials. The most common form
2. Leadership - Accountability concentrated at the top of communication was via product labeling, some using third party certification logos (35%) but more
Accountability for delivering materials sustainability strategies is held at the top, with 42% of companies through their own labeling (64%). Beyond labeling, 70% of companies are supporting customers in their
saying accountability resides with the C-suite, and a further 40% reporting accountability at senior learning process (through campaigns, Earth Day, etc.), and 53% encourage customers to ask questions
management/director level. Within the survey year, 66% of Chief Executive Officers publicly demonstrated both online and in-store. Multiple companies mentioned having sustainability articles embedded within
leadership in materials sustainability; 62% published materials-related statements in annual reports, 55% brand magazines and catalogues as well as dedicated blog articles related to sustainability where
advocated for materials change and 45% of corporate leaders presented at a major conference. consumers can post comments and ask questions.
3. Internal Engagement - Responsibility distributed across multiple teams 6. Reporting - Common but data assurance less so
Responsibility for materials sustainability has been assigned across multiple departments in 87% of 51% of participants report on materials via their sustainability reports, 13% using an integrated report
companies. Respondents said that responsibilities remain with the sustainability team and/or sourcing approach and 11% via financial reports. 24% report through other means e.g. embedded in general
and product teams, although a healthy 67% of companies engage their marketing and communications website content. 10% of companies do not publicly report on materials-related sustainability activities.
staff as well. Slightly fewer include their retail staff. High numbers of staff receive regular training on Only 24% of participants seek data assurance by an independent third-party, the majority (58%) rely on
materials sustainability (81%). However, fewer (51%) have set employee or team performance targets internal reviews and 18% do not validate data at all.
for materials sustainability, and only 24% provide incentives or rewards for meeting sustainability targets.
An opportunity for increased engagement is with the C-suite and board. Only 47% of companies have
embedded materials-related engagement activities (training, performance targets, incentives) into the
C-suite and only one third include board members.
20 ••Textile Exchange © 2020 Contents Material Change Insights Report•• 21Business Integration
Strategy Strategy
Company Highlights Leveling Up Your Materials Strategy
• One company has set goals for all its priority fibers and continues to expand its understanding of the
impacts of its entire portfolio. The company is committed to building a more circular apparel system
by fully integrating preferred fibers into the business, working with its suppliers to reduce production
impacts, increasing its sourcing of recycled textile fibers, and creating systems to recover and reuse
materials.
• A number of CEOs are demonstrating sustainability leadership through annual reports, with one CEO
referencing climate change, circularity and SDGs in their opening remarks. While another company's
Chief Marketing Officer gave public talks on its preferred fiber commitments, traceability and its
social impact initiatives.
• One holding company has an annual sustainability award for its "best" performing brand. Those
brands that show leadership and progress towards company goals are highlighted in the company's
sustainability report.
• Through consumer engagement one company learned that targeting ocean plastics and increasing
the use of biobased materials to reduce reliance on fossil fuels were key opportunities for the
business to explore.
Photo: C&A AG
Companies with strong materials strategies take a systematic approach to integrating preferred fibers
and materials and align their strategies with global efforts like the Sustainable Development Goals (SDGs)
and the transition to a circular economy. But these aren’t the only commonalities; here are a few other
strategic approaches that leaders factor in:
They commit to change. Leading companies set measurable targets for their overall materials use or
by fiber. The most progressive organizations link their targets to global agendas like the SDGs or Science
Based Targets, and they make public commitments to keep themselves accountable.
They get everyone on board. Actually meeting targets requires alignment and buy-in across the
organization. Business leaders need to become change advocates, convincing investors and equipping
and incentivizing buyers and designers so they’re set up for success.
They invest in collective action. Top-performing companies work with others to drive meaningful
change and invest in collective action alongside governments, industry bodies and peer companies. They
share their learnings widely so that other companies can benefit from them.
Full story: https://mci.textileexchange.org/discover/strategy/
22 ••Textile Exchange © 2020 Contents Material Change Insights Report•• 23Business Integration
Sustainable Development Goals Sustainable Development Goals
Analysis Highlights Deep dive into data Analysis Highlights Deep dive into data
What are the Sustainable Development Goals? Leadership - Accountability mostly at the top
Accountability for delivering the SDGs has been assigned by 57% of companies and split evenly between
The 2030 Agenda for Sustainable Development, was adopted by all United Nations Member States in
CEOs (24%) and senior management (23%). A small number of board members have also been assigned
2015, providing a shared blueprint for peace and prosperity for people and the planet, now and into the
accountability for delivering the SDGs (8%).
future. At its heart are the 17 Sustainable Development Goals (SDGs), which are an urgent call for action
by all countries (i.e. countries with both developed and developing economies) in a global partnership.
Employee Programs - Few communicate SDGs to employees
They recognize that ending poverty and other deprivations must go hand-in-hand with strategies that
Implementation of the SDGs into employee programs is just beginning as only 17% of companies have
improve health and education, reduce inequality, and spur economic growth – all while tackling climate
started to do so. Raising awareness and engaging the entire organization in the vision and purpose of the
change and working to preserve our oceans and forests.
SDGs will be essential to their delivery.
Strategy
Materiality - Not yet standard to incorporate SDGs in risk and opportunity assessments
Very few companies (39%) are using an SDG lens when assessing materials-related risks or opportunities
Alignment - Overall business strategy alignment not yet widespread
and even fewer (27%) have integrated the SDGs into stakeholder consultation.
33% of companies have aligned their business strategy with the Sustainable Development Goals
(SDGs). This result indicates that companies are struggling to identify what alignment means for them
Customer Engagement - Rare to communicate SDGs to consumers
and others believe their strategies and engagement are comprehensive, but they have not considered
Customer engagement is rare with only 4% of respondents actively engaging their customers on the
an SDG alignment (or the need for it). Given that the SDGs represent the globally agreed most pressing
SDGs, however an encouraging 18% have started planning. Engaging and inspiring people to participate
environmental, social and economic issues and given the urgency to address major sustainability risk
in “the world we want” will be an important lever for meeting the SDGs. Opportunities are there for
and turn it into opportunity within the next decade, SDG alignment provides a mapping opportunity and
companies to play a pivotal role in SDG awareness by connecting customers to the Goals.
strategic north star.
Reporting - Very few companies report against the SDGs
Tracking progress - Most measure progress against at least one SDG
The majority of companies (54%) are yet to start any form of SDG-related corporate reporting. 26% have
Despite lack of holistic alignment, 61% of engaged companies are measuring progress towards one
started and provide general information, 12% are more focused and reporting their SDG-related activities,
or more of the 17 SDGs. However only 11% track the outcomes and impacts of company activities
yet only 8% are disclosing progress against SDG targets.
related to the SDGs. Increased integration is needed to ensure targets are set with SDGs in mind, and
companies actively track performance against these targets.
Circularity
SDG prioritization - SDG 13 Climate Action shifting up the agenda
Alignment of circularity strategies with the SDGs - Starting to see momentum
66% of respondents have set SDG priorities. Within this group, SDG 12: Sustainable Consumption and
The transition from a linear to a circular economy will play a significant role in meeting the Global Goals.
Production is the Goal which most directly links to the actions of the textile industry and is the most
22% of companies have already aligned their circularity strategy with the SDGs, and a further 26%
frequently prioritized (93%). SDG 13: Climate Action sits in second place (80%) and SDG 8: Decent Work
indicated that plans are in place. SDG alignment with circularity may prove an interesting opportunity
and Economic Growth is a close third (76%), echoing the industry’s commitment to climate action and
for collaboration within and beyond the textile industry, including inter-industry innovation. SDG 12:
ambition to protecting workers throughout company supply chains. The benchmark program has been
Sustainable Consumption and Production is an obvious fit with circularity. In particular, alignment of
tracking SDG priorities since 2017 and seen Climate Action shift up in importance over the years.
quantifiable actions with SDG targets 12.2: Sustainable Management And Use Of Natural Resources and
12.5: Substantially Reduce Waste Generation.
Investment - Few invest in SDG-related funds
Results show its early days for mobilizing SDG-related funds, with 75% of participants not yet making
a connection. Those that are investing are doing so through corporate funds such as Corporate Social
Responsibility (CSR) budgets (17%). Other investments are made through private-public partnerships
and philanthropic spending. It is important to note that the role of impact investment and the number of
financial schemes for the SDGs is evolving rapidly. As the financial sector (banks, asset managers, private
and institutional investors) is getting more deeply involved, new and innovative investment options, such
as blended financing, and green or social bonds pertaining to the SDGs, are becoming available.
See the benchmark SDG Companion Guide for more details.
24 ••Textile Exchange © 2020 Contents Material Change Insights Report•• 25Business Integration
Sustainable Development Goals Sustainable Development Goals
Company Highlights Leveling Up Your Material Strategy’s Alignment With The SDGs
• As part of aligning its strategy with the SDGs, one company mapped its strategic focus areas against
the 17 Goals and set targets where alignment is the highest. The company has put in place key
indicators from which it tracks and reports progress. Indicators were selected based on the Global
Reporting Initiative's: Business Reporting on the SDGs: An Analysis of Goals and Targets, and posted
on the GRI's Reporting on the SDGs Action Platform. The company uses this platform to share
experiences and best practices with others across different sectors.
• One company conducted an enterprise-wide materiality assessment and discovered that its risks
and opportunities were tied to nearly every SDG. Four key areas were identified: climate change,
water, chemicals, and labor. The assessment fed into the strategic direction of its sustainability
program, which is now focused on embedding SDGs into the business. The entire company
was informed of these commitment areas through presentations and other media. Ongoing
conversations take place with supply chain leadership teams and the company is investing in a
strategic response to climate risk as well as optimizing its social initiatives.
• One company has integrated the SDGs into its employee well-being programs and volunteer work
(SDGs 1, 3, 4, 5 and 8) and is looking to roll out these programs to its Tier 1 suppliers.
Photo: Gap Inc.
The textile industry has a powerful opportunity to shift the needle by contributing to global efforts around
the UN Sustainable Development Goals (SDGs). Companies who align their strategies with the SDGs not
only position themselves as business leaders, but can also reframe their achievements as wins for the
world. Here are some activities that top-performing brands in the SDG category have in common:
They embed the SDGs into business. Leading brands use materiality assessments or plain old
conversations to engage all stakeholders in developing strategies around the SDGs.
They leverage spheres of influence. Some brands double down on “priority SDGs” that resonate
more strongly with their business and stakeholders. They tap organizations in their supply chain to bring
diverse perspectives to the table — particularly important when tackling complex sustainability challenges
in sourcing regions.
They partner for change. The SDGs are shared goals, so forming cross-sector and cross-industry
collaborations is essential. Leading companies not only partner with others, but also initiate working
groups, coalitions and platforms that inspire collective engagement.
Full story: https://mci.textileexchange.org/discover/sdgs/
26 ••Textile Exchange © 2020 Contents Material Change Insights Report•• 27Business Integration
Circularity Circularity
Analysis Highlights Deep dive into data Analysis Highlights Deep
Deep dive
dive into
into data
data
1. Strategy - Growing ambition 5. Textile Collection - Customers engaged to recapture value
This is a time of rapid change in the recognition of a need for a circular textile system. Just two years ago, Textile collection at end of use is a crucial circularity enabler, capturing the output materials that must form
when Textile Exchange first asked about circularity, only 21 of the respondents said they had a circularity the input feedstocks for both reuse and recycling loops, and nearly 50% of respondents offer collection
strategy in place. In 2018, that number increased to 37 companies (with an additional 35 having a services, either through their retail channels or third-party collection partners. To help these materials
strategy in development). In this year’s benchmark, 74 companies completed the expanded circularity make their way back into the textile value chain, companies should increase downstream traceability and
module, and 64 of those reported a circularity strategy in place (86%). transparency: only 31% can identify what happens to the collected textiles. The low rate of monitoring
and evaluation (16%) of these schemes indicates that while beginning collection is an important first step,
Accountability and resource allocation lags behind ambition, as only 9% have assigned senior level the textile industry must do much more to ensure that the collected materials are truly diverted from the
responsibility. And while 86% have a circularity strategy, less than half that percentage invest in circularity waste stream – not just delayed.
arenas that are critical to closing the loop, with 41% investing in innovation or technology, and 34% in
supply chain operations. 6. Recycled Content - Most reclaimed materials used in textiles is waste from other industries
To transform materials from linear waste to circular resource, companies must signal dramatically
2. Resource Use - Minimal engagement in tracking or reducing waste increased demand for recycled materials, especially those recycled from textile feedstock. In 2018, 6%
Despite significant progress in strategy, only 5% of respondents reported having an explicit goal related to of fiber uptake was recycled - a significant step in the right direction. However, given the fiber breakdown
the absolute reduction of fiber/material use (an additional 19% are working towards the reduction of fibers and current state of recycling technology, very little of that 6% comes from textile sources. So, where
and materials use relative to economic growth). Without this important end goal in mind, circularity-related will the 4.4 million tons of fiber sourced in 2018 by this group of companies end up when the users are
activities may not reach the full potential of their positive impact. finished? Collection schemes are enabling one or two additional lifecycles via reuse - an essential first
step. But the textile system will not be truly circular until companies can source end-of-life textile material
Changing consumption habits and revenue drivers to reduce the industry's dependence on virgin as the feedstock for new products.
resources seems like an overwhelming challenge to many companies. Reducing over-production of
goods that are never sold may be a more "low hanging fruit". To reach this fruit, companies will have
to increase tracking systems and transparency around unsold goods. 74% could not report any data
on unsold goods, and 11% could report only incomplete data or a rough estimate. Of the 14% who The state of circular textile systems in 2018
could report volumes, the majority were no-collection/on-demand production models, with very minimal
inventory to report. Overall, the volume of unsold goods remains opaque through several companies Uptake Disposal
mentioned an intention to begin tracking this data in the next year.
Conventiona
l raw mater
3. Design for Circularity - Awareness is high ials
61%
Awareness of circularity as a design practice is high, with 80% of respondents reporting at least one 84.8% Waste
design strategy for circularity in practice. However, coverage is still low: 28% report that the majority of 99.9%
their design teams are trained in circular design, and only 15% include circularity aspects in their design
briefs. Preferred, renewable raw materials 33%
15.2%
Designing products that can be recycled into next lifecycles is hampered by a lack of clear standards and Non-textile inputs 5.8% *6%
**Collection
Recycled 15.1%
best practices – 35% of respondents report designing products for recyclability and/or biodegradability,
materials uptake
but only 4% used a certification scheme related to those aspects (several more companies initially Pre-consumer 0.6 %
0.06%
textile inputs Textile 0.06%
reported certification schemes, but referred to recycled content (input) certifications, rather than inputs
Extended
0.59% life cycles Recycled
recyclable product (output). textiles
0.06%
Post-consumer
4. Business Models - Repair leads textile inputs
New business models are scaling in only a handful of innovative companies thus far but stood out as an Textile circularity (maximum): 0.06%
approach with a surprising level of engagement from a wide range of brands, with 62% extending the first
life of products through innovative business models. Repair is the main offerings in this arena, with 38%
offering repair services of some kind. Apparel and outdoor companies lead the way in repair offerings. * Recycled materials percentage of total uptake rounded from 6.4%.
** Collection: EPA industry estimated recycling rate, 2017.
Source: https://www.epa.gov/facts-and-figures-about-materials-waste-and-recycling/textiles-material-specific-data
28 ••Textile Exchange © 2020 Contents Material Change Insights Report•• 29Extra Insight
Circularity Circularity
A First in Benchmarking Circularity Leveling Up Your Circularity Strategy
When it comes to GHG emissions, water, and land use, sourcing virgin raw materials is often the
most impactful part of a textile company’s supply chain. Circularity is a powerful lever to decouple
economic growth from resource consumption, enabling a reduction of virgin material impacts.
Combined with the use of preferred where virgin fibers are required, circularity can support a truly more
sustainable portfolio.
To develop a framework for benchmarking circularity, we referenced both general and industry-specific
principles, aiming for a robust yet accessible approach. Circularity requires both inputs that are
“circular ready” and a circular system for those inputs to flow through - it cannot be achieved
through material choices alone. Our circularity module covers all components of that system – not just
the material inputs or outputs.
As an area of rapid innovation, circularity often makes headlines – but how do we know whether true
progress has been made, or how far we still have to go? This year’s benchmark data is the most
comprehensive measurement of industry progress on circularity to date. We’ve measured the rapid
growth of circularity ambitions, as well as the barriers to truly closing the loop. Completing the circularity
module can help brands and retailers identify the gaps in their circularity performance. It can also inform
the development of more comprehensive strategies.
Having established baseline metrics across such a wide range of circular strategies in this first circularity
module, the Material Change Index can now effectively illuminate the road towards a more circular textile Photo: Tchibo GmbH
sector, designed for a truly sustainable future. While designed specifically for textile brands and
retailers, the circularity module also provides a valuable framework for assessing any industry’s The transition to a circular fashion system has the potential to unlock huge economic opportunity for
collective and individual progress on circularity. brands willing to innovate and invest in new ways of doing business. Companies with circularity strategies
often start by incorporating recycled materials into product collections, ideally traced to the source
Corporate Citizenship has partnered with Textile Exchange on this work because supporting brands, through “chain of custody” standards. Strategies might also include designing products for disassembly
retailers, and supply chain partners in their sustainability journey must include guidance on circular or recyclability, managing demand and providing services to extend a product’s life. Here are some
thinking. We believe that the industry can be a catalyst of radical change - by pioneering responsible activities that top circularity performers have in common:
businesses, transforming the systems on which it relies, and maximizing value to society. Acting as critical
friends, we aim to translate ambition into practical action. They explore new business models. Leading brands take a systems-thinking approach and are
incorporating new business models like rental, alternative markets for unsold goods, and recommerce
and extended product responsibility.
Cory Skuldt, Associate Director (North America)
Corporate Citizenship They invest in innovation. The industry needs new solutions to recycle textiles back into textiles without
degrading quality. Leading brands are investing in research and development and engaging in pre-
competitive collaborative initiatives to close the loop.
They push the industry forward. Leading brands share their learnings with others, treating the results
Guidance and principles referenced:
of any internal innovation as an opportunity to lead industry transformation — not just a competitive
Biological/Technical Cycles - Ellen MacArthur Foundation advantage. Through industry groups, they collaborate with other changemakers to drive the entire
Circular Materials Framework - Fashion Positive+ industry’s progress forward.
Cradle to Cradle Principles - C2C Certified
7 Key Elements – Circle Economy Full story: https://mci.textileexchange.org/discover/circularity/
Circularity Roadmap for Apparel Brands – FWD Impact
30 ••Textile Exchange © 2020 Contents Material Change Insights Report•• 31Business Integration
Strategy, SDGs and Circularity
The companies listed here have reached a Level 4 Leading position in the overall Material Change Index (MCI)
and related themes: Strategy, Sustainable Development Goals (SDGs), and/or the Circularity Index of the MCI.
Material Strategy Sustainable Circularity
Change Index & Integration Development Goals
Company (alphabetical) Level 4 Leading Level 4 Leading Level 4 Leading Level 4 Leading
AB Lindex
adidas AG
Coyuchi, Inc.
C&A AG
DECATHLON SA
EILEEN FISHER, Inc.
Gap Inc.
H&M Group
IKEA of Sweden AB
Inditex Group
Kathmandu Limited
Levi Strauss & Co.
Loomstate, LLC
MUD Jeans
Naturaline
NIKE, Inc.
Norrøna Sport
Nudie Jeans
Patagonia
prAna
PUMA SE
PVH Corp
Stanley/Stella SA
Stella McCartney
Tchibo GmbH
The Burton Corporation
Williams-Sonoma, Inc.
Table notes:
1. MCI result is derived from the CFMB survey responses to the full survey, including Strategy and Integration, SDGs, Circularity, and Materials Portfolio.
2. Family of Indices listed separately include: Strategy and Integration, SDGs and Circularity.
3. Level 4 Leading companies are pioneering industry transformation and scored 76-100 out of 100 possible points.
32 ••Textile Exchange © 2020 Contents Material Change Insights Report•• 33Materials Portfolio
Cotton Cotton
Analysis Highlights Deep dive into data
6%
1. Risk Management - Policies common but direct intervention low 292,825 tons CO2e
76% 74% 1.4 million tons Global of greenhouse gas
The highest reported risks in cotton cultivation are pesticide exposure, soil degradation, child labor, warming emissions saved
water (scarcity and pollution) and biodiversity loss. Climate change is interconnected to other risks of participants completed of participants had a 57% of cotton was
the cotton module in 2019 100% target for more sourced from preferred
but is explicitly identified as the sixth largest cotton cultivation risk. Most companies use certification
sustainable cotton cotton programs 4.8 million tons CO2e
(91%) or have policies in place (72%) to mitigate risk. Direct intervention at farm level is low (17%). Risk
assessment and management at the processing level (ginning of seed cotton and shredding for recycled) 5.1 million tons CO2e
is low, with policy and certification being the main mitigation tools (26%). The highest reported processing
Participants' actual use*
risks were child labor, forced labor, and health and safety. Also listed were risk of contamination (such as
Conventional equivalent
GMOs in non-GMO cotton and chemicals) and risk of unauthentic documentation of certified cotton.
* Includes: conventional, CmiA, organic, recycled cotton
647,026 hectares 279,430 25,487 tons (Higg MSI)
2. Investment - Need to go beyond payment of certification fees to more impactful investment
of land was under farmers participated of cotton waste was
More than half of respondents are investing in their cotton supply base (53%), i.e. investing beyond organic or improved land in growing more diverted from waste streams
View online dashboard
certification and administration costs. Investments are primarily financial (51%) and multi-stakeholder management sustainable cotton
(which aligns with the low results for direct intervention in the supply base as noted above) and include
joining initiatives such as the Organic Cotton Accelerator and Make Fashion Circular's The Jeans
Redesign. Overall, fewer companies said they invest directly in innovation when it comes to cotton (20%). Company Highlights
3. Transparency - More work to do on regional transparency • One company mapped cotton cultivation to specific locations and water basins and conducted water
Most companies could identify country of origin for some of their cotton (78%), however, by volume, footprinting to better understand the water intensity and water scarcity risk of its cotton sourcing. The
approximately 46% of cotton sourced did not have any regional transparency. The regional risk profiles company expects to continually map this to understand how its impact changes over time.
of cotton producing countries are very different, therefore human rights and environmental risks are • In partnership with the Fair Labor Association (FLA) and Iyi Pamuk Uygulamalari Dernegi (Good
potentially not sufficiently mitigated. Cotton Practices Association), seven companies invested in a program to address social risks and
labor conditions at Turkish cotton farms, and designed interventions to address labor gaps.
4. Targets - Portfolio approach to cotton targets the norm
Almost three-quarters (74%) of companies have set "100% more sustainable" cotton targets with 31% • One company sponsored the International Space Station (ISS) Cotton Sustainability Challenge
sourcing 100% preferred already. Only 8% had no preferred cotton uptake targets. The majority of providing researchers with grants to test its ideas for improving crop production and water
companies set targets at the portfolio level (i.e. sourcing from multiple cotton programs). However, some sustainability on Earth using ISS' technology. The project was recognized among Fast Company’s
companies have set more specific targets, e.g. 100% certified organic, and, in one case, going beyond World Changing Ideas of 2019 and was honored with the Space Pioneer Award at the Kennedy
uptake targets to 100% traceable to farm. Space Center. The company hopes that the research will lead to breakthroughs and collaborations
that enhance overall cotton sustainability.
5. Uptake - Growing “preferred renewable” sourcing • One company’s main fabric supplier is providing traceability back to the farm; the company is now
Over half (56%) of the cotton sourced by reporting companies was "preferred renewable" (e.g. coming requesting this of its other suppliers. Most of the company’s recycled cotton comes from its own
from programs such as the Better Cotton Initiative, Cotton made in Africa, organically grown cotton, and production waste.
others). Only 1% was recycled and the remaining cotton use was reported as "conventional". There were
• One company is trialing organic post-consumer recycled products, sourced from its own take-back
nearly twice as many companies sourcing organic cotton as there were BCI, indicating that while the
scheme. The company has a target to increase volumes in the future.
scale is achieved by sourcing BCI, organic is important to many brands, and a portfolio approach of one
or more preferred cottons is common.
6. Impact Monitoring - Measurement remains a challenge
More than half of companies use industry tools such as the Sustainable Apparel Coalition's Higg Materials
Sustainability Index (Higg MSI) for impact measurement (53%). Considerably fewer are directly monitoring
at farm level, either through collecting qualitative data or quantitative data, or a mix of both. 24% are not
monitoring sustainability impacts at all. Further, it remains challenging for companies to quantify impact
savings from their specific supply chains as 57% were unable to do so.
34 ••Textile Exchange © 2020 Contents Material Change Insights Report•• 35You can also read