Methodology for the Seafood Stewardship Index - March 2021 - World ...
←
→
Page content transcription
If your browser does not render page correctly, please read the page content below
Methodology
for the Seafood
Stewardship Index

March 2021
Foreword

Planetary health and human well-being depend on ocean health and              in the world, the Seafood Stewardship Index (SSI) aims to identify
well-functioning aquatic ecosystems. Indeed, the key role of the oce-         how the private sector is contributing to this transition, where com-
ans in achieving sustainable development is now widely recognised,            panies are on the right path and where they can do better. The first
as reflected in global targets and agendas such as UN Sustainable             iteration of the benchmark revealed that even though great strides
Development Goal (SDG) 14 (life below water) and the Sustainable              have been made since the emergence of the sustainable seafood
Ocean Plan released by the High Level Panel for a Sustainable Ocean           movement in the late 1990s – such as increased market demand for
Economy. The ocean and its coastal interface provide a number of              certified seafood and fishery improvement projects – there is still a
ecosystem services such as climate regulation; cultural activities;           long way to go, especially when it comes to traceability and social
economic activities such as fisheries, marine transportation, trade and       responsibility. Although many companies have commitments and
fuel; nutrient cycling and primary production; genetic resources and          policies in place, it is still unclear to what extent companies are fulfilling
potential new medicines; and various resources to support human life          these commitments and implementing these policies. Now is the time
such as food and energy. However, the health of the oceans and thus           for action and true stewardship.
their ability to support life on earth is under threat from ocean and land-
based pollution, overfishing, climate change and ocean acidification,         This revised methodology is thus focused on rewarding impact and
to name a few.                                                                performance, with a number of indicators requiring evidence of impacts
                                                                              associated with the various activities that companies are implementing,
The seafood industry is one of the key sectors of the ocean economy           whether improvement projects, policy advocacy or participation in
as it supports the employment of more than 600 million people and is          a pre-competitive platform. Moreover, the methodology now also
an important source of food for over 3 billion people. At the same time,      rewards stewardship, which we define as ‘taking responsibility’. This
the industry is responsible for a number of environmental and social          means that the Seafood Stewardship Index not only rewards com-
impacts that jeopardise not only its own economic sustainability but          panies that perform well but also those that have set robust goals in
also the future of millions of people who rely on it for their livelihoods    line with the SDGs and can demonstrate credible progress towards
and as a primary source of food and nutrients.                                those goals within a reasonable timeframe. Lastly, given the role of
                                                                              seafood in the wider food and agriculture transformation, the Seafood
All stakeholders have a role to play in supporting the transition to          Stewardship Index has become a spotlight benchmark in the World
a more sustainable and responsible seafood industry, and thereby              Benchmarking Alliance’s (WBA) broader food and agriculture trans-
supporting the achievement of the Sustainable Development Goals               formation. This has required some alignment in terms of expectations
(SDGs). By assessing the 30 most influential seafood companies                and indicators, which is explained later in the document.

                                                                                                                                                               2
Foreword

We thank all of those who provided feedback and input on the earlier
draft of this methodology. As we prepare to release the second itera-
tion of the Seafood Stewardship Index later in 2021, we look forward
to working with you and the wider sustainable seafood community
to transform the seafood industry in a way that supports inclusion,
equality and long-term ocean health.

Helen Packer                           Rik Beukers
Lead                                   Research Lead
Seafood Stewardship Index              Seafood Stewardship Index

                                                                        3
Table of contents

                    Foreword                                                             2
                    Setting the scene: Seafood and WBA’s food and agriculture
                    transformation                                                       5
                    	About the World Benchmarking Alliance                              5
                        The food and agriculture transformation                          6
                        The role of seafood in the food and agriculture transformation   7
                        Keystone companies                                               7
                    The Seafood Stewardship Index                                        9
                        Theory of change                                                 9
                        Scope of the benchmark                                           12
                        SDG scope                                                        12
                        Industry scope                                                   13
                        Company scope                                                    13
                    Methodology and benchmark development                                16
                        WBA’s benchmarking cycle                                         16
                    	Dialogue and research: Alignment with other benchmarks,
                        standards and reporting initiatives                              16
                        Methodology development and review                               16
                        Data collection                                                  17
                        Verification and analysis                                        18
                        Process and timeline                                             19
                    Analytical framework for the Seafood Stewardship Index               20
                        Measurement areas and indicators                                 20
                        Approach to scoring and weighting                                20
                    Indicators for the Seafood Stewardship Index                         23
                    Measurement area A: Governance and strategy                          24
                    Measurement area B: Ecosystems                                       27
                    Measurement area C: Traceability                                     35
                    Measurement area D: Social responsibility                            39
                    Acknowledgements                                                     48
                    Annexes		                                                            49
                        Annex 1: Review and consultations                                49
                        Annex 2: WBA guiding principles                                  54
                        Annex 3: SDG targets in scope of the benchmark                   56
                        Annex 4: Key concepts and definitions                            60
                        Annex 5: Key resources and references                            65
                        Annex 6: Other references                                        69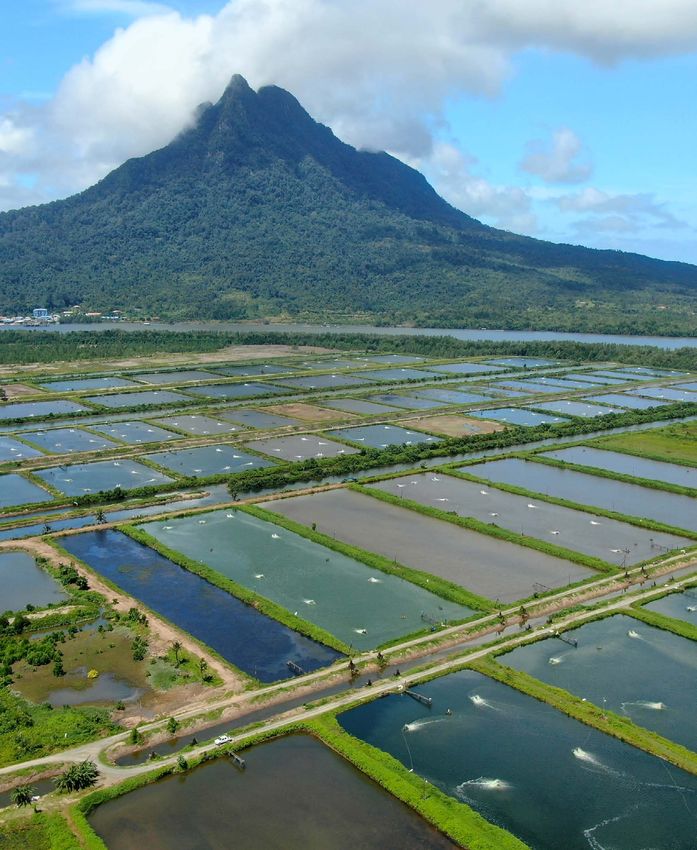
Setting the scene: Seafood and WBA’s food and
agriculture transformation

About the World Benchmarking Alliance                                        FIGURE 1: WBA's seven systems transformations

WBA is a diverse and growing group of organisations from across
the globe, motivated by the common ambition to create a world that
                                                                                                        ANCIAL SYSTEM
works for all – as embodied by the SDGs. We share the vision that                                    FIN
achieving these goals requires a systems perspective, as each of the
17 SDGs are interlinked. We also agree that the private sector has a
                                                                                                     DECARBONISATION
key role to play if we are to achieve systemic transformation.                                         AND ENERGY

WBA uses a systems approach to develop its benchmarks, placing a
strong emphasis on transforming the systems that have the greatest
potential to drive economic, environmental and social progress. Systems                   URBAN                               FOOD AND
thinking helps us make better sense of the issues, as well as identify the                                                   AGRICULTURE
most influential companies in each system. By 2023, WBA will have                                          SOCIAL
benchmarked 2,000 companies – the SDG2000 – across seven systems
transformations that we believe are vital for putting our society, planet
and economy on a more sustainable and resilient path over the next
decade and beyond (see Figure 1). Benchmarks will be produced for
                                                                                                 DIGITAL           CIRCULAR
all seven systems, with accompanying methodologies to evaluate and
support systems change.

Social transformation sits at the core of our model because it repre-
sents topics such as human and labour rights that are fundamental
to achieving the SDGs, irrespective of the sector or transformation. For
this reason, all SDG2000 companies will be assessed on relevant social
topics, including the companies in the Seafood Stewardship Index.

                                                                                                                                           5
Setting the scene: Seafood and WBA’s food and
agriculture transformation

The food and agriculture transformation                                    Index. While the Food and Agriculture Benchmark focuses on breadth
                                                                           in terms of company scope and indicators, WBA recognises the need
Transforming the food system requires action across all related sectors    for an in-depth evaluation of particular industries and their specific
and industries. Given that the system is so interwoven, business leader-   issues through spotlight benchmarks. The Seafood Stewardship Index
ship is vital to ensure that all companies play their part, acknowled-     and the Access to Seeds Index serve this purpose. Both spotlight
ging their purpose and strengths within the value chain. Good business     benchmarks are developed under the umbrella of the food and agri-
leadership can help provide better access to healthy diets while           culture transformation but operate in their respective industry and
protecting the environment and leaving no one behind by creating fair      stakeholder ecosystems (see Figure 2). Alignment of methodologies
and equitable operations and value chains. Within the food and agri-       is sought where appropriate. In the third quarter of 2021, WBA will
culture transformation, WBA has taken a multi-level approach that          publish the first Food and Agriculture Benchmark, the second Seafood
includes a broad Food and Agriculture Benchmark and two spotlight          Stewardship Index and the third Access to Seeds Index.
benchmarks: the Seafood Stewardship Index and the Access to Seeds

FIGURE 2: SCOPE OF WBA’S FOOD AND AGRICULTURE BENCHMARK AND SPOTLIGHT BENCHMARKS

                                                        FOOD AND AGRICULTURE BENCHMARK

                              Agricultural                                 Food and beverage
     Agricultural                                         Animal                                           Food               Restaurants and
                             products and                                    manufacturers/
       inputs                                             proteins                                       retailers              food service
                             commodities                                       processors

                                                          Seafood
     Access to
                                                        Stewardship
    Seeds Index
                                                           Index

                                                                                                                                                    6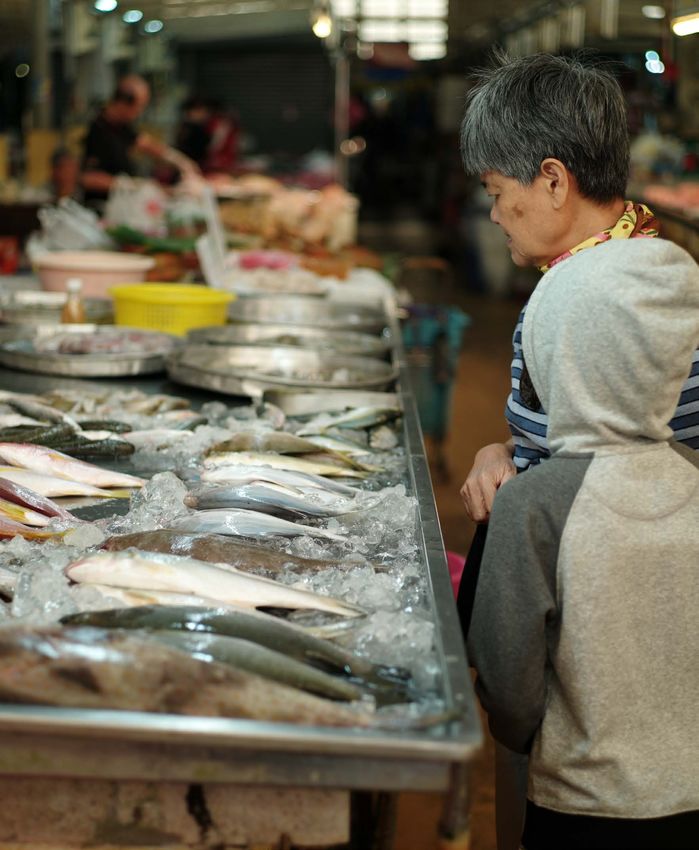
Setting the scene: Seafood and WBA’s food and
agriculture transformation

The role of seafood in the food and agriculture                               contributions to the achievement of SDG 2 (zero hunger), SDG 14 (life
transformation                                                                below water) and their interlinkages with SDG 1 (no poverty), SDG 5
                                                                              (gender equality), SDG 8 (decent work and economic growth), SDG 12
Seafood plays a crucial role in nourishing populations and supporting         (responsible consumption and production) and SDG 15 (life on land).
livelihoods all over the world, especially in developing countries.
Aquatic foods not only provide 3.3 billion people with 20% of their           Yet despite the global importance of seafood in providing nourishment
animal protein, but they also contain a variety of essential vitamins,        and employment and its potential contribution to a sustainable food
micronutrients and healthy omega fats. Recent estimates by the Food           system, fisheries and aquaculture face a number of social and environ-
and Agriculture Organization of the United Nations (FAO) indicate that        mental challenges. These include overfishing, climate change, ocean
198 million people are employed along the seafood value chain from            pollution, antibiotic resistance, impacts on biodiversity, unethical labour
harvesting to distribution, of which 56.6 million are directly employed.      practices and human rights violations. The challenges cannot be tack-
The livelihoods of 880 million people depend on the sector, most of           led by one actor or one stakeholder group alone. Therefore, overcoming
which is located in the Global South.1 Moreover, more than half               them will require collaborative efforts between governments, civil
of international trade originates in developing countries, and their          society, the financial sector and the seafood industry itself, from
share in fishery trade is increasing steadily. With a total first fish sale   producers to retailers.
value estimated at USD 401 billion and a global export value of USD
164 billion in 2018, the seafood industry is an important part of both        Keystone companies
the food and ocean economy.2 Aquatic foods have a much lower
carbon footprint and fewer biodiversity impacts compared to crops             The global trade in seafood is dominated by transnational companies
and livestock, thus holding great potential to contribute to a more           managing complex international supply chains. These companies con-
sustainable food system.3 Lastly, according to a report published by          trol a significant portion of marine catch and aquaculture production,
the Index Initiative,4 the precursor of WBA, the seafood sector was           particularly for the largest and most valuable species. Increasingly,
identified as one of 15 sectors that can make an important contri-            these companies also control large parts of the seafood value chain,
bution to several SDGs and to sustainable development as a whole.             from farming and harvesting to the production of consumer products.
Major fish stocks can be rebuilt, aquaculture offers opportunities for        Market concentration in the seafood industry is low compared to other
technological advancements and better supply chain management                 food sectors. This is changing, however, due to growing demand. The
would improve working conditions and livelihoods. Advancements                international seafood value chain is increasingly dominated by glo-
in sustainable seafood production can deliver unique and significant          bally operating companies that often produce, process and/or trade

                                                                                                                                                            7
Setting the scene: Seafood and WBA’s food and
agriculture transformation

large quantities of seafood and a wide range of fish species. Peer        food companies are involved in and contributing to with the aim of
recognition between leading seafood companies is growing, as most         improving their social and environmental performance. These include
of them have become global players active in multiple countries,          pre-competitive and multi-stakeholder partnerships to tackle forced
species and product segments. In addition to their own fishing and        labour in seafood supply chains such as Seafood Business for Ocean
aquaculture operations, these companies operate as traders, connec-       Stewardship (SeaBOS), Global Sustainable Seafood Initiative (GSSI), or
ting fisheries and aquaculture operations from around the globe to        Seafood Task Force (STF), third-party certifications such as the Marine
international markets. A 2016 publication by the Stockholm Resilience     Stewardship Council (MSC) or the Aquaculture Stewardship Council
Centre revealed that 13 transnational corporations control 11–16% of      (ASC), establishing industry-wide traceability standards such as the
the global marine catch (9–13 million tons) and 19–40% of the largest     Global Dialogue on Seafood Traceability (GDST), and aquaculture
and most valuable capture fisheries, including species. Thus, through     feed innovations. The performance of companies on different issues
their sheer size and expansive global supply chains, large seafood        varied widely, and the results revealed significant challenges that
companies (including fishing companies, aquaculture companies,            still need to be overcome for companies to achieve comprehensive
feed companies and seafood processors) have a disproportionate            oversight of both their own operations and supply chains, especially
and influential role in transforming the sector.5                         with regard to illegal, unregulated and unreported fishing, protecting
                                                                          ecosystems and respecting human rights and working conditions.
As leading seafood companies can potentially deliver a significant,       The results also showed that the industry overall needs to move
unique and actionable contribution to the SDGs, the Seafood Steward-      beyond setting commitments and developing standards to active
ship Index assesses and compares the social and environmental perfor-     implementation.
mance of the 30 largest seafood companies and the extent to which
their activities are in line with the SDGs. The companies were selected
based on revenue, international value chain networks and subsidiaries,
their position in the value chain, involvement in global governance
processes and impacts on developing countries.

Current practices and commitments demonstrate that the companies
in scope have agency to initiate major improvements, alone or in
partnership with other stakeholders. Indeed, the first iteration of the
Seafood Stewardship Index revealed a number of activities that sea-

                                                                                                                                                    8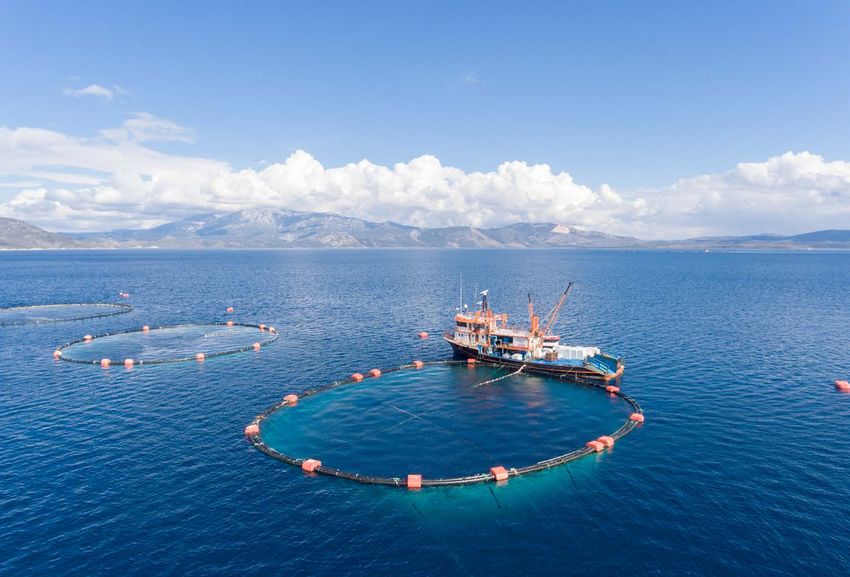
The Seafood Stewardship Index

                                The Seafood Stewardship Index and its methodology aim to take
                                companies on a stewardship journey. This starts with awareness and
                                recognition of their impacts on the environment and society, followed
                                by assessing those impacts and then implementing effective and
                                meaningful activities that not only mitigate negative impacts but
                                transform the seafood industry into one that respects and protects
                                the resources on which it depends, including human resources.

                                 What is stewardship?
                                 Stewardship can be understood as ‘the responsible use, including
                                 conservation, of natural resources in a way that takes full and
                                 balanced account of the interests of society, future generations
                                 and other species, as well as of private needs, and accepts
                                 significant answerability to society’.6 Stakeholder consultations
                                 revealed that the definition of stewardship should go beyond the
                                 responsible use of natural resources to include other dimensions
                                 such as community engagement, human rights and labour practi-
                                 ces, and fair operating practices. Ways that seafood companies
                                 can demonstrate stewardship include efficiently using natural
                                 resources, sourcing materials from sustainable origins and operating
                                 ethically, for example ensuring decent working conditions for all
                                 employees and respecting local communities.

                                Theory of change

                                One way to encourage companies to become better stewards and
                                transition to a more sustainable and responsible seafood industry is to

                                                                                                          9
The Seafood Stewardship Index

benchmark their sustainability performance. The benchmark can be                 framework on the basis of which seafood companies and their
used as a tool to understand what seafood companies are currently                stakeholders can monitor how companies are contributing to
doing and how they can improve in relation to their various impact               the SDGs. Results are made public to raise awareness, reward
areas. A legitimate and credible index can be a catalyst to drive this           positive changes and build a better understanding of the role that
envisioned transition.                                                           major seafood companies play in promoting stewardship of natural
                                                                                 resources and supply chains. By being public and transparent,
Although transparency, and thus accountability, is increasing in the             the results of the assessment are available to all stakeholders
industry, information gaps remain on the catch, production and traded            (financial institutions, companies in and outside the industry,
volumes of leading seafood companies. The Seafood Stewardship Index              governments and civil society), allowing them to monitor the
clarifies how companies can use their influential position to enable the         performance of the 30 largest seafood companies and guide their
production of more sustainable seafood, thereby promoting stewardship            engagement with these companies.
of (marine) ecosystems. The benchmark also shows where seafood com-          •   Highlighting best practices. By highlighting best practices, the
panies’ influence is limited and where there is a need for other actors,         Seafood Stewardship Index stimulates learning across the seafood
such as governments and other value chain actors, to take action. Finally,       industry, provides guidance to companies and their stakeholders
the benchmark aims to enrich the public debate on what can reasonably            and accelerates the private sector’s contributions to the SDGs.
be expected of seafood companies in contributing to the SDGs.                    The benchmark clarifies what seafood companies are already
                                                                                 doing and where they can do more to improve responsibility and
As such, the Seafood Stewardship Index’s theory of change is based               sustainability in seafood supply chains.
on the following principles:                                                 •   Accountability through ranking. By creating a ranking, the bench-
                                                                                 mark aims to recognise strong performers and hold laggards to
•
  Aligned with the SDGs and existing standards and frameworks.                   account, encouraging a race to the top.
    The Seafood Stewardship Index methodology compiles and trans-            •	Keystone companies. The principle of keystone companies is at
    lates existing standards, goals and frameworks into measurable               the core of the Seafood Stewardship Index and WBA’s theory
    indicators. This alignment enables the benchmark to clarify and              of change (see Figure 3). The idea is that large companies with
    set clear expectations for seafood companies in all areas of seafood         expansive supply chains can lead and drive change throughout
    stewardship, including environmental and social dimensions.                  an industry. This is also the principle behind the formation of
  Accountability through transparent, public and impartial data. The
•	                                                                              SeaBOS, a collaboration between scientists and leading seafood
    Seafood Stewardship Index provides a transparent and impartial               companies.

                                                                                                                                                      10
The Seafood Stewardship Index
FIGURE 3: WBA’S THEORY OF CHANGE
Impact
… ultimately leading to business
Transformed systems and improved business impact on people, workers, communities
impact towards a sustainable
and the environment, particularly in developing countries
future for everyone
… which in turn leads to
Companies change behaviour and improve sustainable practices
accelerated company efforts towards more
Outcomes
sustainable practices…
Key stakeholders use the benchmarks and act
Leading to actively participating Companies Allies group
companies and actions by stakeholders respond actively Investors Governments Civil society around action
based on benchmarks… and banks and multilaterals and media
Resulting in published and
Outputs
disseminated methodologies Publication and socialisation Publication and socialisation Evolution of
and benchmarks and of methods of benchmarks the Alliance
organisational growth
WBA develops methodologies,
Activities
collects data and assesses Multi-
Developing Collecting Assessing Building
companies across seven system stakeholder
indicators data companies the Alliance
transformations while growing dialogues
the organisation
11The Seafood Stewardship Index
How can stakeholders use the Seafood Stewardship Index? How have companies used the Seafood Stewardship Index so far?
Financial institutions can use the index results as a tool to guide Companies can use the index results to learn about their own
responsible investment, stewardship and engagement with the performance and plan and prioritise improvement accordingly.
companies in scope. Companies can also learn how their peers are addressing certain
Civil society organisations can use the results to inform their stra- issues – although this is already happening through formal and
tegy, engagement with and focus on companies as well as other informal pre-competitive collaborations and learning platforms,
stakeholders (e.g. policymakers, investors). e.g. the Seafood Task Force.
Policymakers can use the results to inform policy priorities that
support and shape companies’ improvements, identifying where Between July and September 2020, WBA conducted interviews
voluntary action has not sufficiently led to systems change. with 14 of the companies in scope to understand how they have
used the benchmark. Overall, the feedback received was positive.
Several company representatives said they used the results to draw
the attention of the board and functional units to certain internal
Scope of the benchmark
issues and consequently secured funding to implement improve-
ments. A few companies developed new social and environmental
SDG scope
policies and started engaging with their subsidiaries to better
For the first methodology, all 17 SDGs and 169 targets were assessed
understand performance across supply chains and to align policies
to identify the goals and targets on which the seafood industry has
of subsidiaries with the parent company. A number of representati-
the largest impact and can therefore make the most significant
ves said the benchmark helped them better understand how they
contribution. The SDG targets that meet all assessment criteria fall under
align with the SDGs and how they are performing compared to
SDG 1 (no poverty), SDG 2 (zero hunger), SDG 5 (gender equality),
their peers. Finally, a few explained that the benchmark was useful
SDG 8 (decent work and economic growth), SDG 12 (responsible
for understanding stakeholder expectations, especially around
consumption and production), SDG 14 (life below water) and SDG 15
disclosure and transparency. In terms of concrete internal changes,
(life on land). The SDG targets in scope of this benchmark can be
the benchmark, by revealing gaps in disclosure and reporting,
found in Annex 2. For the second methodology, we added SDG 17
triggered some companies to revise key performance indicators
(partnerships for the goals) as the overarching goal to which all WBA
(KPIs) and associated internal reporting processes. More generally,
benchmarks contribute.
several companies improved their public reporting and disclosure.
12The Seafood Stewardship Index
Industry scope Company scope
The Seafood Stewardship Index will continue to focus on the 30 The Seafood Stewardship Index will continue to focus on the 30 largest
largest companies that produce seafood or aquaculture feed. During companies globally. These companies were selected using five criteria
consultations, stakeholders pointed out that retailers have an important based on the characteristics of keystone actors that WBA used to
position in the seafood value chain and can play a crucial role in making identify the SDG2000 (see Table 1). Keystone actors are the largest
the seafood industry more sustainable. As a result, several major companies in a given industry that have a disproportionate effect on
retailers will be included in the Food and Agriculture Benchmark, in the structure and function of the system in which they operate. The 30
which one indicator is focused on sustainable fishing and aquaculture. companies selected for the benchmark represent a significant share
of the global seafood market and are well positioned to accelerate
the transition to a more sustainable seafood production system.
EYSTONE ACTOR CHARACTERISTICS USED FOR THE SDG2000,
TABLE 1: K
INCLUSION CRITERIA AND COMPANY ASSESSMENTS
Keystone actor characteristics
Inclusion criteria Company assessment
and WBA selection criteria
he company dominates global
T The company is selected on the he Undercurrent News’ World’s 100 Largest Seafood Companies report, published
T
production revenues and volumes basis of revenue from seafood and/or in November 2020,8 was used as a source for identifying seafood-related revenues.
within the sector. aquaculture feed. As this report does not include aquaculture feed companies or seafood companies’
aquaculture feed-related revenues, additional research and advice from the Expert
Review Committee and other experts were used to identify aquaculture feed
companies and seafood companies with significant aquaculture feed revenues.
Revenues were reassessed for seafood companies with large aquaculture feed
portfolios to establish whether this would result in inclusion. Information about
revenues was cross-checked with information from Refinitiv Eikon.
he company controls globally
T he company has an important
T Each company in the preliminary list of companies was assessed on the segments
relevant segments of production. position within the supply chain, either in the seafood supply chain in which it is active and the species and product
by being active in multiple segments groups in its portfolio.
or dominating one segment.
The company connects ecosystems The company has international Each company was assessed on whether it sources from and distributes to
globally through subsidiaries. seafood-related subsidiaries and international markets, and whether it has subsidiaries and offices in different
offices, and it sources and distributes countries.
products globally.
13The Seafood Stewardship Index
he company influences global
T The company is involved in preliminary assessment indicates that the seafood companies in scope are
A
governance processes and seafood-specific initiatives or involved in global governance processes and institutions, including seafood-specific
institutions. associations that contribute initiatives. Examples include SeaBOS, the Global Sustainable Seafood Initiative
to global governance processes. (GSSI), Global Tuna Alliance, International Seafood Sustainability Foundation
(ISSF), Seafood Task Force, Global Dialogue on Seafood Traceability (GDST), the
Advisory Network of the High-Level Panel for a Sustainable Ocean Economy,
regional fisheries management organisations and non-seafood-specific initiatives,
such as the UN Global Compact (UNGC).
he company has a global footprint,
T The company has a footprint in A significant portion of the world’s seafood is produced in or sourced from
particularly in developing countries. developing countries through developing countries. Company reviews were conducted to identify whether
sourcing of products or aquaculture companies have operations in developing countries, whether they source species
feed ingredients, operating or or aquaculture feed ingredients caught or produced in developing countries, and
processing activities, or sales. whether products are marketed in developing countries.
To allow for comparison and to assess progress, the same 30 companies million. Based on revenue and an assessment of the other inclusion
will be included in the second benchmark. Moreover, as seen in other criteria, Bolton Group will now be included in the benchmark, with
benchmarks, repeated involvement in a benchmark drives progress. Tri Marine International being assessed as a fully owned subsidiary.
• In 2020, FCF Co Ltd acquired Bumble Bee Foods. Their combined
However, mergers and acquisitions in the industry in the intervening seafood-related revenue came to USD 2,600 million. FCF Co Ltd will
years have impacted three companies that were included in the first remain in the benchmark, with Bumble Bee Foods being assessed
benchmark: as a fully owned subsidiary.
• In 2017, Shanghai Fisheries General Corporation became a fully • As a result of these mergers and acquisitions, the number of
owned subsidiary of the Bright Food Group. According to the companies dropped to 29. Therefore, Japanese processor and
World’s 100 Largest Seafood Companies 2020 report,9 Bright wholesaler OUG Holdings was added to the scope of the bench-
Food Group ranked 23rd, with an estimated revenue of USD 1,158 mark. The company mainly focuses on the Japanese market but also
million. It will replace Shanghai Fisheries General Corporation in has an international network of sales offices. In 2019, its revenue
the company scope of the benchmark. was USD 2,940 million.
• In 2019, Bolton Group acquired Tri Marine International. According Based on the inclusion criteria and considering recent mergers and
to the World’s 100 Largest Seafood Companies 2020 report, acquisitions, the 30 companies listed in Table 2 will be assessed in the
Bolton Group ranked 17th, with an estimated revenue of USD 1,512 2021 index.
14The Seafood Stewardship Index
TABLE 2: COMPANIES IN THE 2021 SEAFOOD STEWARDSHIP INDEX
Name Country 2019 In Food Name Country 2019 In Food
of origin revenue and of origin revenue and
in USD Agriculture in USD Agriculture
million Benchmark million Benchmark
1 Maruha Nichiro Japan 7,478 x 17 Schouw & Co (BioMar) Denmark 1,681IV x
2 Nippon Suisan Kaisha Japan 6,094 x 18 Parlevliet and Van der Plas Netherlands 1,540 x
(Nissui) 19 Bolton Group (including Italy 1,512
3 Dongwon Enterprise South Korea 4,902 x Tri Marine International)
4 Mowi Norway 4,632 x 20 Pacific Seafood Group United States 1,450 x
5 Thai Union Group Thailand 4,070 x 21 SalMar Norway 1,391
6 Mitsubishi Corporation Japan 3,600 x 22 Charoen Pokphand Foods Thailand 1,310VI x
7 Austevoll Seafood Norway 3,050 x 23 Nueva Pescanova Spain 1,185 x
8 OUG Holdings Japan 2,940 x 24 Bright Food Group China 1,158 x
(Shanghai Fisheries General
9 Nutreco (Skretting) Netherlands 2,600IIV x
Corporation)
10 FCF Co Ltd (including Taiwan 2,600IIV x
25 Nomad Foods United 1,042
Bumble Bee Foods)
Kingdom
11 Trident Seafoods United States 2,550 x
26 High Liner Foods Canada 942
12 Kyokuyo Japan 2,413 x
27 Labeyrie Fine Foods France 879
13 Red Chamber Group United States 2,150 x
28 Royal Greenland Greenland 805
14 Cargill Aqua Nutrition United States 2,140IIII x
29 Wales Group (Sea Value & Thailand 789
15 Marubeni Corporation Japan 1,825 x Sea Wealth)
16 Cooke Aquaculture and Canada 1,771IV x 30 Yokohama Reito (Yokorei) Japan 761
Cooke Seafood USA
I
2019 revenue.
II
Combined 2019 revenues of FCF Co Ltd and Bumble Bee Foods.
III
2016 revenue.
IV
2019 revenue.
V
2019 revenue, excluding feed revenue.
15Methodology and benchmark development
WBA’s benchmarking cycle Dialogue and research: Alignment with other
benchmarks, standards and reporting initiatives
WBA benchmarks are published in accordance with the benchmarking
cycle, which is made up of six steps (see Figure 4). The measurement framework for the first Seafood Stewardship Index
methodology was based on the results of extensive multi-stakeholder
FIGURE 4: WBA BENCHMARK CYCLE dialogues and research. The methodology for the second index has
built upon that framework as well as the updated mapping of impor-
tant initiatives in the seafood industry. It aims to align with the best
METHODOLOGY DEVELOPMENT
available science, relevant principles and normative standards, repor-
ting frameworks and sector-, product- and issue-specific initiatives
Dialogue and
Methodology (see Annex 5).
development
research
and review
In addition, since the first benchmark was published, WBA has adopted
a systems-based approach to developing benchmarks to transform
Benchmark Methodology
publication publication seven areas, including in the food and agriculture and social spheres.
As such, the Seafood Stewardship Index is part of the food and agri-
culture transformation, and 22 out of 30 companies in the benchmark
Verification Data are also in scope of the Food and Agriculture Benchmark. Moreover,
and analysis collection
all 30 companies in scope of the Seafood Stewardship Index will be
assessed against WBA’s core social indicators. More information about
BENCHMARK DEVELOPMENT
the core social indicators can be found under measurement area D.
Methodology development and review
The review of the methodology for the 2021 Seafood Stewardship
Index has been done according to a multi-stakeholder process. First,
it was overseen by an independent multi-stakeholder Expert Review
Committee (ERC) (see Table 3), made up of a diverse group of experts
16Methodology and benchmark development
around the seafood sector. The ERC has met multiple time throughout Data collection
the process, to provide strategic guidance, recommendations and
advice on the scope, structure, content and methodology of the bench- Data collection for the benchmark is due to start at the beginning of
mark. Second, the methodology has been subject to a six week public April 2021. Each company in scope is invited to respond to a survey
consultation, allowing all stakeholders to provide input. All feedback that is pre-populated by WBA researchers on the basis of publicly
received has been integrated into the final methodology. available corporate information published on company websites and
in annual reports, sustainability reports and other public materials.
TABLE 3: M
EMBERS OF THE EXPERT REVIEW COMMITTEE FOR THE This is designed to speed up the process for companies and facilitate
SEAFOOD STEWARDSHIP INDEX their engagement with the benchmark. Companies will have an op-
portunity to contribute data for all questions and expand upon each
1 Robert Blasiak Researcher, Stockholm Resilience Centre
answer with supplemental information beyond what is already publicly
Science and Sustainability available. The Seafood Stewardship Index assesses companies at the
2 Bertrand Charron Communications Manager, Aq-uaculture
group level and therefore will send only one survey to each company and
Stewardship Council
not to individual subsidiaries. The parent company is thus responsible
3 Clarus Chu Seafood Manager, WWF
for including information about subsidiaries in the survey. Companies
Vice President, Global Ocean Initiatives, that choose not to complete the survey will be evaluated based solely on
4 Jennifer Dianto Kemmerly
Monterey Bay Aquarium publicly available information and will not be able to appeal the results.
5 John Garner Retired seafood representative
Global Head of Responsible Investment, To promote corporate transparency, WBA benchmarks seek to reward
6 Abigail Herron
Aviva Investors public disclosure by only using information that companies make public
7 Duncan Leadbitter Director, Fish Matter or are willing to make public. For instance, companies might have
additional internal documentation or information that they have not
Head of Global Accessibility, Marine
8 Oluyemisi Oloruntuyi yet published externally. Therefore, the Seafood Stewardship Index
Stewardship Council
will accept company information that is not in the public domain but
9 Henk Peters Programme Officer, Oxfam
that WBA can make public, if necessary. This means that the option
10 Huw Thomas Director, 3 Pillars Seafood
to provide information under non-disclosure is no longer available.
Project Manager, Ocean Disclosure All data must be supplied in English. The 2021 benchmark will include
11 Tania Woodcock
Project, Sustainable Fisheries Partnership
data and reporting published in 2019–2020.
17Methodology and benchmark development
Verification and analysis
After all data is collected, it will be verified and analysed, a process
overseen by the Seafood Research Lead. For verification purposes,
researchers conduct an extensive quantitative and qualitative check
of each indicator for each company, including cross-checks. Scoring is
carried out according to scoring guidelines that are approved by the
WBA Executive Board and published alongside benchmark results.
The results will provide the basis for company scorecards, which
will outline how companies performed in the benchmark, including
strengths and weaknesses, and highlight best practices. Company
scorecards will be shared with companies prior to publication of the
Seafood Stewardship Index.
After publication of the benchmark, findings and results, including
scorecards, will be actively distributed. This will involve media outreach,
engagement with individual companies and industry organisations,
and outreach to specific stakeholders such as investors, banks, non-
governmental organisations (NGOs) and policymakers. Feedback will
be captured for the methodology review process for the next iteration
of the benchmark.
18Process and timeline
FIGURE 5: SEAFOOD STEWARDSHIP INDEX 2019-2021 TIMELINE
December 2020
Publication of the draft
methodology for the
Seafood Stewardship Index
for public consultation
The draft methodology
April-May 2021: September 2021
was published for public
Data collection for Publication of the benchmark
consultation between
companies
16 December 2020 and The second iteration of the
31 January 2021. The Based on a prepopulated Seafood Stewardship Index
document outlines the questionnaire, companies will be launched in the
draft indicators and will be given the opportunity third quarter of 2021, at the
October 2019
scoring and weighting to provide additional public inaugural United Nations
(Our Ocean conference,
approaches. data for the benchmark. Food Systems Summit.
Oslo):
Publication of the first
Seafood Stewardship Index
Ranking of 30 keystone
companies in the seafood
industry, with key findings
March 2021
and company scorecards.
Publication of the the
methodology
Throughout the public
consultation, stakeholders
provided feedback through
online webinars and in
written form, leading to
the publication of this
methodology (see Annex 1
for a summary of the
feedback received and
responses).
19Analytical framework for the Seafood Stewardship Index
Measurement areas and indicators
The Seafood Stewardship Index measures company performance across
four different areas, which are inspired by the SDGs. Based on learnings
from the first iteration of the benchmark, ERC recommendations and
stakeholder feedback received during the public consultation, the
methodology was revised. Figure 6 presents an overview of the
measurement areas and indicators of the Seafood Stewardship Index
methodology. The next section provides a detailed explanation of
each indicator.
Approach to scoring and weighting
A set of guidelines for each indicator will be used to score company
performance. Each indicator has a fixed scale, whereby the company
receives a score depending on the scoring criteria. WBA scores will
have a 0–2 range: a score of 0 reflects no performance and a score of
2 reflects best performance. Each indicator is scored against a set of
predefined criteria related to ‘elements’ outlined for each indicator. The
elements for each indicator reflect what is expected of the company
and what it will be assessed and scored on. Draft scoring guidelines are
already in development and will be published with the benchmark results.
The benchmark will use a weighed approach to calculate companies’
scores. This approach builds on the first Seafood Stewardship Index
methodology and that of other WBA benchmarks. Weighting will be
distributed across the different measurement areas to ensure that the
measurement framework is balanced and reflects stakeholder priorities.
20Analytical framework for the Seafood Stewardship Index
FIGURE 6: OVERVIEW OF INDICATORS IN THE FOUR MEASUREMENT AREAS
Core social indicators Social responsibility Ecosystems
D1 Commitment to respect human rights D19 Child labour B1 Commitment to sustainable fisheries and
D2 Commitment to respect the human rights of D20 Forced labour aquaculture
workers D21 Living wage B2 Sustainable target fish stocks
D3 Identifying human rights risks and impacts D22 Health and safety of vulnerable groups B3 By-catch
D4 Assessing human rights risks and impacts D23 Farmer and fisher productivity and resilience B4 Endangered species
D5 Integrating and acting on human rights risks D24 Working and living conditions on board B5 Sensitive habitats
and impacts fishing vessels B6 Abandoned, lost or otherwise discarded
D6 Engagement with affected and potentially D25 Respecting customary and fishing gear
affected stakeholders indigenous rights B7 Protection of terrestrial natural ecosystems
D7 Grievance mechanisms for workers D26 Engagement with and support for local B8 Marine ingredients in aquaculture feed and
D8 Grievance mechanisms for external individuals communities use of alternative ingredients
and communities D27 Gender commitment in the supply chain B9 Prevention and mitigation of escapes
D9 Health and safety fundamentals B10 Disease management and mortality rates
D10 Living wage fundamentals B11 Animal welfare
D11 Working hours fundamentals B12 Antibiotic use and growth promoting
D12 Collective bargaining fundamentals Governance substances
D13 Workforce diversity disclosure fundamentals and B13 Medicine use
strategy
D14 Gender equality and women’s
Core social
empowerment fundamentals indicators Traceability
D15 Personal data protection fundamentals
C1 Commitment to traceable seafood products
D16 Responsible tax fundamentals
and aquaculture feed ingredients
D17 Anti-bribery and anti-corruption fundamentals
C2 Traceability system for seafood products and
D18 Responsible lobbying and political
Social Ecosystems aquaculture feed ingredients
engagement fundamentals
responsibility C3 Risk-based approach to illegal,
unreported and unregulated (IUU) fishing
Governance and strategy C4 Disclosure of the source of seafood products and
A1 Sustainable development strategy marine feed ingredients
A2 Governance and accountability for sustainable Environment
development
A3 Stakeholder engagement
A4 Engagement in policy advocacy
21Analytical framework for the Seafood Stewardship Index
Table 4 and figure 7 present the weightings of the different measure- FIGURE 7: W
EIGHTS PER MEASUREMENT AREA
ment areas. The ecosystems measurement area carries the greatest
weight (35%),in part to account for the number of indicators in this
measurement area. Social responsibility and the core social indicators 10%
have a combined weight of 40%. Traceability accounts for a relatively Governance
small 15% but carries the greatest weight per indicator. Governance 20% and
strategy
and strategy and the core social indicators have a weighting of 10% Core social
and 20% respectively, which is in alignment with the Food and Agri- indicators
culture Benchmark.
All indicators within a measurement area will receive the same weight. 20% 35%
However, as some indicators in the ecosystems measurement area are Ecosystems
Social
specific to either fishing, aquaculture or aquaculture feed production,
responsibility
not all companies can be meaningfully assessed on all 13 ecosystem
indicators. Full details on which indicators are applicable to each
company will be published with the final scores and scoring guidelines.
15%
Environment
TABLE 4: WEIGHT PER MEASUREMENT AREA AND INDICATOR
Weight per
Measurement area Weight (%) Indicators
indicator (%)
A. Governance and strategy 10 4 2.50
B. Ecosystems 35 13 2.69
C. Traceability 15 4 3.75
D. Social responsibility 20 9 2.22
Core social indicators 20 18 1.11
22Indicators for the Seafood Stewardship Index
The following sections describe each indicator within the four different
measurement areas. The indicators follow a standard format:
• Topic: a short descriptor of the issue.
• Indicator: sets out the topic-specific outcomes expected of the
company.
• Rationale: sets out the reason why the topic is included in
the benchmark and why it is crucial for a sustainable seafood
industry and the SDGs.
• Elements: sets out what companies will be assessed against for
the indicator.
• Sources: lists the key existing initiatives that the indicator aligns
with or builds upon.
For each indicator outlined below, WBA is developing scoring gui-
delines to be used in the assessment process in 2021. The scoring
guidelines will be finalised following the data collection process and
so are not included in this document. They will be published with
the benchmark results later this year. The guidelines will reflect the
elements set out for each indicator and will also recognise sub-sector-
specific differences across the value chain, where relevant. Some topics
will be inherently more reliant on quantitative targets and performance
data, whereas others will rely on a qualitative assessment of policy,
processes and implementation.
23Measurement area A: Governance and strategy
developed that will be applied to the Food and Agriculture Bench-
mark to compare company performance across benchmarks and
systems to be transformed. The indicators are similar to those used
in the previous benchmark for sustainability strategies, governance
and accountability, and stakeholder engagement.
• Policy advocacy. In addition to WBA’s generic indicators, the in-
dicator relating to policy advocacy is still included.
A1. Sustainable development strategy
(adopted from the Food and Agriculture Benchmark)
• Indicator: The company has sustainable development objectives
and targets embedded in its strategy and business model.
• Rationale: A corporate strategy that integrates sustainable de-
velopment objectives and targets helps the company to deliver
on key SDGs and facilitates its ability to adapt and change through
This measurement area analyses how stewardship is integrated into forward planning, increasing its resilience, managing risks and pro-
seafood companies’ governance structure, strategies and management tecting workers, the company and society at large (SDG target 12.6).
systems, and how companies engage and collaborate with stake- • Elements:
holders to improve stewardship and contribute to sustainability and - The company has a long-term strategy to contribute positively
the SDGs. to sustainable development and achieving the SDGs.
- As part of its strategy, the company identifies and prioritises
Key indicator revisions the issues on which it has clear impact, within the environment,
The number of indicators in this measurement area will be reduced food and nutrition security and social domains, both directly
from seven to four. Key revisions are: and through its supply chain.
• Alignment with the Food and Agriculture Benchmark. The indi- - The company sets realistic but ambitious objectives and
cators for governance will be aligned with the Food and Agri- targets that cover its impacts on the environment, food and
culture Benchmark. A set of three governance indicators has been nutrition security and social issues.
24Measurement area A: Governance and strategy
- The company periodically reviews the strategy, objectives Toward Common Metrics and Consistent Reporting of Sustainable
and targets to ensure they remain fit for the changing Value Creation (2020).
contexts and reports performance against the targets.
• Sources: GRI Universal Standards (2020), SDG Impact Standards A3. Stakeholder engagement
for Enterprises (2020), SDGD Recommendations (2020). (adopted from the Food and Agriculture Benchmark)
A2. G
overnance and accountability for sustainable • Indicator: The company engages with stakeholders on sustainable
development development issues and incorporates the outcomes of these
(adopted from the Food and Agriculture Benchmark) activities in its strategy and operations.
• Rationale: Stakeholders may raise concerns that could influence
• Indicator: The company has a governance system that includes medium- or long-term financial or operating performance or create
board/highest level responsibility and accountability for its sus- acute short-term financial impacts through the loss of a license
tainable development targets. Board members have sustainable to operate, reputational damage, changes in customer demand
development objectives and incentives to reward the effective and/or disruptions to business viability. Regularly engaging with
delivery of relevant company strategies and initiatives. stakeholders, such as local communities, governments, academia
• Rationale: A board governance structure that links sustainable and non governmental organisations, contributes to the company’s
development goals and targets to roles and remuneration is impor- understanding of diverse and frequently opposing perspectives,
tant to ensure the accountability of the company in relation to its potentially drives innovation and helps to shape robust and inclu-
contribution to sustainable development targets (SDG target 12.6). sive approaches. Companies are expected to engage proactively
• Elements: in multi-stakeholder dialogues and initiatives relating to stewardship
- The company assigns decision-making and oversight challenges in the industry. Complaints, disputes or significant
responsibility for sustainable development topics to the adverse impacts highlighted by stakeholders should be addressed
highest governance body. and resolved. Engagement processes are expected to produce
- The company links performance criteria in remuneration a clear output or action and an acknowledgement of how stake-
policies for the members at the highest level of its governance holder inputs are used (SDG target 12.6).
body to its objectives for sustainable development topics. • Elements:
• Sources: GRI Universal Standards (2020), SDG Impact Standards - The company describes the process for identifying relevant
for Enterprises (2020), SDGD Recommendations (2020), WEF stakeholder groups, at global and local levels, including
25Measurement area A: Governance and strategy
the communities it impacts, civil society, governments, workers individually or collectively with other companies, with the
and employees, and how it engages with these groups. aim of strengthening or developing public policies and
- The company discloses the process of stakeholder legislation that support social responsibility and environmental
engagement and regularly reports on how it integrates the sustainability in the seafood industry.
outcomes of stakeholder engagement and the identification - The company provides specific examples of policy advocacy
of sustainability risks and opportunities into its long-term activities and discloses how these activities have or are contri-
corporate strategy. buting to changes in public policies or legislation.
• Sources: GRI Universal Standards (2020), SASB (2018), SDG • Sources: FAO (1995), ISSF (2019), SeaBOS (2020), UNGC (2019).
Impact Standards for Enterprises (2020), SDGD Recommendations
(2020), WEF Toward Common Metrics and Consistent Reporting
of Sustainable Value Creation (2020).
A4. Engagement in policy advocacy
• Indicator: The company demonstrates policy advocacy activities,
with the aim of implementing public policies or strengthening
legislation that supports social responsibility and environmental
sustainability in the seafood industry.
• Rationale: A company can be an influential advocate for social-,
environmental- and traceability-related regulations by engaging
(individually or collectively with other companies) with govern-
ments and policymakers. The goal of policy advocacy activities
is either to strengthen existing legislation or create new legislation
that contributes to socially responsible and environmentally
sustainable fishing and aquaculture operations and supply chains
(SDG targets 12.6 and 14.2).
• Elements:
- The company engages in policy advocacy activities, either
26Measurement area B: Ecosystems
cators have been reformulated to be more precise about what is
expected from companies. Some indicators have been removed
to avoid overlap between indicators or in instances where the first
iteration of the benchmark revealed that a meaningful comparative
assessment was difficult. Overall, the new ecosystem indicators
aim to cover the following aspects of stewardship: commitment
and reporting, assessment and disclosure of impacts, mitigation
activities and progress reporting.
• Integration with the Food and Agriculture Benchmark. Several
areas that measure the performance of seafood companies overlap
with areas to which companies in the overarching food system can
also contribute. Indicators relating to animal welfare, antibiotic use
and the protection of terrestrial natural ecosystems (achieving
conversion-free operations and supply chains for high-risk com-
modities such as soya and palm oil) will be applied in both the
Food and Agriculture Benchmark and the Seafood Stewardship
A crucial element of good stewardship practices for companies in the Index. Furthermore, the first iteration of the benchmark assessed
seafood industry is managing the impacts of fishing and aquaculture company performance on generic environmental impacts such as
operations on ecosystems. This measurement area focuses on what greenhouse gas emissions, freshwater use, and food loss and waste.
companies are doing to avoid, reduce and/or mitigate negative eco- With the development of the Food and Agriculture Benchmark,
system impacts in a number of key areas of fishing, aquaculture and which addresses the environmental performance of companies
aquaculture feed production. across the food value chain, the Seafood Stewardship Index will
focus on topics of specific relevance for the seafood industry and
Key indicator revisions to which seafood companies can make a significant contribution.
The number of indicators in this measurement area will be reduced Therefore, these topics will no longer be part of this benchmark,
from 20 to 13. Key revisions are: but company performance will be assessed against these topics
• Reformulation of indicators. The majority of indicators that were in the environmental dimension of the Food and Agriculture
included in the first methodology have been retained. Some indi- Benchmark.
27Measurement area B: Ecosystems
B1. Commitment to sustainable fisheries and aquaculture criteria and targets have been set for sustainable sourcing.
(adopted from the Food and Agriculture Benchmark) This could include disclosing its sourcing policy and/or
supplier code of conduct that sets clear targets based on
• Indicator: The company has targets for sustainable fishing and credible standards and ratings.
aquaculture operations and/or sustainable sourcing of seafood and - The company publicly discloses information about how it
aquaculture feed ingredients, and publicly reports against these monitors and makes positive progress against the criteria and
targets. targets that have been set for sustainable seafood operations.
• Rationale: To safeguard fish populations and marine biodiversity, • Sources: CASS (2019), FAIRR (2019), Food Foundation – Plating
companies need to source seafood products and marine feed up Progress (2020), SBTN Draft Interim Guidance (2020),
ingredients responsibly and operate according to sustainable Sustainable Seafood Coalition (2018).
fishing and/or aquaculture practices. According to FAO estimates
from 2017, about a third of global fish stocks were overfished, B2. Sustainable target fish stocks
while nearly 60% were maximally sustainably fished.10 With global
fish stocks under increasing pressure, companies need to be trans- • Indicator: The company is reducing its impacts on stocks of target
parent about the sustainable management and efficient use of species through activities that ensure and support science-based
marine resources. Companies can contribute to this by adopting management.
sourcing policies that include specific, measurable and time-bound • Rationale: Seafood companies involved in fishing or sourcing from
targets, monitor progress and publicly report their progress against wild fish stocks show stewardship by sourcing from stocks that
these targets (SDG targets 14.2 and 14.4). are well managed and/or conducting fishing activities that do not
• Elements: lead to overfishing and ensure the long-term sustainability of fish
- The company with fishing and/or aquaculture operations resources. In the case of overfished stocks, companies can help
discloses information about sustainability requirements, criteria restore and rebuild fish stocks in the shortest time feasible through
and targets that have been set for sustainable fishing and improved and effective harvesting regulations and improved catch
aquaculture operations. This could include sharing a sourcing methods (SDG targets 14.2 and 14.4).
policy or supplier code of conduct that sets clear targets based • Elements:
on credible standards and ratings. - The company has assessed the management status and level
- The company involved in trading and/or processing seafood of sustainability of target stocks across 100% of its portfolio,
products demonstrates what sustainability requirements, including its own operations and supply chain. The company
28You can also read


