WIND FORCE 12 A blueprint to achieve 12% of the world's electricity from wind power by 2020 - Greenpeace
←
→
Page content transcription
If your browser does not render page correctly, please read the page content below
WIND FORCE 12
A blueprint to achieve 12% of the world's electricity
                          from wind power by 2020

                                          [June 2005]
WIND FORCE 12
SUMMARY RESULTS IN 2020
Total MW installed                               1,254,030
Annual MW installed                                158,728
TWh generated to meet 12% global demand               3,054
Co2 reduction (annual million tonnes)                 1,832
Co2 reduction (cumulative million tonnes)           10,771
Total investment per annum                      €80 billion
Total job years                                  2.3 million
Installation costs in 2020                        €512/kW
Electricity generation costs in 2020        €2.45cents/kWh
TABLE OF CONTENTS

                                                                                                                                        Page

-   OVERVIEW                        . . . . . . . . . . . . . . . . . . . . . . . . . . . . . . . . . . . . . . . . . . . . . . . . . . . . . .2

-   THE GLOBAL MARKET STATUS OF WIND POWER . . . . . . . . . . . . . . . . . . . . . . . . .6

-   WIND POWER AND ENERGY POLICY REFORM . . . . . . . . . . . . . . . . . . . . . . . . . . .11
    1. Legally binding targets for renewable energy . . . . . . . . . . . . . . . . . . . . . . . . . . . . .11
    2. Specific policy mechanisms . . . . . . . . . . . . . . . . . . . . . . . . . . . . . . . . . . . . . . . . . . .12
       2.1 Fixed Price Systems . . . . . . . . . . . . . . . . . . . . . . . . . . . . . . . . . . . . . . . . . . . .12
       2.2 Renewable Quote Systems . . . . . . . . . . . . . . . . . . . . . . . . . . . . . . . . . . . . . .13
       2.3. Design criteria
       2.4 Defined and stable returns for investors . . . . . . . . . . . . . . . . . . . . . . . . . . .13
    3. Electricity market reform . . . . . . . . . . . . . . . . . . . . . . . . . . . . . . . . . . . . . . . . . . . . .13
       3.1 Removal of electricity sector barriers to renewables . . . . . . . . . . . . . . . . .13
       3.2 Removal of market distortions . . . . . . . . . . . . . . . . . . . . . . . . . . . . . . . . . . .14
               3.2.1 End subsidies to fossil fuel and
                     nuclear power sources . . . . . . . . . . . . . . . . . . . . . . . . . . . . . . . . . . . .14
               3.2.2 Internalise the social and environmental
                     costs of polluting energy . . . . . . . . . . . . . . . . . . . . . . . . . . . . . . . . . .15

-   INTERNATIONAL POLICIES . . . . . . . . . . . . . . . . . . . . . . . . . . . . . . . . . . . . . . . . . . .17
    Implementation of the Kyoto Protocol and
    post 2012 reductions framework . . . . . . . . . . . . . . . . . . . . . . . . . . . . . . . . . . . . . . . . .17
    Reform of Export Credit Agencies (ECAs),
    Multi-Lateral Development Banks (MDBs) and
    International Finance Institutions (IFIs) . . . . . . . . . . . . . . . . . . . . . . . . . . . . . . . . . . . .18
    G8 recommendations . . . . . . . . . . . . . . . . . . . . . . . . . . . . . . . . . . . . . . . . . . . . . . . . . . .18
    Policy summary      . . . . . . . . . . . . . . . . . . . . . . . . . . . . . . . . . . . . . . . . . . . . . . . . . . . . .19

-   COUNTRY REPORTS . . . . . . . . . . . . . . . . . . . . . . . . . . . . . . . . . . . . . . . . . . . . . . . . .20
    Australia . . . . . . . . . . . . . . . . . . . . . . . . . . . . . . . . . . . . . . . . . . . . . . . . . . . . . . . . . . . . . .20
    Brazil . . . . . . . . . . . . . . . . . . . . . . . . . . . . . . . . . . . . . . . . . . . . . . . . . . . . . . . . . . . . . . . .23
    Global map . . . . . . . . . . . . . . . . . . . . . . . . . . . . . . . . . . . . . . . . . . . . . . . . . . . . . . . . . . .24
    Canada . . . . . . . . . . . . . . . . . . . . . . . . . . . . . . . . . . . . . . . . . . . . . . . . . . . . . . . . . . . . . . .26
    China . . . . . . . . . . . . . . . . . . . . . . . . . . . . . . . . . . . . . . . . . . . . . . . . . . . . . . . . . . . . . . . .28
    France . . . . . . . . . . . . . . . . . . . . . . . . . . . . . . . . . . . . . . . . . . . . . . . . . . . . . . . . . . . . . . .31
    India . . . . . . . . . . . . . . . . . . . . . . . . . . . . . . . . . . . . . . . . . . . . . . . . . . . . . . . . . . . . . . . .32
    Italy . . . . . . . . . . . . . . . . . . . . . . . . . . . . . . . . . . . . . . . . . . . . . . . . . . . . . . . . . . . . . . . . .34
    Japan . . . . . . . . . . . . . . . . . . . . . . . . . . . . . . . . . . . . . . . . . . . . . . . . . . . . . . . . . . . . . . . .35
    Offshore . . . . . . . . . . . . . . . . . . . . . . . . . . . . . . . . . . . . . . . . . . . . . . . . . . . . . . . . . . . . . .36
    Philippines . . . . . . . . . . . . . . . . . . . . . . . . . . . . . . . . . . . . . . . . . . . . . . . . . . . . . . . . . . . .39
    Poland . . . . . . . . . . . . . . . . . . . . . . . . . . . . . . . . . . . . . . . . . . . . . . . . . . . . . . . . . . . . . . .40
    Turkey . . . . . . . . . . . . . . . . . . . . . . . . . . . . . . . . . . . . . . . . . . . . . . . . . . . . . . . . . . . . . . .42
    United Kingdom . . . . . . . . . . . . . . . . . . . . . . . . . . . . . . . . . . . . . . . . . . . . . . . . . . . . . . .43
    United States . . . . . . . . . . . . . . . . . . . . . . . . . . . . . . . . . . . . . . . . . . . . . . . . . . . . . . . . .45

                                                                                                                                                   WIND FORCE 12 REPORT 2005   [1]
OVERVIEW
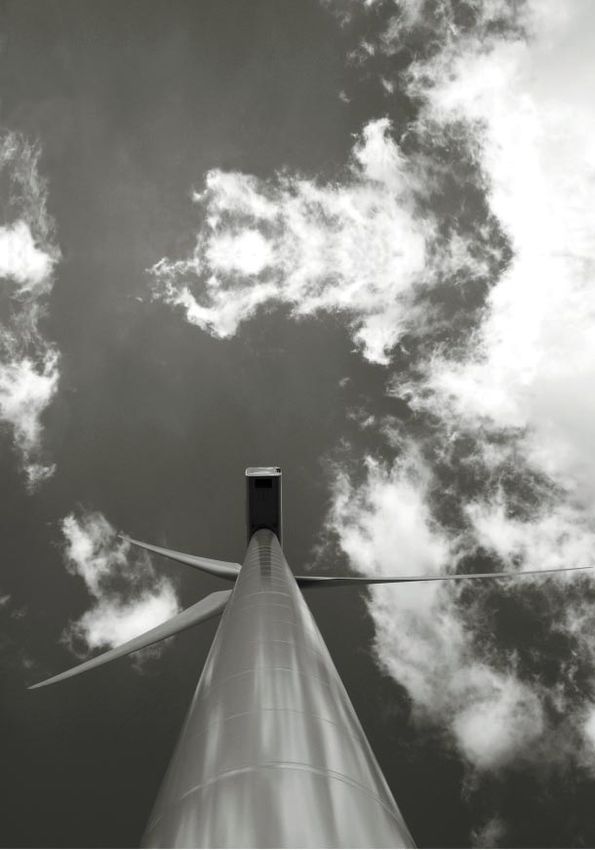
Celle San Vito (FG), Puglia, Italy
"…THE IMPACTS OF GLOBAL GLOBAL SECURITY FROM WIND
WARMING ARE SUCH THAT I HAVE
NO HESITATION IN DESCRIBING IT
The global energy challenge of our time is to tackle the threat of climate
AS A "WEAPON OF MASS
DESTRUCTION". change, meet the rising demand for energy and to safeguard security of energy
– Sir John Houghton, supplies. Wind energy is one of the most effective power technologies that is
the Guardian, 28th July 2003 ready today for global deployment on a scale that can help tackle these
problems. Wind power can be installed far quicker than conventional power
stations. This is a significant factor in economies with rapid growth in
electricity demand.
Wind energy is a significant and powerful resource. It is safe, clean, and
abundant. Unlike conventional fuels, wind energy is a massive indigenous
power source permanently available in virtually every nation in the world. It
delivers the energy security benefits of avoided fuel costs, no long term fuel
price risk, and wind power avoids the economic and supply risks that can with
reliance on imported fuels and political dependence on other countries.
Wind Force 12 is a global industry blueprint which demonstrates that there are
no technical, economic or resource barriers to supplying 12% of the world's
electricity needs with wind power alone by 2020 - and this against the
challenging backdrop of a projected two thirds increase of electricity demand
by that date. By 2020, 1,250 GW of wind power can be installed.
The wind industry we have today is capable of becoming a dynamic, innovative
€ 80 billion annual business by 2020, helping to satisfy global energy demands
and unlock a new era of economic growth, technological progress and
environmental protection. The wind industry of today is one the world's fastest
growing energy sectors and offers the best opportunity to begin the transition to
a global economy based on sustainable energy.
[2] WIND FORCE 12 REPORT 2005[OVERVIEW]
POWERFUL PROGRESS “DELAYING ACTION FOR A DECADE,
OR EVEN JUST YEARS,
IS NOT A SERIOUS OPTION”
Wind energy has come a long way since the prototypes of just 25 years ago.
Sir David King
Two decades of technological progress have resulted in today's wind turbines Science, 9th January 2004
being state-of-the-art modern technology - modular and rapid to install. A
single wind turbine can produce 200 times more power than its equivalent two
decades ago.
In 2004 more than 8,000 Megawatts of wind power was installed worldwide,
the turbine machinery alone worth about at €8 billion and generating enough
electricity to power the equivalent of 19 million average European homes. The
wind power sector includes some of the world’s largest energy companies.
Unlike other ‘solutions’ to clean energy and climate protection, wind power
does not need to be invented, nor is there need to wait for any magical
'breakthrough'; it is ready for global implementation now. Modern wind farms
are already being built that provide bulk power equivalent to conventional
power stations. In the future, this blueprint will see the boundaries of
technological progress pushed further to bring far greater benefits.
POISED FOR GLOBAL DEPLOYMENT – OPENING NEW
MARKETS
As outlined in the opening chapters of this report, the success of the industry
to date has been largely created by the efforts of a handful of countries, led by
Germany, Spain and Denmark. It is obvious that if other countries matched
their efforts, the impact would be far reaching. However new market players
such as the USA, which could be one of the biggest wind energy markets in
2005; and China, have put themselves on the global map of the wind industry.
The fact that just three countries have created the bulk of the progress to date
underlines the fact that today's technology is merely the tip of the iceberg,
and a huge potential remains untapped. Wind power is capable of continuing
its successful history over the next two decades if positive political and
regulatory frameworks are implemented, removing the obstacles and market
distortions that currently constrain the industry’s real potential.
The 2005 report highlights 13 key countries around the world that can play a
leadership role to help unlock the major market deployment envisaged in the
report. These markets are at an early but developing stage, and provide an
insight into where this blueprint may be realized. These countries are Australia,
Brazil, Canada, China, France, India, Italy, Japan, the Philippines, Poland, Turkey,
the UK, and the USA. Offshore wind energy is included as it represents a
significant international resource.
WIND FORCE 12 REPORT 2005 [3][OVERVIEW]
“MINISTERS AND GOVERNMENT RISING POWER DEMAND
REPRESENTATIVES REAFFIRM THEIR
COMMITMENT TO SUBSTANTIALLY
With no intervention, the IEA estimates that, under current trends the world’s
INCREASE WITH A SENSE OF
URGENCY THE GLOBAL SHARE OF electricity demand could double from 2002 to 2030, accounting for 60% of
RENEWABLE ENERGY IN THE TOTAL new investment in energy supply by then. The global power sector requires
ENERGY SUPPLY. THEY SHARE THE 4,800GW - 2,000GW of this in the OECD - of new capacity to meet increasing
VISION THAT RENEWABLE ENERGIES, demand and replacing aging infrastructure, at a cost of €10,000 billion in power
COMBINES WITH INCREASED generation, transmission and distribution. By 2030, the power sector could
ENERGY EFFICIENCY, WILL BECOME A account for 45% of global carbon emissions. The investment choices made now
MOST IMPORTANT AND WIDELY will determine the level of emissions of carbon dioxide for many decades. Wind
AVAILABLE SOURCE OF ENERGY AND Force 12 shows that alternative paths are possible and that global installation of
WILL OFFER NEW OPPORTUNITES wind power by 2030 can reach 2,700GW.
FOR CO-OPERATION AMONG ALL”
154 Ministers and Government
representatives, International
Conference for Renewable Energies CLIMATE CHANGE
Declaration, Bonn, Germany,
June 2004 The UK Government has prioritised climate change for their G8 and EU
Presidencies this year. Both the International Climate Change Task Force
convened by Tony Blair, and the European Council have confirmed that
responsible climate policy means aiming to keep global mean temperature rise
below 2°C. To do that requires urgent action to achieve deep cuts in emissions
beyond the Kyoto Protocol’s initial round for the period 2008-2012.
In January, the report ‘Meeting the climate challenge’ - Recommendations of
the International Climate Change Task Force concurred with several of the
Wind Force 12 policy recommendations;
“a long term objective be established to prevent global average temperature
from rising more than 2°C above the pre-industrial level”
“G8 Governments establish national renewable portfolio standards to generate at
least 25% of electricity from renewable energy sources by 2025, with higher
targets needed for some G8 Governments”
“Governments remove barriers to and increase investment in renewable energy
and energy efficient technologies and practice such measures as the phase-out of
fossil fuel subsidies”
The key role of renewable energies like wind power in tackling climate change
is acknowledged. The European Commission report Action on Climate Change
post 2012 published in February this year stated that “Renewable energies will
have to play a much larger role in the future”. The 2004 European Environment
Agency (EEA) assessment on greenhouse gas emission trends in Europe
concluded that “the promotion of renewable energy has the greatest impact on
emissions in most EU Member States for both implemented and planned
policies”.
[4] WIND FORCE 12 REPORT 2005[OVERVIEW]
Currently wind power installed in Europe today is already saving over 50 “CLIMATE CHANGE TOUCHES ON ALL
million tonnes of CO2 every year. In terms of carbon delivery, wind energy is ASPECTS OF OUR SOCIETY. IT IS A
outperforming many other proposed solutions. The European Wind Energy THREAT NOT ONLY TO THE
Association’s business-as-usual target for 2010 of 75GW, a doubling of ENVIRONMENT, BUT ALSO TO OUR
installed capacity in 6 years, would deliver one third of the EU’s Kyoto ECONOMIES, AND, IN THE END OUR
SECURITY”
commitment.
Stavros Dimas, Environment
Commissioner, 18th April 2005, Speech
Greenpeace’s calculations show that to keep open the option of remaining ‘Meeting the climate challenge’
below 2° C global temperature rise means cuts in industrialised country Brookings Institute, Washington DC
emissions of at least 30% by 2020. But while that might seem difficult, it pales
in comparison with the task of both convincing and enabling the booming
economies in China and India to take the urgent and necessary steps to
decarbonise their economies to the point where they can talk about absolute
emissions caps and, eventually, reductions - and to do this without sacrificing
the economic growth and development their populations rightly demand.
One part of both convincing and enabling these countries to participate in the
task of saving the climate will be to establish financial and technology transfer
mechanisms which will allow the inevitably massive investment in their energy
sectors to be primarily in renewable energies. Wind energy can and should play
a major role in that.
GLOBAL FORCE
As a power technology which can cut carbon, help to meet growing electricity
demand, and provide energy security, wind energy is a leading candidate. Wind
power is one of the few energy supply technologies that have the maturity,
clout and global muscle to deliver deep cuts in CO2, while providing a hedge
against fluctuating fossil fuel prices and reducing energy import dependence.
Wind Force 12 is a practical blueprint for action that governments can
implement, and shows what is possible with just one renewable technology.
The message from this report is clear. Wind power is world scale; it has the
capacity to satisfy the energy and development needs of the world without
destroying it; and it will play a key role in our future sustainable energy supply.
[Corin Millais] [Sven Teske]
Chief Executive, Renewables Director,
European Wind Energy Association Greenpeace International
Executive Council Representative, GWEC
WIND FORCE 12 REPORT 2005 [5]THE GLOBAL MARKET STATUS OF WIND POWER
Wind turbines in Denmark
Over the past five years, global wind power capacity has continued to grow at an
average cumulative rate of 28% (Figure 2-2). The increase in the rate of annual
installation has been an average of 15.8% (Figure 2-1). During 2004 alone, more
than 8,000 MW of new capacity was added to the electricity grid worldwide,
representing a turbine business sector worth approximately €8 billion.
By the end of 2004, the capacity of wind energy installed globally had reached
a level of almost 48,000 MW. Europe accounts for 72% of the total installed
capacity and for 73% of the annual market growth during 2004. But other
regions are beginning to emerge as substantial markets for the wind industry.
Over 50 countries around the world now contribute to the global total, and
the number of people employed by the industry worldwide is estimated to be
90-100,000, with 70-80,000 of these in Europe.
GROWTH IN WORLD WIND POWER MARKET 1999-2004
Annual installed capacity (MW) [Figure 2-1]
9000
8000
7000
6000
5000
4000
3000
2000
1000
0
Year 1999 2000 2001 2002 2003 2004 Average growth
rate over 5 years
Annual installed capacity (MW) 3,922 4,495 6,824 7,227 8,344 8,154
Growth rate 51% 15% 52% 6% 15% -2.3% 15.8%
[6] WIND FORCE 12 REPORT 2005[THE GLOBAL MARKET STATUS OF WIND POWER]
Cumulative installed capacity (MW) Figure 2-2]
50000
40000
30000
20000
10000
0
Year 1999 2000 2001 2002 2003 2004 Average growth
rate over 5 years
Cumulative capacity (MW) 13,932 18,449 24,927 32,037 40,301 47,912
Growth rate 37% 32% 35% 29% 26% 19% 28%
WORLDWIDE MARKETS
Within Europe, Spain became the new market leader, with 2,064 MW of
capacity installed during 2004. This was closely followed by Germany, with
2,054 MW. Germany still has by far the largest cumulative capacity both in
Europe and globally, with a total of 16,649 MW by the end of the year.
Four other members of the European Union – Austria (192 MW), Italy (357
MW), the Netherlands (199 MW), Portugal (274 MW), and the UK (253 MW)
saw impressive additions to their capacity during 2004. This means that three
EU member states have either moved through or are close to the 1,000 MW
cumulative total. These are Italy, with 1,261 MW, the Netherlands with 1,081
MW and the UK with 889 MW.
In the leading countries, Denmark meets 19% of its national electricity
demand from wind power, in Spain the figure is 6% and in Germany it is 5%.
In the Americas, the United States market experienced a slowdown during
2004, which resulted in a reduction of the global growth rate, mainly as a
result of the failure of Congress to renew the Production Tax Credit (PTC)
incentive in good time. Total US capacity has now reached 6,750 MW. Canada,
with one of the largest wind resources in the world, is looking increasingly
promising as a market. A total of 444 MW had been reached by the end of
2004, and many large projects are progressing fast.
WIND FORCE 12 REPORT 2005 [7][THE GLOBAL MARKET STATUS OF WIND POWER]
New markets are also opening up in other continents. Australia almost doubled
its capacity in 2004 to reach 421 MW, with a large number of projects in the
pipeline. In Asia, the Indian market has revived strongly after a quiet period in
the late 1990s. During 2004, almost 900 MW was installed, the third largest
country market, taking the total up to 3,000 MW. Japan also registered an
improved performance in 2004, reaching a total of 991 MW, whilst China
moved up to 769 MW.
In Africa, both Egypt and Morocco have shown what is possible with national
planning and the backing of European developers. Morocco already gets 2% of
its electricity from a 50 MW wind farm and tenders exist for another 200 MW,
Egypt is continuing to develop sites along the Red Sea coast with the support
of German, Japanese and Danish aid agencies.
However the current global wind power market today is limited to a tiny
handful of countries. Over 50% of the global market in 2004 was created in
only 3 countries – Germany, Spain and India, with the first two counting for
40%. 66% of the entire wind energy installed in the world the world is located
in only 3 countries - Germany, Spain and the USA.
TOP TEN WIND POWER MARKETS 2004: ANNUAL MW INSTALLED
Netherlands
Country Installed capacity 2.4%
in 2004 (MW) Japan China
Spain 2,064 2.8% 2.4%
UK
Germany 2,054
3.1%
India 875
USA 389 Portugal Spain
Italy 357 3.4% 25.3%
Portugal 274
Italy
UK 253
4.4%
Japan 230
Netherlands 199
China 198 USA
Total 6,893 4.8%
India
10.7%
Germany
25.2%
[8] WIND FORCE 12 REPORT 2005[THE GLOBAL MARKET STATUS OF WIND POWER]
TOP TEN WIND POWER MARKETS 2004: CUMULATIVE MW INSTALLED
Japan
Country Total capacity
2.1% UK China
End 2004 (MW)
1.9% 1.6%
Netherlands Germany 16,649
2.3% Spain 8,263
Italy USA 6,750
2.6% Germany Denmark 3,083
India 34.7% India 3,000
6.3% Italy 1,261
Netherlands 1,081
Japan 991
UK 889
Denmark China 769
6.4% Total 42,735
USA
14.1%
Spain
17.2%
CUMULATIVE INSTALLATION ( MW) IN THE TOP TEN WIND POWER MARKETS
Country Cumulative Cumulative Cumulative Cumulative Growth rate 3 years
installed installed installed installed 2003-2004 average
end 2001 end 2002 end 2003 end 2004 % %
Germany 8,734 11,968 14,612 16,649 13.9% 24.0%
Spain 3,550 5,043 6,420 8,263 28.7% 32.5%
USA 4,245 4,674 6,361 6,750 6.1% 16.7%
Denmark 2,456 2,880 3,076 3,083 0.2% 7.9%
India 1,456 1,702 2,125 3,000 41,2% 27,3%
Italy 700 806 922 1,261 36.7% 21.7%
Netherlands 523 727 938 1,081 15.3% 27.4%
Japan 357 486 761 991 30.2% 40.5%
UK 525 570 759 889 17.1% 19.2%
P.R. China 406 473 571 769 34.7% 23.7%
Total “ten” 22,952 29,329 36,545 42,735 16.9% 23.0%
Source BTM Consult
WIND FORCE 12 REPORT 2005 [9][THE GLOBAL MARKET STATUS OF WIND POWER]
THE GLOBAL BENEFITS OF WIND POWER
• Reduces climate change and other environmental pollution
• Creates employment, regional growth and innovation
• Diversifies energy supply, eliminates imported fuels
• Provides energy security and prevention of conflict over
natural resources
• Reduces poverty through improved energy access
• Provides a hedge against the price volatility of fossil fuels
• Fuel source is free, abundant and inexhaustible
• Global wind resource is bigger than global power demand
• Delivers utility-scale power supply
• Modular and rapid to install
[10] WIND FORCE 12 REPORT 2005WIND POWER AND ENERGY POLICY REFORM
Turkey
At a time when governments around the world are in the process of “WE NEED TO MAKE SUSTAINABLE
liberalising their electricity markets, wind power’s increasing ENERGY A RATIONAL ECONOMIC
competitiveness should lead to higher demand for wind turbines. Without CHOICE FOR INVESTORS ACROSS
political support, however, wind power remains at a competitive THE GLOBE. THIS WILL BE A CENTRAL
disadvantage, because of distortions in the world’s electricity markets FOCUS OF THE UK’S PRESIDENCY OF
BOTH THE G8 AND THE EU IN 2005.”
created by decades of massive financial, political and structural support to
Margaret Beckett, UK Environment
conventional technologies.
Secretary, Refocus, 5th January 2005
The following is a summary of the current political frameworks for wind power
and barriers that must be overcome in order to unlock wind power’s great
potential to become a major contributor to global energy supply in the future.
New wind power stations have to compete with old nuclear and fossil fuel
power stations that produce electricity at marginal costs, because interest and
depreciation on the investments have already been paid for by consumers and
taxpayers.
More than 25 years of wind power experience in Europe shows that successful
frameworks for the development and deployment of wind energy must include
the appropriate measures in each of these five vital areas:
• Legally binding targets for Renewable Energy
• Well designed payment mechanism
• Grid access and strategic development of the grids
• Good governance and appropriate administrative procedures
• Public acceptance and support
1. LEGALLY BINDING TARGETS FOR RENEWABLE ENERGY
In recent years an increasing number of countries have established targets for
renewable energy, as part of their greenhouse gas reduction policies. These are
either expressed as specific amounts of installed capacity or as a percentage of
energy consumption. The most ambitious target has been set by the European
Union. In 2001, the European Council and the European Parliament adopted a
Renewable Energy Directive establishing national targets for each member
WIND FORCE 12 REPORT 2005 [11][WIND POWER AND ENERGY POLICY REFORM]
“IN THE CONTEXT OF THE LISBON country. Although these targets are indicative, they have served as a very
STRATEGY, THE KOK REPORT important catalyst in initiating political initiatives throughout Europe to increase
STRESSES THAT THE EU CAN GAIN A renewable energy’s share of electricity supply. The Directive aims to double
FIRST MOVER ADVANTAGE AND CAN renewables’ share of the energy mix from 6% to 12% by 2010, equal to 21% of
CREATE A COMPETITIVE EDGE BY EU electricity consumption. The next step forward from the Directive is that the
FOCUSING ON RESOURCE-EFFICIENT
Commission should submit proposals to the European Parliament and Council for
CLIMATE FRIENDLY TECHNOLOGIES
mandatory renewables energy targets. Furthermore, targets should be set for 2020
THAT OTHER COUNTRIES WILL NEED
TO ADOPT” and the adoption of a legally binding target to achieve a minium 20% renewable
‘Winning the battle against climate ernergy by 2020 in the EU25 should be set. A time-horizon of six years is not long
change’, European Commission, in an electricity sector where the investment horizon is up to 40 years.
9th February 2005
Setting targets serve as a very important catalyst for governments to take action
and develop the necessary regulatory frameworks to expand renewables such as
financial frameworks, grid access regulation, planning and administrative
procedures. However, targets have little value if they are not accompanied by
policies which compensate for historical and present distortions in electricity
markets, eliminate market barriers and create an environment which attracts
investment capital.
2. SPECIFIC POLICY MECHANISMS
A clear market for wind generated power must be defined in order for a
project developer to enter. As with any other investment, the lower the risk
to the investor, the lower the costs of supplying the product. The most
important measures for establishing new wind power markets are therefore
those where the market for generated power is clearly defined in national
laws, which include provisions for stable, long term fiscal measures which
minimise investor risk and ensure an adequate return on investment.
The main purpose of the wide range of available economic measures to
encourage renewable energy technology investments is to provide incentives
for technological improvements and cost reductions of environmental
technologies. That will ensure that we will have competitive, clean technologies
available in the future as a competitive alternative to conventional, polluting
Italy power sources. Markets need to be strong, stable and reliable, with a clear
commitment to long-term expansion. A number of mechanisms have been
introduced in different countries to further these aims.
Overall, there are two types of incentives to promote deployment of renewable
energy:
2.1 Fixed Price Systems where the government sets the electricity prices (or
premiums) paid to the producer and lets the market determine the quantity.
There are many variants of the fixed price system. The term is rather
misleading as not all of them actually fix the total price per kWh paid to the
producer but for analytical purposes it is valuable to make a distinction
between fixed prices and fixed quantities:
1. Investment Subsidies
2. Fixed Feed-in Tariffs
3. Fixed Premium Systems
4. Tax Credits.
[12] WIND FORCE 12 REPORT 2005[WIND POWER AND ENERGY POLICY REFORM]
2.2 Renewable Quota Systems where the government sets the quantity of
renewable electricity and leaves it to the market to determine the price. This
system is used in some states in the USA, referred to as Renewable Portfolio
Standards, and a number of EU countries such as the UK, Sweden, Belgium and
Italy.
Two types of renewable quota systems have been employed in national wind
power markets: Tendering Systems and Green Certificate Systems.
2. 3 Design criteria
However, Incentive schemes need to ‘fit’ within the relevant national/regional
context, but regardless of what type of scheme is chosen, 10 key criteria
should be met when designing a support scheme:
Carno Wind Farm, Wales.
1. Compatibility with the polluter pays principle
2. High investor confidence
3. Simple and transparent in design and implementation “[…] WE NEED TO ACT NOW. DELAY
4. High effectiveness in deployment of renewables WILL ONLY INCREASE THE
5. Encouraging technology diversity SERIOUSNESS OF THE PROBLEMS WE
6. Encouraging innovation, technology development and lower costs NEED TO REVERSE, AND THE
7. Compatibility with the power market and with other policy instruments ECONOMIC DISRUPTION REQUIRED
8. Facilitating a smooth transition (“Grandfathering”) TO MOVE TO MORE RENEWABLE
9. Encouraging local and regional benefits, public acceptance and site FORMS OF ENERGY AND
dispersion SUSTAINABLE MANUFACTURING IN
THE FUTURE…“
10. Transparency and integrity: Protecting consumers, avoiding fraud and free riding
Tony Blair, UK Prime Minister,
The Economist, 1-7 January 2005
2. 4 Defined and stable returns for investors
Policy measures adopted by governments need to be acceptable to the
requirements of the investment community in order to be effective. There are
two key issues:
• The price for renewable power must allow for risk return profiles that are
competitive with other investment options.
• The duration of a project must allow investors to recoup their investment.
3. ELECTRICITY MARKET REFORM
Essential reforms in the electricity sector are necessary if new renewable
energy technologies are to be accepted at a larger scale. These reforms include:
3.1 Removal of electricity sector barriers to renewables
Current energy legislation on planning, certification and grid access has been
built around the existence of large centralised power plants, including
extensive licensing requirements and specifications for access to the grid.
This favours existing large scale electricity production and represents a
significant market barrier to renewables. Furthermore it does not recognise
the value of not having to transport decentralised power generation over
long distances.
Distortions in the conventional power market include, for example: institutional
and legal barriers; existence of regional and national dominant players; potential
for abuse of dominant positions; barriers to third party access; limited
interconnection between regional and national markets; discriminatory tariffs,
WIND FORCE 12 REPORT 2005 [13][WIND POWER AND ENERGY POLICY REFORM]
“IT IS NOT A CHOICE, AS SOME no effective unbundling of production and transmission. One big challenge is to
SUPPOSE, BETWEEN ECONOMIC make the necessary redesigns of the grid infrastructure, system management,
PROSPERITY AND TACKLING CLIMATE grid regulation and grid codes that reflect the characteristics of renewable
CHANGE. IT IS TECHNOLOGICAL energy technologies. Cross-border electricity interconnectors are also vital for
ADVANCES AND ECONOMIC
those markets that are not geographically isolated.
DEVELOPMENT THAT WILL PROVIDE
THE REALISTIC SOLUTION. IT IS THE
FIRMS AND COUNTRIES THAT LEAD The reforms needed to address market barriers to renewables include:
THE WAY IN ADAPTING TO THIS • Streamlined and uniform planning procedures and permitting systems and
CHALLENGE THAT WILL HAVE THE integrated least cost network planning;
COMPETITIVE ADVANTAGE IN THE • Access to the grid at fair, transparent prices and removal of discriminatory
FUTURE.” access and transmission tariffs;
Tony Blair, UK Prime Minister, PA • Fair and transparent pricing for power throughout a network, with recognition
News, 29th December 2004 and remuneration for the benefits of embedded generation;
• Unbundling of utilities into separate generation and distribution companies;
• The costs of grid infrastructure development and reinforcement must be
carried by the grid management authority rather than individual renewable
energy projects;
• Disclosure of fuel mix and environmental impact to end users to enable
consumers to make an informed choice of power source.
3.2 Removal of market distortions
In addition to market barriers there are also market distortions which block
the expansion of renewable energy. These distortions are in the form of
direct and indirect subsidies, and the social cost of externalities currently
excluded from costs of electricity production.
A major barrier preventing wind power from reaching its full potential is the
fundamental lack of pricing structures in the energy markets that reflect the
full costs to society of producing energy.
Furthermore, the overall electricity market framework is very different today from
the one that existed when coal, gas, and nuclear technologies were introduced. For
most of a century, power generation has been characterized by national
monopolies with mandates to finance investments in new production capacity
through state subsidies and/or levies on electricity bills. As many countries are
moving in the direction of more liberalised electricity markets, those options are
no longer available, which put new generating technologies, such as wind power,
at a competitive disadvantage relative to existing technologies.
3.2.1 End subsidies to fossil fuel and nuclear power sources
Subsidies to fully competitive and polluting technologies are highly
unproductive, seriously distort markets and increase the need to support
renewables. Removing subsidies to conventional electricity would not only
save taxpayers’ money and reduce current market distortions in the electricity
market. It would also dramatically reduce the need for renewables support.
Wind power would not need special provisions if markets were not distorted
by the fact that it is still virtually free for electricity producers to pollute.
Subsidies artificially reduce the price of power, keep renewables out of the
market place, and prop up increasingly uncompetitive technologies and fuels.
Eliminating direct and indirect subsidies to fossil fuels and nuclear power would
help move us toward a level playing field across the energy sector.
[14] WIND FORCE 12 REPORT 2005[WIND POWER AND ENERGY POLICY REFORM]
Wind farms in Spain
Conventional energy sources receive an estimated $250-300 billion in “THE PROMOTION OF RENEWABLE
subsidies per year worldwide, and therefore markets are heavily distorted. The ENERGY HAS THE GREATEST IMPACT
UNDP World Energy Assessment in 2000 stated that in the mid-1990s ON EMISSIONS IN MOST MEMBER
governments worldwide were subsidizing fossil fuel and nuclear power by STATES FOR BOTH IMPLEMENTED
around $250-300 billion. In 1997, the World Bank estimated that annual fossil AND PLANNED POLICIES”
EEA report “Analysis of greenhouse
fuel subsidies were $58 billion in the OECD and the 20 biggest countries
gas emission trends and projections in
outside the OECD.
Europe 2003”, Technical report
N°4/ December 2004
R&D funding can make the crucial difference as to whether a technology
becomes commercially viable, particularly at the early stage of development.
It also accounts for about 40% of continued cost reductions in the technology.
Over the last three decades 92% of all R& D funding – ($267 billion) has been
spent on non renewables, largely fossil fuel and nuclear technologies, compared
to 8% ($23 billion) for all renewable technologies.
3.2.2. Internalise the social and environmental costs of polluting energy
The real cost of energy production by conventional energy includes expenses
absorbed by society, such as health impacts and local and regional
environmental degradation – from mercury pollution to acid rain – as well as
global impacts from climate change.
Hidden costs also include the waiving of nuclear accident insurance that is
either unavailable or too expensive to be covered by the nuclear operators. In
addition, costs for decommissioning, unsolved problems with the storage of
high level nuclear waste, health costs associated with mining, drilling, etc are
not added to the real costs of fossil and nuclear power.
Environmental damage should as a priority be rectified at source. Translated
into energy generation that would mean that, ideally, production of energy
should not pollute and that it is the energy producers’ responsibility to prevent
it. If they do pollute they should pay an amount equal to the damage the
production causes to society as a whole.
The European Commission – through a project called ExternE – has tried to
quantify the true costs, including environmental costs of electricity generation.
WIND FORCE 12 REPORT 2005 [15][WIND POWER AND ENERGY POLICY REFORM]
Novar Wind Farm, Scotland.
“OUR PLANET IS AT RISK. WITH It estimates that the cost of producing electricity from coal or oil would
CLIMATE CHANGE, THERE IS AN double and the cost of electricity production from gas would increase by 30 %,
ECOLOGICAL TIME-BOMB TICKING if external costs, in the form of damage to the environment and health, were
AWAY, AND PEOPLE ARE BECOMING taken into account. The study further estimates that these costs amount to
INCREASINGLY CONCERNED BY THE 1-2 % of EU GDP or between € 85 billion and € 170 billion/annum, not
CHANGES AND EXTREME WEATHER
including the additional costs of the impacts of human-induced climate
EVENTS THEY ARE ALREADY SEEING.
change on human health, agriculture and ecosystems. If those environmental
URGENT ACTION IS REQUIRED IF WE
ARE TO WIN THE BATTLE AGAINST costs were levied on electricity generation according to their impact, many
THIS PROBLEM. THAT CAN ONLY renewables, including wind power, would not need any support to successfully
HAPPEN WITH STRONG POLITICAL compete in the marketplace. In the EU alone, wind power in 2005 avoids
LEADERSHIP.” external cost of electricity production of approximately €5 billion.
Stephen Byers, UK MP,
co-chair International Climate Change As with other subsidies, such external costs must be factored into energy
Taskforce, 24th January 2005 pricing if competition in the market is to be truly fair. This requires that
governments apply a “polluter pays” system that charges the emitters
accordingly, or applies suitable compensation to non-emitters. Adoption of
polluter pays taxation to polluting electricity sources, or equivalent
compensation to renewable energy sources, and exclusion of renewables from
environment related energy taxation, is important to achieve fairer
competition on the world’s electricity markets.
[16] WIND FORCE 12 REPORT 2005INTERNATIONAL POLICIES
Wind farm in the Philippines
IMPLEMENTATION OF THE KYOTO PROTOCOL AND “THE EUROPEAN COUNCIL
POST 2012 REDUCTIONS FRAMEWORK ACKNOWLEDGES THAT CLIMATE
CHANGE IS LIKELY TO HAVE MAJOR
NEGATIVE GLOBAL
Implementation of the Kyoto Protocol to the United Nations Framework
ENVIRONMENTAL, ECONOMIC AND
Convention on Climate Change is a first vital step towards protecting the SOCIAL IMPLICATIONS.....REDUCTION
climate from dangerous anthropogenic climate change – the overall goal of the PATHWAYS FOR THE GROUP OF
Climate Convention. The Protocol as a legally binding international instrument DEVELOPED COUNTRIES IN THE
heralds the beginning of carbon constrained economies. In time, this will mean ORDER OF 15-30% BY 2020
an increased demand for low and no carbon power production. Protecting the ...SHOULD BE CONSIDERED”
climate will demand more and deeper cuts in greenhouse gas emissions which Presidency conclusions
will further increase the demand and market for renewable energy technologies Brussels European Council,
such as wind power. 22 -23 March 2005
The international issue now is what objectives for reduction in greenhouse gases
will follow on from the present 2008-12 target period. The EU Heads of states
meeting in March recommended that “reduction pathways… in the order of 15-
30% by 2020, compared to the baseline envisaged in the Kyoto Protocol…
should be considered.” Furthermore, it is critical that the next round of emissions
reductions be agreed soon, so that the market is clear that the strong system
sent by the entry into force of the Kyoto Protocol continues beyond 2012.
Emissions trading
Emissions trading in its current form at the European level will not be a short
term boost for wind energy. The first steps in the Emission Trading system send
a good signal to markets about the costs of carbon-intensive energy production,
but they don’t go far enough and need to be strengthened in the next round. In
particular, free allocation of allowances should be replaced by 100% auctioning
to avoid market distortions and apply the polluter pays principle.
A short term approach to emissions reductions will capture the once in a
lifetime solutions, such a shift form coal to gas, but does not yet encourage
the development of renewable technologies which are a precondition to
combating climate change in the long run at the lowest possible cost.
Emissions trading should not be seen as a substitute for environmental taxes
or policies to support renewable energy. Bozcaada wind farm, Turkey
WIND FORCE 12 REPORT 2005 [17][WIND POWER AND ENERGY POLICY REFORM]
“G8 GOVERNMENT ESTABLISH REFORM OF EXPORT CREDIT AGENCIES (ECAs),
NATIONAL RENEWABLE PORTFOLIO MULTI-LATERAL DEVELOPMENT BANKS (MDBs) AND
STANDARDS TO GENERATE AT LEAST
25% OF ELECTRICITY FROM
INTERNATIONAL FINANCE INSTITUTIONS (IFIs)
RENEWABLE SOURCES BY 2025,
WITH HIGHER TARGETS FOR SOME Demand for energy, particularly electricity, is increasing worldwide. This is
G8 GOVERNMENTS” especially the case in developing countries, which rely heavily on export credit
‘Meeting the climate challenge’ agencies and multi-lateral development banks to provide financing for energy
Recommendations of the and other industrial projects. To be consistent with the emerging international
International Climate Change Task regime for limiting greenhouse gas emissions, ECAs and other international
Force, January 2005 financial institutions which support or underwrite projects around the world
must have policies consistent with the need for limiting greenhouse gas
emissions and climate change protection. At the same time there needs to be a
transition plan and flexible timeframes to avoid undue hardships on developing
country economies overly reliant upon conventional energy sources and
exports, whilst also recognising that meeting the development goals for the
world’s poorest will require subsidies for the foreseeable future.
Policies to address these issues must include:
• A defined and increasing percentage of overall energy sector lending directed
to renewable energy projects.
• A rapid phase out of support for conventional, polluting energy projects.
G8 RECOMMENDATIONS
In January, the report ‘Meeting the climate challenge’ - Recommendations of
the International Climate Change Task Force concurred with several of the
Wind Force 12 policy recommendations;
“A long-term objective be established to prevent global average temperature
from rising more than 2°C (3.6°F) above the pre-industrial level, to limit the
extent and magnitude of climate-change impacts.”
“G8 Governments establish national renewable portfolio standards to generate at
least 25% of electricity from renewable energy sources by 2025, with higher
targets needed for some G8 Governments”
“Government remove barriers to and increase investment in renewable energy
and energy efficient technologies and practice such measures as the phase-out of
fossil fuel subsidies”
Implementation of these recommendations would support the achievement of
overall target of Wind Force 12.
Turkish wind farms
[18] WIND FORCE 12 REPORT 2005[WIND POWER AND ENERGY POLICY REFORM]
Turkish wind farms
POLICY SUMMARY ”AND AS ECONOMIC INSTABILITY
INCREASES RISK AND UNDERMINES
INVESTMENT, SO CLIMATE CHANGE
National policies
WILL COME TO THREATEN OUR
1. Establish legally binding targets for renewable energy
ECONOMIC DEVELOPMENT AND
2. Create legally based market deployment instruments GROWTH”
3. Provide defined and stable returns for investors UK Chancellor of Exchequer Gordon
• The price for renewable power must allow for risk return profiles that are Brown, 15th March 2005.
competitive with other investment options.
• The duration of a project must allow investors to recoup their investment.
3. Electricity market reforms
3.1. Remove electricity sector barriers to renewables
3.2. Remove market distortions
• Halt subsidies to fossil fuel and nuclear power sources.
• Internalise social and environmental costs of polluting energy.
International policies
1. Kyoto Protocol and post 2012 cuts
2. Reform of Export Credit Agencies (ECAs), Multi-lateral Development Banks
(MDBs) and International Finance Institutions (IFIs)
• A defined and increasing percentage of overall energy sector lending
directed to renewable energy projects.
• A rapid phase out of support for conventional, polluting energy projects.
3. Implementation of key G8 task force recommendations
WIND FORCE 12 REPORT 2005 [19]COUNTRY REPORTS
Australia
For the Australian wind industry, the past three years have seen both
exceptional growth and some uncertainty. While Australia has forty times less
installed capacity than Germany, the world leader, the potential is enormous.
Australia is twenty times larger than Germany, with one of the strongest and
most abundant wind resources on the planet. This sparsely populated continent
has therefore long been regarded as a potential hot spot for wind power
generation.
Wind power in Australia: CURRENT INDUSTRY GROWTH
cumulative Megawatts
installed Wind energy capacity in Australia almost doubled last year, reaching 380 MW
by the end of 2004. At the same time approximately 1,281 MW of new
Year MW projects are either approved or under construction, with many more in the
2000 32 process of development. Once installed, these will provide enough electricity to
2001 73 meet the demands of about 750,000 homes.
2002 104
2003 198 A further 4,202 MW of projects have been identified at various stages of
2004 380 development, with a total of 6,221 MW of capacity in the pipeline. In addition,
there are a large number of potential projects not yet in the public domain.
Growth of capital expenditure on wind farms has been equally rapid over the
last two years and is forecast to continue at an extraordinary rate. Total
expenditure of approximately A$1.62 billion is expected by 2007 under current
policy arrangements.
MANUFACTURING POTENTIAL
An important driver for the Australian industry has been the development of a
local manufacturing industry. International manufacturers say they are
attracted to the country because it is well situated to export throughout the
Asia-Pacific region, and because it has political stability, a well developed
[20] WIND FORCE 12 REPORT 2005[COUNTRY REPORTS]
infrastructure and an array of other positive social, economic and
financial factors.
Australia now has a nacelle assembly plant (Vestas), nacelle and
nose cone manufacturer (AusTech Composites) and a turbine tower
manufacturer (Haywards Engineering) situated in Tasmania. The
steel industry is also benefiting significantly from the turbine
construction business. Air-Ride Technologies, based in South
Australia, is a major steel fabrication company supporting the
industry, while there are also plans to establish local blade
manufacturing in Victoria, where there is already a manufacturing
plant building wind towers and components (Keppel Prince).
Australian produced content in new wind farms is currently
estimated at about 50 per cent, with the balance largely coming
from Danish and German manufacturers.
KEY GROWTH DRIVERS
The growth of the renewable energy industry in Australia has been
primarily supported by the strategic initiatives that have flowed
from the federal government’s 1998 National Greenhouse Strategy
– the framework for advancing Australia's domestic greenhouse
response. A number of initiatives were also introduced in the 2004
White Paper on energy and the environment, “Securing Australia’s
Energy Future”. Wind farm, Australia
The Australian government, through the Australian Greenhouse Office, delivers
the majority of these initiatives under the A$1.8 billion climate change
strategy. These include a wide range of measures focusing on the energy,
transport and agricultural sectors.
Mandatory Renewable Energy Target (MRET)
MRET is the cornerstone of the Australian renewable energy industry. This
legislation, introduced in 2001, mandated an initial target of an additional two
per cent (later converted to 9,500 gigawatt hours (GWh)) of renewable energy
by 2010. This target requires electricity wholesalers and retailers to source an
annually increasing percentage of their supply from registered renewable
generators, or pay a shortfall penalty of A$40 per megawatt hour (MWh).
A review of the MRET scheme in 2003 recommended increasing the target
from 9,500 GWh in 2010 to 20,000 GWh by 2020, and holding the target at
this level until 2035. The government’s response in June 2004, however, was to
retain the existing target, while refining some of the processes associated with
its administration and operation. At the current rate of market growth, the
existing MRET is expected to be filled by 2007.
AusWEA is currently exploring alternative industry development mechanisms
with the Federal Government, and is confident that an outcome will eventually
be reached which recognises the important contribution thatwind energy can
make to Australia’s future energy supply needs .
WIND FORCE 12 REPORT 2005 [21][COUNTRY REPORTS]
“IN THE LONG TERM, CLIMATE State-based initiatives
CHANGE POSES A GREATER THREAT In response to the federal decision not to increase the current MRET, several
TO AUSTRALIA THAN TERRORISM. TO state governments initiated their own proposals for a state-based renewable
ATTRACT INVESTMENT IN energy target during 2004. As a result, state energy ministers from New South
RENEWABLE ENERGY, WE NEED TO Wales, Victoria, South Australia and Tasmania have agreed to:
PROVIDE FINANCIAL INCENTIVES
FOR ELECTRICITY GENERATORS TO
1. Accelerate the current work being done on emissions trading.
MOVE AWAY FROM DIRTY-COAL-
FIRED ELECTRICITY TO ALTERNATIVES 2. Establish an Inter-jurisdictional Working Group to recommend ways to
SUCH AS BIOMASS, SOLAR, WIND increase the MRET from the current level and time frame, noting the
ENERGY, HYDRO AND HOT ROCKS." recommendations of the federal government commissioned review of
Premier Mike Rann. Premier of South MRET as a minimum outcome.
Australia, 27th August 2004 3. Demand immediate action by the federal government to offer incentives
to promote energy efficiency and demand management.
In addition, some Australian states have also established their own greenhouse
gas abatement programs and wind energy targets.
FUTURE GROWTH POTENTIAL
Pressure is mounting on Australian governments to respond to the country’s
rising greenhouse gas emissions. The Australian Greenhouse Office’s National
Greenhouse Gas Inventory shows that the energy sector has experienced the
largest increases in greenhouse gas emissions, with a 31 per cent increase since
1990. Australia’s rising energy emissions have sparked an energy debate around
the country, focused on looking for alternative fuel sources such as wind
energy as the way forward for future energy growth.
A report commissioned in 2003 by the Australian Greenhouse Office found
that the national electricity market could readily accept an installed wind
capacity of 8,000 MW with appropriate siting, commercial wind output
forecasting and the continual enhancement of of interstate connectivity. This is
over twenty times Australia’s current installed capacity, attainable without
significant wind specific modifications to existing electrical infrastructure.
Given a stronger political commitment to a cleaner energy future for Australia
and appropriate investment in electrical infrastructure, the future role for wind
power in Australia could be even more substantial.
Although there are a wide range of technologies that can help to contribute to
reducing Australia’s greenhouse emissions, including those which reduce or
eliminate the emissions from traditional fossil fuel sources, the costs of many of
these technologies are as yet unknown and they are complex and site sensitive.
It is likely that many of them will prove to be more expensive than wind power.
The cost of electricity from wind today has already declined globally by three
quarters since the 1970s and a recent report commissioned by AusWEA
predicts that the cost of wind energy in Australia could be competitive with
fossil fuels within 10-15 years, even without additional costs imposed on fossil
1 Transition Institute (2004), Cost Convergence of Wind Power and
Conventional Generation in Australia, fuels to reduce emissions1.
http://www.thewind.info/downloads/WindConvergenceReport.pdf
www.wwf.org.au/News_and_information/
Publications/PDF/Report/clean_energy_future_report.pdf
[22] WIND FORCE 12 REPORT 2005[COUNTRY REPORTS]
A report produced for the Australian Clean Energy Futures Group in 2004
which looks at scenarios in which greenhouse emissions from Australian
stationary energy in 2040 are 50% of their level in 2001 found that wind
power would have a significant role to play in achieving such reductions. As a
relatively low, cost zero emission technology wind power will “need to be
adopted to the point where it starts to require significant back-up generation
(from gas turbine plant) in order to achieve acceptable levels of availability,
having regards to the diversity available through differences in prevailing wind
conditions at any given time across the extensive areas covered by the two
major Australian grids (eastern and south west).” The report estimated that this
would equate to a contribution of around 20% of the required total generation
in 2040 or an installed capacity of 19,000 MW and assessed that there were
sufficient sites in Australia capable of generating wind energy at reasonable
cost, for wind power to be able to supply this level of generation.
Brazil
Among the nations of South America, Brazil has emerged as the most
promising market for wind power development. The largest country in the
continent currently gets 70% of its power from large hydroelectric schemes,
with the rest coming from thermal fossil fuel stations (14%), nuclear (2%),
small renewables – solar, biomass and small hydro (5%) and imports (9%).
Only 29 MW of wind capacity has so far been installed.
This situation is about to change following the introduction of the Proinfa
programme to promote the introduction of new sources of renewable energy.
Apart from environmental considerations a major impetus behind Proinfa was
the power crisis faced by Brazil after a period of low rainfall and subsequent poor
performance by the country’s large hydro plants, resulting in electricity cuts.
The aim of the first phase of Proinfa legislation is to support the installation of
3,300 MW of renewable capacity by the end of 2006, one of the world’s most
ambitious targets. About 1,100 MW of this is expected to come from biomass,
1,100 MW from small hydro and 1,100 MW from wind. The Brazilian Wind
Energy Centre expects up to 1,350 MW of wind capacity to be installed by the
end of 2006.
In a second phase of the Proinfa policy, the Brazilian government has set a
target for 10% of the country’s electricity to come from renewables (wind,
biomass and small hydro) by 2022. This could mean between 100 and 200
MW of wind capacity being installed each year.
CURRENT STATUS
By the autumn of 2004, power purchase agreements had already been signed
for well over 1,000 MW of wind capacity. Of these proposed projects, 483 MW
were located along the country’s north east coastline and 454 MW in the far
south. Under Proinfa, wind energy producers receive a premium price and 20
years power purchase contracts. All Brazilian consumers pay for this price
WIND FORCE 12 REPORT 2005 [23][MAP]
OECD EUROPE
12% wind power in 2020 (GW) 230
OECD NORTH AMERICA 12% electricity production from wind power 2020 (TW/h) 626.0
12% wind power in 2020 (GW) 310 Annual reduction of C02 in 2020 (billion tonnes) 375.6
12% electricity production from wind power 2020 (TW/h) 800 Cumulative invest. up to 2020 (€ billion) 130.6
Annual reduction of C02 in 2020 (billion tonnes) 480.0 Annual installed capacity (MW) 15,000
Cumulative invest. up to 2020 (€ billion) 176.1 Employement (1,000 job-year) 222
Annual installed capacity (MW) 30,000
Employement (1,000 job-year) 444
LATIN AMERICA
12% wind power in 2020 (GW) 100
12% electricity production from wind power 2020 (TW/h) 245.2
Annual reduction of C02 in 2020 (billion tonnes) 147.1
Cumulative invest. up to 2020 (€ billion) 61.4
Annual installed capacity (MW) 17,000
Employement (1,000 job-year) 251.8
AFRICA
12% wind power in 2020 (GW) 25
12% electricity production from wind power 2020 (TW/h) 61.3
Annual reduction of C02 in 2020 (billion tonnes) 36.8
Cumulative invest. up to 2020 (€ billion) 15.4
Annual installed capacity (MW) 3,000
Employement (1,000 job-year) 44.4
DEFINITIONS OF REGIONS IN
ACCORDANCE WITH IEA CLASSIFICATION
OECD-Europe: The EU-15 plus Czech Republic, Hungary, Iceland, Norway, MIDDLE EAST
Switzerland and Turkey 12% wind power in 2020 (GW) 25
OECD N. America: USA and Canada 12% electricity production from wind power 2020 (TW/h) 61.3
OECD Pacific: Japan, Australia and New Zealand Annual reduction of C02 in 2020 (billion tonnes) 36.8
Transition Economies: Albania, Bulgaria, Romania, Slovak Republic, Former Cumulative invest. up to 2020 (€ billion) 14.0
Jugoslavia and Former Soviet Union and Poland Annual installed capacity (MW) 3,000
South Asia: India, Pakistan, Bangladesh Sri Lanka and Nepal Employement (1,000 job-year) 44.4
Latin America: All Central and South American countries and islands in the
Caribbean
East Asia: Brunei, Dem. Republic of Korea, Indonesia, Malaysia, Philippines,
Singapore, Rep. of Korea, Chinese Taipei, Thailand, Vietnam and some smaller
countries, including the Polynesian Islands
Africa: Most African countries in the North and the South
[24]
Middle East:
WINDBahrain,
FORCE 12Iran, Iraq,
REPORT Israel, Jordan, Kuwait, Lebanon, Oman, Qatar,
2005
Saudi Arabia, Syria, United Arab Emirates and YemenYou can also read