Transporting Melbourne's Recovery - Immediate policy actions to get Melbourne moving January 2021 - Infrastructure Victoria
←
→
Page content transcription
If your browser does not render page correctly, please read the page content below
Transporting
Melbourne’s
Recovery
Immediate policy actions to
get Melbourne moving

January 2021
Executive Summary

    The COVID-19 pandemic has impacted how Victorians make decisions for when, where and how they travel. Lockdown
    periods significantly reduced travel around metropolitan Melbourne and regional Victoria due to travel restrictions and
    work-from-home directives. As Victoria enters the recovery phase towards a COVID Normal, our research suggests that
    these travel patterns will shift again – bringing about new transport challenges.
    Prior to the pandemic, the transport network was struggling to meet demand with congested roads and crowded public
    transport services. The recovery phase adds additional complexity to managing the network, as the Victorian
    Government will need to balance competing objectives such as transmission risks, congestion and stimulating greater
    economic activity.
    Governments across the world are working rapidly to understand how to cater for the shifting transport demands of their
    cities – specifically, a disruption to entire transport systems that were not designed with such health and biosecurity
    challenges in mind.
    Infrastructure Victoria’s research is intended to assist the Victorian Government in making short-term policy decisions to
    balance the safety and performance of the transport system with economic recovery. The research is also designed to
    inform decision-making by industry and businesses as their workforces return to a COVID Normal. It focuses on how the
    transport network may handle returning demand and provides options to overcome the crowding and congestion effects,
    while also balancing the health risks posed by potential local transmission of the virus. Balancing these impacts is critical
    to fostering confidence in public transport travel, thereby underpinning and sustaining Melbourne’s economic recovery.
    The options outlined in this paper are designed for practical short-term implementation but also deliver ongoing benefits
    for government, industry and commuters including better use of infrastructure, and safer and more reliable journeys. The
    options are based on enhanced transport modelling, mobility data, case studies and evidence from cities throughout
    Australia and New Zealand.
    The options put forward look across all modes of transport including private, public and active transport (such as walking
    and cycling). These options do not treat these respective modes in isolation. Overcoming the challenges of a return to
    travel and guiding Victoria’s recovery means that policymakers must manage the constraints of the transport system
    through a wide lens to guard against unintended consequences. This means exploring options like workplace policies
    and safe public transport travel regulation, pricing mechanisms, greater collaboration between all levels of government
    and business, in addition to enhancing infrastructure service levels.
    We have taken a scenario modelling approach, looking at a range of potential transport outcomes under COVID Normal
    scenarios, as well as COVID Normal with Reform scenarios that include behaviour change which could be achieved with
    policy intervention. The COVID Normal scenarios outlined below are designed to simulate a period where there are
    limited cases of COVID-19 in the community. They are characterised by the lack of a vaccine, low community
    transmission of the virus and minimal government intervention.

     Category              Scenario name          Description

     Pre-COVID-19          Base                   The Base year, pre-COVID-19 – this used the latest 2018 validation of the
                                                  Melbourne Activity and Agent Based Model (MABM).

                           Core                   COVID-19 modelling run with ‘most expected’ adjustments to work from
                                                  home (WFH), car preference, domestic and international travel/students.
     COVID Normal
                           Dialled-Up             COVID-19 modelling run with even greater adjustments to WFH, car
                                                  preference, domestic and international travel/students.

                           Active Uptake          A forced shift of trips to/from/within Inner Metro region to active modes
                                                  (walking & cycling) – using Core scenario as the foundation scenario.
     COVID Normal
                           Flexible Work          Greater flexibility in work activity start times and a forced shift to even
     with Reform
                                                  greater WFH levels – using Core scenario as the foundation scenario. In
                                                  this scenario, the arrival window for commuters to begin work was
                                                  widened from 8am-10am to 7am-11am.

2
Our transport modelling is also highly dependent on the assumptions used to simulate the COVID Normal recovery
period scenarios. Based on level of severity, these assumptions include:

    •    Work from home levels of between 10% to 20%, resulting in commuter travel reduced to between 80% to
         90% of usual levels.
    •    A decrease in public transport mode share between 37% to 55% and a smaller increase in car mode share,
         based on changing user preferences.
    •    Reduced airport travel and international student population.

Results from the COVID Normal scenarios with minimal reform or government intervention depict a challenging recovery
period. Under these scenarios, the modelling represents a transport network dilemma. That is, a significant shift away
from public transport increases private vehicles on the road network and, without further policy intervention, the assumed
COVID Normal level of working from home is not enough to offset congestion impacts for Inner Metro (including
Melbourne City, Port Phillip City and Yarra City local government areas). Transport challenges largely emerge towards
the inner areas of Melbourne, where there is limited road and public transport capacity. For example, average road
speeds during the morning peak fall by up to 30% across Inner Metro under the COVID Normal scenario.
Despite working from home, falling public transport patronage and a shift to private vehicles causing the increase in
congestion for inner Melbourne, up to a quarter of morning peak train services experience high patronage, providing
limited opportunity to physically distance onboard services, with over two in five seats occupied. The result is that both
roads and public transport in inner Melbourne still experience high traffic and patronage volumes during the morning
peak. Shifting demand at peak times between the two is ineffective, as both options lead to undesirable road congestion
and health risk outcomes if public transport demand cannot be shifted to off-peak times when ample physical distancing
can be achieved. Large improvements in capacity are also very challenging to implement in the short-term. Our previous
recommendations to help alleviate this challenge were presented in Fair Move – Better Public Transport Fares for
Melbourne. This new research complements Fair Move, providing intervention options in addition to public transport fare
reform.
The options outlined in this report address how government can best enable a return to higher levels of economic activity
and productivity, while limiting road congestion and providing safer public transport services. The COVID Normal with
Reform scenarios are illustrative approaches to demonstrate potential improvements that the Victorian Government can
implement to address these challenges.
The changes we modelled in the COVID Normal with Reform scenarios were an increase in active transport use within
the inner city and greater levels of flexibility in when, and where, Victorians work.
The Active Uptake scenario demonstrated how an increased share of commuting cyclists and pedestrians could assist in
dampening the road and public transport congestion and physical distancing challenge by switching to active travel:
    •    Up to a 50% increase in active mode share for Inner Metro, shifting trips away from at-capacity roads and public
         transport.
The Flexible Work scenario established the peak spreading and network efficiency benefits from having commuters work
with more flexible start and end times, as well as additional increases in the proportion of the workforce continuing to
work from home:
    •    Further increases to working from home levels – up to 25%.
    •    Greater flexibility in work hours allowing workers to start work either earlier or later in the day. The original
         arrival window for commuters in MABM to begin work was widened from 8am-10am to 7am-11am.
These reform scenarios translate to increasingly favourable network performance and ample room for physical
distancing. For example, Flexible Work helps to reduce patronage on morning peak train services. This results in over
90% of morning peak train services operating with ample space for physical distancing by commuters, equivalent to
patronage levels of around two in five seats occupied. This density level on trains is largely consistent with current public
health advice of staying 1.5 metres away from others while travelling and in venues.
Our modelling has shown that greater levels of flexible work, consisting of levels of working from home of around 25%
and more flexible work times, result in congestion levels in Inner Metro close to pre-COVID-19 levels (a reduction of over
100,000 delay hours compared to COVID Normal), and much lower congestion across the rest of Melbourne. Our
modelling also shows that an increase of over 142,000 cycling trips each day to, from and within Inner Metro, when
combined with greater walking trips, results in a reduction of 40,000 delay hours for Inner Metro road congestion.
While the flexible work and active transport uptake scenarios each make a significant contribution to reducing road
congestion and public transport crowding, our modelling shows that if implemented alone they are unlikely to be
sufficient to address these challenges. The modelling we have conducted for the purposes of this research and Fair
Move demonstrates the individual effects of flexible work, active transport uptake and greater off-peak public transport

                                                                                                                                3
use. A combination of these interventions is likely to be necessary to manage congestion and enable physically
    distanced public transport use in the Inner Metro area.
    We know that achieving these behaviour changes (greater active transport, increased workplace flexibility and greater
    off-peak public transport use) will require policy and operational interventions. As such, we have identified a number of
    options for the Victorian Government to continue or consider implementing in the short-term, including:

     Category         Option                                             Purpose

                      Continue to monitor physical distancing levels     Directives such as mandatory wearing of masks and
                      of public transport and provide clear directives   capacity guidance on public transport can support
     Government       on mandatory use of masks, as well as              safer and more confident travel.
     directives       responses such as distinct signage for
     and guidance     physical distancing with increased staffing for
                      enforcement or assistance in managing
                      capacity limits to support safe travel.
                      Consider implementing permanent off-peak           Off-peak fares complement flexible work incentives
                      public transport fares across all modes.           and can incentivise commuters to travel during
                                                                         quieter times of the day.
                      Remove the Free Tram Zone (FTZ).                   This measure will reduce crowding and the
     Pricing                                                             associated health risks in inner Melbourne while also
     mechanisms                                                          encouraging the uptake of active transport options,
                                                                         particularly walking.
                      Develop incentive schemes to encourage             Greater uptake of active transport takes pressure off
                      greater uptake of active transport to work.        roads and public transport, improving congestion,
                                                                         reducing pollution and lowering health risks.
                      Monitor crowding and patronage levels of new       Increasing capacity through running additional
                      off-peak public transport service                  services using the excess capacity of the system in
                      improvements – revising scheduling to best         off-peak times (underutilised infrastructure and
                      support peak spreading.                            rolling stock), increasing capacity on the network for
                                                                         flexible work and greater physical distancing.
                    Larger, more permanent separated cycling             Safer cycling infrastructure supports greater uptake
                    corridor upgrades should be delivered                of active transport, taking pressure off roads and
                    wherever possible and they can be                    promoting sustained behaviour changes, particularly
     Infrastructure complemented by pop-up bike lanes.                   in inner Melbourne.
     provision
                    Support local government to re-allocate              Active transport has the capacity to take the
                    parking and road space for pedestrians and           pressure off roads and incentivise sustained mode
                    economic activity.                                   shift, particularly in inner Melbourne.
                                                                         City of Melbourne commissioned research also
                                                                         shows increasing walking connectivity by just 10%
                                                                         would increase the value of the city centre economy
                                                                         by $2.1 billion a year, given the face-to-face
                                                                         connections fundamental to the retail and knowledge
                                                                         economies.
     Government       In addition to continued regulation to ensure      While private incentives for working from home exist,
     collaboration    workplaces remain safe, provide government         government can encourage higher rates by
     and              leadership and nudges towards greater              highlighting employers’ Occupational Health and
     leadership in    flexible work through processes, public            Safety (OHS) responsibilities plus reduced
     flexible work    campaigns, collaboration with industry and the     transmission risk and the wider social benefits of
                      use of the VPS as an example of best               working from home. Government should also
                      practice.                                          collaborate with employer peak bodies, industry and
                                                                         unions to promote flexible work hours and other
                                                                         flexibility practices using the public service as an
                                                                         example.
                                                                         Working from home (for those who can) and flexible
                                                                         work hours can benefit employers and employees,
                                                                         and also have a dramatic impact on managing
                                                                         demand across all aspects of the transport network.

4
Encouraging these behaviour changes should begin immediately to build upon the changes already being observed. The
COVID-19 pandemic has brought about significant transport disruption. Government should use this time to recalibrate
the transport network in Victoria and avoid locking in inefficient and high-risk travel behaviours that create congestion
and crowding, and risk public health. Proactive intervention will ensure that Melbourne recovers with improved, safer and
more efficient travel behaviours, which will support and sustain economic recovery and benefit all Victorians.

                                                                                                                            5
Table of Contents

    Executive Summary ......................................................................................................................................................... 2
    Introduction ...................................................................................................................................................................... 7
    1.        Introduction ........................................................................................................................................................... 8
              COVID-19 Research Program ................................................................................................................................ 8
                            Context ..................................................................................................................................................... 8
                            Timeframe and Objectives ........................................................................................................................ 8
                            Methodology ............................................................................................................................................. 9
    If we don’t make a change ............................................................................................................................................. 10
    2.        If we don’t make a change ................................................................................................................................. 11
              Modelling a COVID Normal Melbourne ................................................................................................................. 11
                            Introduction to the transport model ......................................................................................................... 11
                            Research summary and assumptions ..................................................................................................... 11
              Modelling transport and COVID-19 ....................................................................................................................... 20
                            Summary of adjustments and MABM runs .............................................................................................. 20
                            Results from MABM pandemic scenarios – problem definition ............................................................... 20
    Improving transport in the COVID Normal ................................................................................................................... 31
    3.        Reform with COVID-19 ........................................................................................................................................ 32
              The policy dilemma ............................................................................................................................................... 32
              More flexible work ................................................................................................................................................. 32
              3.2.1         Greater levels of working from home ...................................................................................................... 32
              3.2.2         Greater flexibility in working hours .......................................................................................................... 34
              Greater active transport ........................................................................................................................................ 35
              What we modelled ................................................................................................................................................ 35
                            More flexible work ................................................................................................................................... 35
                            Active transport uptake ........................................................................................................................... 36
                            Modelling change summary .................................................................................................................... 36
              The impact of change – modelling results ............................................................................................................. 38
              Policy options ........................................................................................................................................................ 47
                            Regulation ............................................................................................................................................... 48
                            Pricing mechanisms ................................................................................................................................ 49
                            Transport infrastructure improvements ................................................................................................... 52
                            Government collaboration and leadership .............................................................................................. 57
    Victoria beyond recovery .............................................................................................................................................. 59
    4.        Victoria beyond recovery ................................................................................................................................... 60
              Looking beyond recovery ...................................................................................................................................... 60
    Appendix ......................................................................................................................................................................... 61
    About us.......................................................................................................................................................................... 62

6
Introduction
Infrastructure Victoria’s research program into the transport impact of
COVID-19

                                                                          7
1. Introduction

    Our COVID-19 research program seeks to solve the diverse transport and economic challenges brought about
    by the pandemic. This report focuses on immediate intervention options to respond to emerging transport
    challenges as Greater Melbourne emerges from strict lockdowns into a COVID Normal recovery phase. It is a
    period still awaiting a vaccine but with minimal community transmission of the virus as Victorians embrace the
    easing of restrictions.

                  COVID-19 Research Program
                  Context
    Infrastructure Victoria initiated an extensive modelling program to understand the behaviour changes and key disruptions
    to industries caused by the COVID-19 pandemic. This report forms the first component of our research, examining the
    short-term impact of behavioural changes from the pandemic, specifically on Melbourne’s transport network. It explores
    scenarios of how we expect travel demand to shift across the network in the short term, as well as policy ideas and
    reform opportunities that will assist Melburnians to move around safely and efficiently, facilitating the state’s economic
    recovery.
    Infrastructure Victoria’s research is intended to assist the Victorian Government in making short-term policy decisions to
    balance the safety and performance of the transport system with economic recovery. It focuses on how the transport
    network may handle returning demand and provides options to overcome the crowding and congestion effects, while
    also balancing the health risks associated with local transmission of the virus. Balancing these impacts is critical to
    fostering confidence in public transport travel, thereby underpinning and sustaining Melbourne’s economic recovery.
    Future components of this modelling program will focus on medium and long-term transport, land use and infrastructure
    impacts caused by COVID-19 and will be made available in 2021.

                  Timeframe and Objectives
    While Victoria’s experience of lockdowns and work-from-home directives reflected the immediate policy response to the
    pandemic, this research focuses on the subsequent recovery period. Acknowledging Victoria’s success in overcoming
    the second wave in October and the subsequent easing of restrictions, the Victorian Government has clearly signalled it
    intends to carefully manage the recovery to minimise transmission risks. Our short-term impacts research has been
    designed to inform these recovery efforts over the next 12 to 18 months.
    The COVID Normal recovery period is defined as a situation where Victorians are living with limited cases of COVID-19
    within the community. It is characterised by the lack of a vaccine and low community transmission. Old freedoms have
    returned with eased restrictions and many Victorians are able to return to their workplaces. It is a period in which
    Infrastructure Victoria expects uncertainty to remain, but with fewer health risks to Victorians’ everyday lives, enabling
    greater freedom of movement in how we work, travel and socialise.
    Our research focuses on the following objectives:
            1.    Safe travel – policies to minimise the health risk from COVID-19 for Victorians using the transport network,
                  especially on shared modes like public transport.
            2.    Congestion and crowding – policies to manage increased congestion on roads and to limit crowding on public
                  transport, as travel demand returns in the recovery phase.
            3.    Long-term benefit – policies to promote efficient travel behaviours, supporting a more balanced transport
                  network during the recovery and beyond. 1

    1
        Infrastructure Victoria’s research on transport pricing policy found in Fair Move: Better Public Transport Fares for Melbourne and Good Move:
            Fixing Transport Congestion provides an extensive list of transport reform recommendations, covering short, medium and long-term time
            periods.

8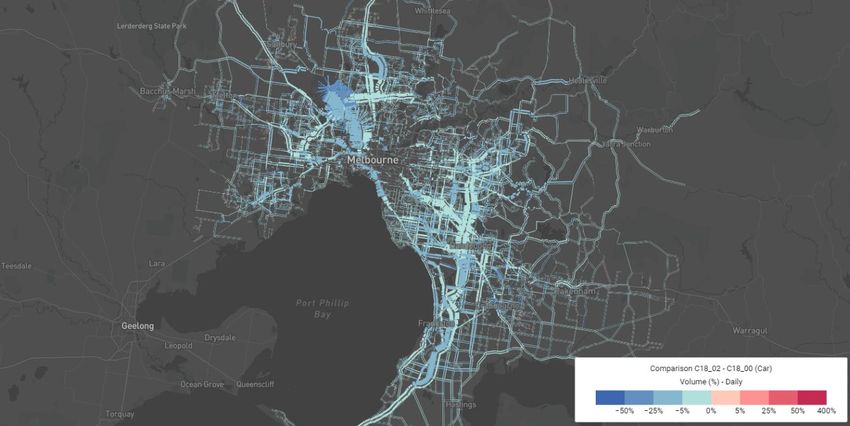
Infrastructure Victoria’s approach to developing policy options aims to meet each of these three objectives. We examined
all modes, times and locations across Greater Melbourne to fully understand how best to balance getting Melburnians
and visitors back onto the transport network while ensuring safe travel.

         Methodology
Our work explores transport challenges in the COVID Normal era, complementary policy options and the benefits to
Greater Melbourne. To assess the transport network under a COVID Normal scenario, our approach utilised transport
modelling to simulate expected travel behaviours in Victoria’s recovery phase, based on COVID-19 impacts research
and how other cities have rebounded in their recovery periods. The results from the modelling were then analysed and
some COVID Normal alternative scenarios were developed, demonstrating the benefits of potential alternate paths the
Victorian Government could take to manage demand and support beneficial behaviour change.

                                                                                                                           9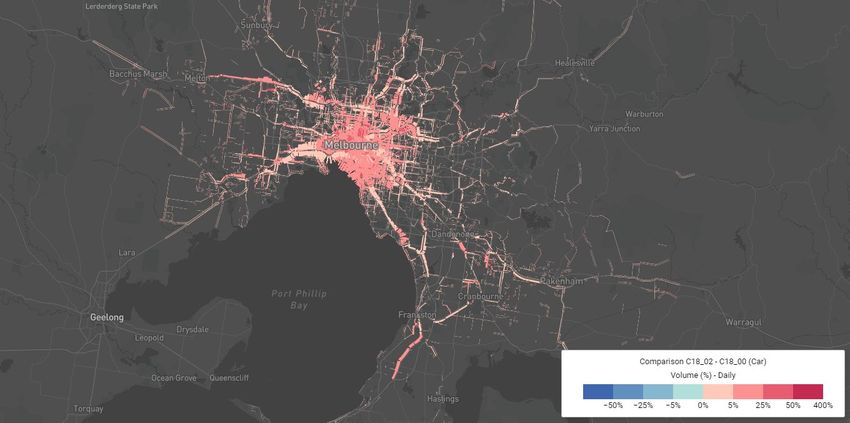
If we don’t make a
     change
     COVID-19 impacts research and insights from our transport modelling

10
2. If we don’t make a change
To determine reform opportunities, we need to account for the significant travel behaviour shifts brought about
by the pandemic and accurately simulate a shift to COVID Normal. Between 10% to 20% of the workforce
continues to work from home while public sentiment shifts away from public transport and a strong preference
for private vehicles is emerging.
Modelling a COVID Normal Melbourne
Introduction to the transport model
Transport modelling can demonstrate the benefits and implications of policy and infrastructure changes to the transport
network. One of the models we use at Infrastructure Victoria is the Melbourne Activity and Agent Based Model (MABM).
Our previous work using the MABM has involved scenarios for autonomous and zero emissions vehicles, road and
parking pricing and public transport fares reform.
Infrastructure Victoria ran modelling of previous scenarios and policy interventions using travel demands across Greater
Melbourne from the pre-pandemic era. COVID-19 and related government interventions (like the risk of virus
transmission on public transport or work-from-home directives) have had a large impact on demands. To analyse the
impacts of COVID-19 and the reform options to manage Victoria’s recovery phase, we recalibrated the model to better
reflect a world disrupted by the pandemic. Recalibration of the model was applied to a 2018 base year of the MABM. 2
We worked with Veitch Lister Consulting (VLC) to develop a list of potential disruptions and adjustments to the MABM to
best represent the changing COVID-19 context. As discussed in Section 1.1.2 of this report, our target was to model
Melbourne’s recovery phase over the next 12 to 18 months – the transition into COVID Normal.
We developed two scenarios with different levels of change severity: a COVID-19 Core scenario and a Dialled-Up
scenario. The Core scenario forms the most accurate representation of Melbourne’s recovery we could predict, while the
Dialled-Up scenario represents larger travel behaviour change and economic disruption. The two scenarios assist in
understanding the range of potential future outcomes. Our analysis compares both Core and Dialled-Up scenarios with
the 2018 base year, known as the Base scenario.
Research summary and assumptions
Both qualitative and quantitative data sources were reviewed to define the Core and Dialled-Up scenarios. Sources
included Apple and Google mobility data, transport department patronage figures, Victorian Integrated Survey of Travel
and Activity (VISTA) survey results and Australian Bureau of Statistics (ABS) figures, alongside various reports from
organisations and academics. To make plausible assumptions about what Melbourne’s recovery could look like,
Infrastructure Victoria analysed trends from other cities around Australia and New Zealand at varying stages of lockdown
and recovery. Conclusions were drawn based on pre-lockdown baseline levels, the initial shock of COVID-19 lockdowns
and trends from eased restrictions. Recovery trends in some cities where restrictions had been rolled back significantly
were also analysed. At the time of our research, Perth, Brisbane and Auckland could be considered as being in recovery
phases. Cities like Sydney, where the first wave of COVID-19 was flattened and restrictions eased, were also useful
when attempting to make predictions about Melbourne’s recovery.
The research looked at the following areas:
increase in working from home
changing preferences for travel by car, public transport and active transport (walking and cycling)
limited airport travel and international student levels
fuel prices, income levels and commercial vehicle traffic.
2
At the time of modelling, a draft 2018 base year of the MABM was the most suitable and up-to-date version of the model to select from. Other
alternatives include a previous 2016 base year, or 2031 base year. The draft 2018 base year updated (where possible): network links,
transit schedule and capacities and improved accuracy of the synthetic population.
11Many figures showing timelines in the following sections use 14 March 2020 as a baseline reading. This is consistent
with the approach of the ABS 3 and allowed our consultants, VLC, to construct seven-day moving averages for each
research area.
Details of each adjustment are below. Alternatively, the full research log can be found in the supporting VLC COVID
Modelling for Infrastructure Victoria slide deck.
Employment adjustments – working from home
Working from home (WFH) represents one of the largest impacts for transport demand. This was reflected in
adjustments we applied to the 2018 Base scenario. Significantly, it not only has an impact on working households’ travel
to and from work, but also smaller occasional trips for shopping, school pickup or recreational and social activities that
are often tied to a work commute.
By using Google location data from both private residences and workplaces, 4 working from home appears to have
persisted even after restrictions and lockdowns were eased. This is evidenced in Auckland, Perth and Brisbane where
levels of residential activity continue to trend around 5% above baseline levels. This pattern is shown in Figure 1. Note
the large adjustment in Auckland activity from March through to May due to stricter lockdowns in New Zealand.
Lockdowns led to large increases in residential activity
Workplace activity % (14 March=100)
Figure 1. Google location data from residences (14 March = baseline, seven-day moving average) – VLC analysis
Lockdowns led to large declines in workplace activity
Workplace activity % (14 March=100)
Figure 2. Google location data from workplaces (14 March = baseline, seven-day moving average) – VLC analysis
3
For example, see ABS Weekly Payroll Jobs and Wages in Australia: https://www.abs.gov.au/statistics/labour/earnings-and-work-
hours/weekly-payroll-jobs-and-wages-australia/latest-release. 14 March 2020 also falls prior to many COVID-19 restrictions coming into
force in Australia.
4
Google provides Community Mobility Reports aimed to provide insights into the shifts from COVID-19 across spatial and temporal categories:
https://www.google.com/covid19/mobility/
12With adjustment to account for external factors like school holidays and their impacts on private residences and
workplaces, Google data suggests that workplace activity is likely to recover to between 80% to 90% of pre-COVID-19
levels in the recovery phase. 5 It also demonstrates how activity in Victoria’s workplaces fell to almost 40% of baseline
levels during the first full lockdown, before rebounding up close to 80% of baseline levels post-lockdown (prior to the
second wave).
Workplace activity is likely to recover between 80% to 90% of
pre-COVID-19 levels
Workplace/residential activity % (14 March=100)
Figure 3. Google data – Workplace and residential location data across the COVID-19 time period as a percentage of
pre-lockdown, VLC analysis
While the data demonstrates working from home levels reflect health directives enforced by various governments, there
is also a growing number of workers who are choosing to continue to work from home, even as post-lockdown
restrictions ease (see Auckland and Perth as examples). Based on the experiences in other cities, we modelled
workplace activity recovering between 80% to 90% of usual levels in Melbourne (or alternatively, a 10% to 20% reduction
in commuter travel). 6
As the MABM covers the Greater Melbourne spatial region, analysis was required to determine which individuals – and
subsequently, which locations – were impacted by the working from home adjustments. Firstly, to ensure that working
from home adjustments reflected the appropriate occupations, Dingel and Neiman’s occupation research in the U.S.
assisted in filtering which occupations could work from home, removing those occupations that couldn’t from the
analysis. 7 Survey data from the Department of Jobs, Precincts and Regions (DJPR) was used to determine the
difference between pre and post-COVID-19 working from home levels relevant to each occupation. 8 To make up a 10%
to 20% reduction in commuter travel as noted earlier, the DJPR survey then assisted in determining the proportion of
each occupation to work from home to achieve this reduction target.
As every agent in the MABM population has attributes like occupation and household location, 9 we were able to identify
the location of workplaces that would be most likely to retain working from home arrangements post-lockdown. The
reduction in trips in both scenarios is shown in Table 1 and the destination of trips that were subsequently removed from
the model is shown in Figure 4. This shows that a large proportion of trips removed from the network (as a direct result of
higher levels of employees working from home) are trips to the Melbourne central city. The other peak represents trips to
Melbourne Airport and will be discussed in a following subsection.
5
See VLC COVID Modelling for Infrastructure Victoria – slide 31 for detailed information.
6
These estimates also follow research observations presented by Currie and Hensher in AITPM Webinar: Travel Post COVID-19.
https://www.aitpm.com.au/events/past-events/travel-post-covid-19-alternative-views-from-leading-academics-october-2020
7
Dingel and Neiman (2020), How many Jobs can be Done at Home? https://bfi.uchicago.edu/wp-content/uploads/BFI_White-
Paper_Dingel_Neiman_3.2020.pdf
8
See VLC COVID Modelling for Infrastructure Victoria for detail on how the DJPR survey was incorporated in the analysis.
9
See KPMG Arup Model Calibration and Validation Report for further detail on the population synthesis process.
https://www.infrastructurevictoria.com.au/wp-content/uploads/2019/04/KPMG-MABM-Validation-Report-December-2017.pdf
13Table 1. MABM – Working from home trip adjustments
Core scenario Dialled-Up scenario
Working from home (WFH) trip Commuter travel reduced to 90% Commuter travel reduced to 80%
adjustment of usual levels (i.e. 10% WFH) of usual levels (i.e. 20% WFH)
Melbourne Airport
(Tullamarine)
Melbourne CBD
Figure 4. MABM – Removed trips by destination, VLC analysis
Changing preferences for transport modes
While restrictions have had a general dampening effect on the volumes of people travelling on Victoria’s transport
network, there has also been a change in the preferences of commuters when it comes to choosing between public
transport, private vehicles, active modes and other shared forms of mobility.
Infrastructure Victoria observed how COVID-19 affected the demand for public transport and roads in major cities by
using publicly available mobility data from Google and Apple, as well as VLC’s mobility data 10 for public transport. In the
comparison of cities and public transport data, found in Figure 5, cities with very low levels of COVID-19 cases (or none
at all) like Auckland, Perth and Brisbane still experience a plateauing of public transport patronage well under baseline
levels. Most of these cities ultimately reach within 70% of baseline public transport levels. Notably, Melbourne also saw a
similar initial plateaued recovery in public transport patronage before dropping again, coinciding with Victoria’s second
COVID-19 wave and associated lockdowns. This suggests that even as Melbourne enters a COVID Normal era, public
transport patronage will not return to pre-pandemic levels in the short term.
In comparison, the use of private vehicles also dropped sharply during initial lockdown periods, however usage recovers
strongly in many cities during their recovery period (Figure 6). This indicates a higher preference for private vehicles in a
COVID Normal world. The strong preference for private vehicle travel should not only be attributed to those that once
10
VLC’s COVID-19 Mobility Trends Dashboard provides indexed numbers of mobile devices across average weekday for varying categories.
See: https://explore.veitchlister.com.au/covid-19-dashboard/
14drove returning to their commutes. Rather, it may also be a combination of both returning drivers and travellers who
previously used other modes, such as public transport. 11
Public transport experiences large patronage declines and
fails to fully recover
Public transport volumes % (14 March=100)
Figure 5. Apple transit data – Impacts of COVID-19 on public transport volumes – city comparison (14 March = baseline,
seven-day moving average), VLC analysis
Driving is more resilient compared to public transport, fully
recovering in many cities to pre-COVID-19 levels
Car volumes % (14 March=100)
Figure 6. Apple transit data – Impacts of COVID-19 on car volumes – city comparison (14 March = baseline, seven-day
moving average), VLC analysis
11
See VLC COVID Modelling for Infrastructure Victoria for details of analysis from COVID-19 VISTA July survey (Department of Transport 2020)
15Perth’s transport rebound
In a recent analysis by Perth-based motoring organisation and insurance company RAC, traffic volumes on Perth’s
main roads in November 2020 were up to 18% higher than pre-pandemic levels. 12 Comparing this with Infrastructure
Australia’s (pre-COVID-19) expected traffic increase of 32% by 2031 in the 2019 Australian Infrastructure Audit
suggests that over half of the projected traffic growth occurred in 2020 alone. 13
Given Perth’s success in largely suppressing the COVID-19 pandemic, Perth’s Public Transport Authority states that
patronage has hovered around 70% of pre-COVID levels, climbing to around 78% in October. 14
To support the rebound, the RAC continues to advocate improved efficiency and accessibility across public transport
services. Incentives include bus priorities, off-peak public transport fare discounts as well as investment in active
transport alternatives such as walking and cycling.
Active transport was also analysed to determine the impact of COVID-19 on active transport mode share. Compared with
2018 VISTA, the COVID-19 VISTA survey (Department of Transport 2020) 15 indicated the number of recreational and
shopping trips by active mode increased, while work trips by active mode and public transport fell.
Table 2 also shows that for most jurisdictions, the share of active travel has fallen from pre-lockdown levels throughout
various lockdown periods of the pandemic (see following paragraph for explanation of Table 2). Therefore, many
increases seen in active travel are largely due to recreational and shopping activities. For our modelling, we have
assumed no change in active trips. Much of the congestion and crowding in the MABM are as a result of work trips
during the AM and PM peaks, as opposed to recreational and social active trips which are taken outside the peaks.
There is also a technical challenge here where trips generally cannot adjust to active modes in the current version of the
MABM, compared to the allowed substitution between car and public transport. This means that the mode share of active
trips is largely fixed within the model.
Table 2 shows the mode share across cities, across lockdown time periods. This was derived using the starting mode
share from household travel surveys for each city, and then adjusting based on growth or decline as observed from
Apple mobility data for the subsequent phases. Table 3 then compares how mode share for car and public transport (PT)
from Table 2 varies between time periods.
Table 2. Implied mode share across cities and time period, VLC analysis
Pre-lockdown Full lockdown Easing lockdown Recovery
Car PT Active Car PT Active Car PT Active Car PT Active
Melbourne 72% 10% 18% 81% 4% 15% 81% 5% 13% - - -
Sydney 70% 12% 18% 79% 6% 15% 79% 8% 14% - - -
Brisbane 83% 6% 10% 89% 3% 8% 88% 4% 8% 88% 4% 8%
Auckland 63% 9% 28% 58% 5% 37% 69% 6% 25% 69% 6% 24%
Table 3. Change in mode share across cities and time period, VLC analysis
Change in car Change in PT Comparison
Melbourne +13% -50% Easing vs. Pre-lockdown
Sydney +13% -33% Easing vs. Pre-lockdown
Brisbane +6% -33% Recovery vs. Pre-lockdown
Auckland +10% -33% Recovery vs. Pre-lockdown
12
RAC media release: https://rac.com.au/about-rac/media/media-releases/november-2020/perth-traffic-growing-12-times-faster-than-forecast
13
Infrastructure Australia, Perth travel estimates: https://www.infrastructureaustralia.gov.au/sites/default/files/2019-
08/Urban%20Transport%20Crowding%20and%20Congestion%20-%208.%20Greater%20Perth.pdf
14
Perth Public Transport Authority media release: https://www.pta.wa.gov.au/news/media-statements/wa-public-transport-patronage-bouncing-
back-from-covid-19
15
COVID-19 VISTA is different to normal VISTA data. The survey was altered in May 2020 due to COVID-19 travel restrictions and could no
longer be administered through direct contact with households. Survey participants were recruited directly via CATI and social media,
rather than from an established sample frame. Statistics are based on adjustments at the person level to the reflect age group and gender
distributions for Melbourne SA4s rather than the normal weighted process.
16Table 4 summarises the changes in mode attractiveness for private vehicle, public transport and active modes that we
targeted in the MABM. Overall, public transport is estimated to remain at depressed levels for some time, as
experienced in cities like Brisbane, Perth and Auckland. Private vehicle travel is also estimated to be more attractive to
travellers than prior to the pandemic, largely due to commuter’s apparent concerns with public transport. The Core
scenario is based on the observed trends from Auckland with an increase of 10% in car mode share and a decrease of
33% in public transport mode share (Brisbane is also similar). The Dialled-Up scenario exacerbates these shifts, using
values similar to Melbourne as restrictions eased following Stage 1 restrictions: an increase of around 15% in car mode
share (similar to Sydney) and a decrease of 50% in public transport mode share. As all mode shares are dependent on
each other, public transport mode share was the primary adjustment with the resultant car mode share also shown in the
table below. These percentage changes in mode share are targets – the actual changes in mode share represented in
the MABM will vary based on Melbourne’s specific mode split between car, public transport and active modes.
Table 4. MABM – targeted changes to mode attractiveness
Mode Core scenario Dialled-Up scenario
Car 10% increase 15% increase
Percentage targeted
change in mode Public transport 30% decrease 50% decrease
share
Active modes (walking & cycling) No change No change
Airport travel and international students
COVID-19 has also impacted international and domestic travel markets (and subsequent travel within Greater Melbourne
associated with airport trips). These changes for airport and regional/interstate travel were also reflected in MABM.
The substantial impact of lockdowns and border closures was experienced around April and May with monthly total
airport passengers at less than 10% of baseline levels for all Australian cities. VLC’s location-based services data also
confirms this, showing that from mid-March airport travel in Australian cities declined by more than 80% (Figure 7). Even
Brisbane, with little-to-no active COVID-19 cases and a relaxation of restrictions, has still only returned to around 30% of
pre-COVID-19 airport travel levels. Part of this is explained by Brisbane residents still having few available destinations
to travel to, considering international travel bans, lockdowns in other states, border restrictions and quarantine
requirements. Looking across the Tasman Sea to Auckland, more airport travel suggests conditions are on track to
improve, driven almost entirely by the New Zealand domestic market, as seen in Figure 8.
Airport passenger volumes % (14 March=100)
During the week of March 14, airport travel declines by over 80%
Figure 7. Airport passenger volumes (March 14 = baseline, seven-day moving average), VLC analysis
17BITRE places monthly total airport passengers at less than
Airport passenger volumes % (14 March=100)
10% during May for all major Australian cities
Figure 8. Bureau of Infrastructure and Transport Research Economics (BITRE) Total airport passenger volumes – city
comparison (March 14 = baseline, seven-day moving average), VLC analysis
International student numbers in Melbourne are also highly dependent on international travel. Border restrictions like
caps on international arrivals have impacted the international student market. Approvals of international student visas
have declined nationally by around 20% 16 (comparing FY18-19 with FY19-20) and Victoria’s enrolments have declined
19% relative to 2019 levels. 17 A report by the Mitchell Institute at Victoria University highlights an even more dramatic
picture, stating that in April 2020, just 30 international students arrived or returned to Australia, compared to over 46,000
in April 2019. 18 To reflect these reductions in international students we used data from the Mitchell Institute report to
identify the areas most affected by a reduction in international student volumes, before removing a certain percentage of
individuals representing international students.
Table 5 shows a summary of how we adjusted individuals and trips within the MABM to reflect the impacts of COVID-19
on airport travel and international student levels in Victoria’s recovery. The Core scenario reflects an optimistic return to
domestic travel, predicting a rebound back to 50% of baseline airport travel levels. The Dialled-Up scenario represents a
slower recovery, rebounding to 30% of baseline levels, similar to what Auckland is currently experiencing.
In the absence of further information, and while highly uncertain (and dependent on various government approvals), 19 a
best-case return for international students represented a 20% reduction in the recovery for the Core scenario, compared
to a larger, more pessimistic 60% reduction in the Dialled-Up scenario.
Table 5. MABM – targeted changes to airport travel and international student levels
Core scenario Dialled-Up scenario
Airport travel 50% decrease in passenger 70% decrease in passenger
volumes volumes
International students 20% reduction in student levels 60% reduction in student levels
Other considerations – with no short-term adjustment
As part of the short-term impact analysis, other areas to explore that could be adjusted in the MABM include fuel prices,
agent income (and in turn, people’s willingness to pay for travel) and freight vehicle volumes. These, however, were
proven to either remain relatively stable according to data from Melbourne and other cities, or lacked sufficient evidence
to suggest any adjustment was required, according to VLC analysis.
While COVID-19 caused an initial drop in travel demand and fuel use, fuel prices have remained relatively steady
between BITRE low and medium fuel cost estimates. 20 Therefore, no change to fuel costs was implemented.
For adjustments to agent income, ABS employment and wage data shows changes to be less than 10%, while data by
industry shows large fluctuations. 21 Any change to agent income could also overlap with agent travel choices as their
willingness to pay for travel could change, resulting in unintended additional shifts in mode preference within the MABM.
16
https://www.homeaffairs.gov.au/research-and-statistics/statistics/visa-statistics/study
17
https://internationaleducation.gov.au/research/International-Student-Data/Pages/InternationalStudentData2020.aspx
18
https://www.vu.edu.au/sites/default/files/issues-brief-international-students-covid.pdf
19
https://www.sbs.com.au/language/english/update-south-australia-ready-to-welcome-international-students-as-soon-as-pilot-plan-gets-pm-s-
approval
20
See https://www.bitre.gov.au/publications/2019/prices-for-petrol-and-gasoline-modelling-a-global-phenomenon and
https://www.aip.com.au/pricing/ULP/VIC/melbourne
21
See ABS employment and wage data: ABS 6160.0.55.001, Weekly Payroll Jobs and Wages in Australia, Week ending 11 July 2020,
https://www.abs.gov.au/statistics/labour/earnings-and-work-hours/weekly-payroll-jobs-and-wages-australia/latest-release
18For example, an agent who originally took public transport to work may now find driving a more attractive option for their
commute, despite higher costs. As with fuel, not enough evidence was found to support a change in income for
individuals within the MABM.
Finally, although general sentiment appears to suggest that increased reliance on online shopping and delivery is likely
to have resulted in an increase in commercial freight, 22 the little publicly available local data on commercial traffic
remains inconclusive. Transurban’s recent industry report, Urban Mobility Trends from COVID-19 shows an initial spike
of large vehicle traffic volumes on toll roads mid-April 2020, returning to steady levels through May 2020 onwards.
Therefore, no changes to freight volumes were applied in the model. 23 In the meantime, as the logistics and freight
industries manage their own specific COVID-19 challenges, any mechanisms and policy options to support improved
traffic flow will also have direct benefits to delivery operators who share the roads.
22
https://theconversation.com/more-online-shopping-means-more-delivery-trucks-are-cities-ready-67686
23
This assumption may also change in Infrastructure Victoria’s medium to long-term COVID-19 modelling projects, based on emerging trends
of the freight and logistics industries.
19The COVID Normal transport modelling scenarios represent the problem definition and the target of future policy
intervention. Changing travel preferences cause large congestion problems on roads in inner Melbourne while
some public transport services provide limited opportunity to physically distance, despite reduced total trip
numbers influenced by working from home.
Modelling transport and COVID-19
Summary of adjustments and MABM runs
Once all adjustments, summarised below in Table 6, were applied to the MABM, the new Core and Dialled-up scenarios
designed to represent Victoria’s recovery phase were modelled. Unlike traditional transport models that measure ‘trips’
across the day, the unit of analysis for the MABM was actual modelled individuals. As the model simulates travel across
Greater Melbourne, it considers the characteristics and behaviours of individuals and how their travel may change, now
bound by the additional COVID-19 recovery parameters.
Table 6. MABM – summary of COVID-19 scenarios, compared with the Base scenario
Core scenario Dialled-up scenario
Private vehicle (change in mode share) 5% increase (10% target) 7% increase (15% target)
Public transport (change in mode share) 37% decrease (30% target) 55% decrease (50% target)
Working from home adjustment Commuter travel reduced to 90% Commuter travel reduced to 80% of
of usual levels (i.e. 10% WFH) usual levels (i.e. 20% WFH)
Airport travel 50% decrease in passenger 70% decrease in passenger
volumes volumes
International students 20% reduction in student levels 60% reduction in student levels
Results from MABM pandemic scenarios – problem definition
The Core and Dialled-Up scenarios present a diverse range of transport network safety, congestion and crowding
challenges. The problem is also spatially diverse across Greater Melbourne and varies depending on the time of day.
The following analysis draws comparisons between the Core and Dialled-Up (COVID-19) scenarios and the Base (pre-
COVID-19) scenario.
All figures from Figure 9 to Figure 26 are output results from the MABM.
Modelling general travel patterns before and after the pandemic
Prior to the pandemic, Melburnians used private vehicles as the main mode of transport with remaining trips balanced
between active and public transport modes, as shown in Figure 9. The Base scenario is displayed as the inner ring within
Figure 9. This reliance on private vehicles is skewed even further in the COVID-19 Core and Dialled-up scenarios
(middle and outer rings, respectively) where preference for private vehicles is increased (caused by individuals shifting
away from public transport), and is also influenced by the general decrease in overall trip numbers as a result of working
from home and reduced airport and international student levels.
The net result of all the Core and Dialled-Up scenario adjustments applied to the MABM can be found in Figure 10. For
the Core scenario, it shows an expected drop in public transport trips (influenced by changing user preferences),
however, a comparatively smaller increase in car trips.
There are two competing factors that lead to a low net change for car trips: (1) a change in preference causes an initial
drop in public transport trips and increase in car trips 24 and (2) an overall decrease in trips covering all transport modes
as a result of working from home 25 and reduced airport/international student travel. Figure 10 shows the combined result
of these adjustments in the middle (Core scenario) and outer (Dialled-Up scenario) rings.
In the Core scenario, the working from home adjustment has reduced the original number of car trips across the network.
However, due to changing preferences, many people have shifted from public transport to cars (over 81,000 people)
which offset the original working from home decrease, causing an overall increase in car trips.
25
By applying WFH adjustments, we reduced work and business trips by around 240,000 in the Core scenario and 485,000 in the Dialled-up
scenario.
20Car is the dominant mode of transport across Greater
Melbourne both pre and post-COVID-19
Public Transport 5% 16%
6% 16%
Active modes
10% 15%
Active modes
Car
Public transport
74%
Inner ring: Base
Middle ring: Core
Outer ring: Dialled-up Car
80% 78%
Figure 9. Mode share in Greater Melbourne for each scenario
Public transport demand is impacted the most in both COVID-19 scenarios
(compared to Base)
200,000
+ 81,008
-
-37,180 -17,100
-200,000 -97,164
Change in trips
-400,000
-600,000
-575,019
-800,000
-851,896
-1,000,000
Active modes Public transport Car
Change to Core Change to Dialled-up
Figure 10. Changes in trips across Greater Melbourne from Base year to COVID-19 scenarios
From a health and traveller safety perspective, a decrease in public transport usage is welcome – the fewer users on
crowded public transport services (mostly during peak times), the lower the risk to public health. For cars, however,
despite the lower virus transmission risk of individuals travelling in their own vehicles, this change in travel behaviour and
increase in trips causes a rather large congestion problem with its own public health implications such as air pollution
and inactivity. How these additional car trips are distributed across Greater Melbourne results in an even larger problem,
as the following section explains.
21You can also read