Global Estimates of Child Labour - RESULTS AND TRENDS, 2012-2016 - ILO
←
→
Page content transcription
If your browser does not render page correctly, please read the page content below
Global Estimates
of Child Labour

RESULTS AND TRENDS, 2012-2016

Global estimates of
child labour:
Results and trends,
2012-2016

GENEVA, 2017
Copyright © International Labour Organization 2017

First published 2017

This is an open access work distributed under the Creative Commons Attribution 3.0 IGO License (http://
creativecommons.org/licenses/by/3.0/igo). Users can reuse, share, adapt and build upon the original work,
even for commercial purposes, as detailed in the License. The International Labour Office (ILO) must be clearly
credited as the owner of the original work. The use of the emblem of the ILO is not permitted in connection with
users’ work.

Translations – In case of a translation of this work, the following disclaimer must be added along with the
attribution: This translation was not created by the International Labour Office (ILO) and should not be
considered an official ILO translation. The ILO is not responsible for the content or accuracy of this translation.

Adaptations – In case of an adaptation of this work, the following disclaimer must be added along with the
attribution: This is an adaptation of an original work by the International Labour Office (ILO). Responsibility for
the views and opinions expressed in the adaptation rests solely with the author or authors of the adaptation and
are not endorsed by the ILO.

All queries on rights and licensing should be addressed to ILO Publications (Rights and Licensing), CH-1211
Geneva 22, Switzerland, or by email to rights@ilo.org.

Global estimates of child labour: Results and trends, 2012-2016
International Labour Office (ILO), Geneva, 2017

ISBN: 978-92-2-130152-3 (print)
ISBN: 978-92-2-130153-0 (web pdf)

Also available in French: Estimations mondiales du travail des enfants: résultats et tendances 2012-2016
ISBN 978-92-2-230938-2 (print); ISBN 978-92-2-230946-7 (web pdf), ILO, Geneva, 2017; and in Spanish:
Estimaciones mundiales sobre el trabajo infantil: Resultados y tendencias 2012-2016, ISBN 978-92-2-331046-2
(print); ISBN 978-92-2-331047-9 (web pdf), ILO, Geneva, 2017.

The designations employed in ILO publications, which are in conformity with United Nations practice, and the
presentation of material therein do not imply the expression of any opinion whatsoever on the part of the
International Labour Office concerning the legal status of any country, area or territory or of its authorities, or
concerning the delimitation of its frontiers.

The responsibility for opinions expressed in signed articles, studies and other contributions rests solely with their
authors, and publication does not constitute an endorsement by the International Labour Office of the opinions
expressed in them.

Reference to names of firms and commercial products and processes does not imply their endorsement by the
International Labour Office, and any failure to mention a particular firm, commercial product or process is not
a sign of disapproval.

Information on ILO publications and digital products can be found at: www.ilo.org/publns.

Funding for this report was provided by the United States Department of Labor under Cooperative Agreement
numbers GLO/10/55/USA and GLO/11/11/USA. This report does not necessarily reflect the views or policies of the
United States Department of Labor, nor does mention of trade names, commercial products, or organizations
imply endorsement by the United States Government.

4                                                                        Global estimates of child labour: Results and trends, 2012-2016
On any given day in 2016
children aged 5-17 years

                                                      METRICS

                  152                                 ▪▪ 152 million were in child labour
                million                               ▪▪ Of which, 73 million were in hazardous work

                                                 73
                                                million

REGIONAL PREVALENCE OF CHILD LABOUR

▪▪   Africa 			                19.6%
▪▪   Americas 			              5.3%
▪▪   Arab States 			           2.9%
▪▪   Asia and the Pacific 		   7.4%
▪▪   Europe and Central Asia   4.1%

OF THE 152 MILLION CHILDREN IN CHILD LABOUR
         AGE PROFILE                        GENDER                       ECONOMIC ACTIVITY

       48%
         5-11 years-olds
                                                                                  70.9%
                                                                                  Agriculture

                                       58%
       28%
        12-14 years-olds
                                   88 million
                                                    42%
                                                   64 million
                                                                                  11.9%
                                                                                  Industry

       24%
        15-17 years-olds
                                                                                  17.2%
                                                                                  Services

                                                                                                  5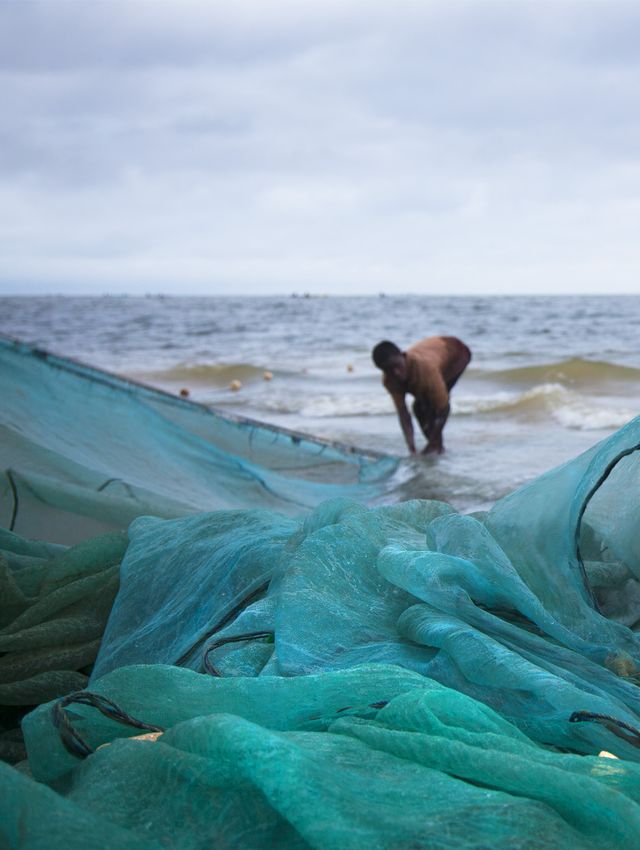
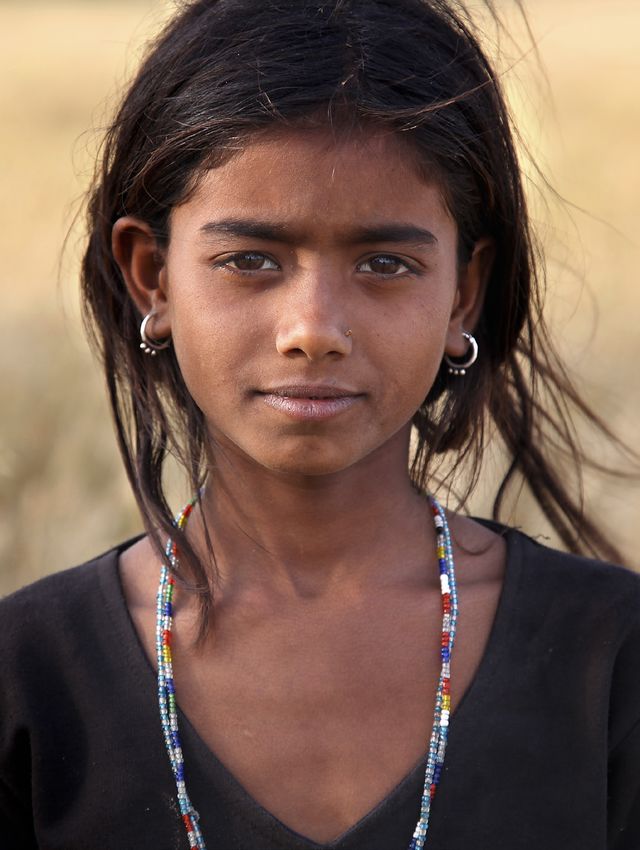
© Lisa Kristine
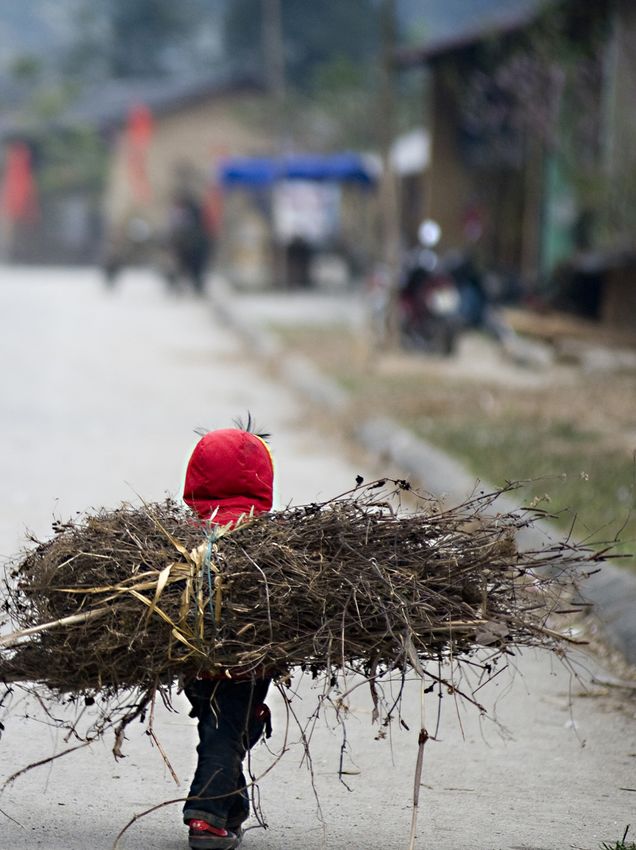
Table of contents
Executive summary                                                     11

Introduction                                                          19

Part 1. Global estimates and trends                                   23
  1.1      Main results of the global estimates                       23
  1.2      The regional picture                                       28
  1.3 Child labour and national income                                32
  1.4 Child labour characteristics: economic sector and work status   34
  1.5      Age profile                                                38
  1.6 Gender profile                                                  42
  1.7      Involvement in household chores                            44
  1.8 Child labour and education                                      47

Part 2. Road forward to 2025                                          51
  2.1      Building a policy response                                 52
  2.2 Age, gender, and regional considerations                        54
  2.3 Building the knowledge base                                     55
  2.4 International cooperation and partnership                       56

Annex: Methodology                                                    59

Endnotes                                                              65

Contents                                                               7
© Lisa Kristine
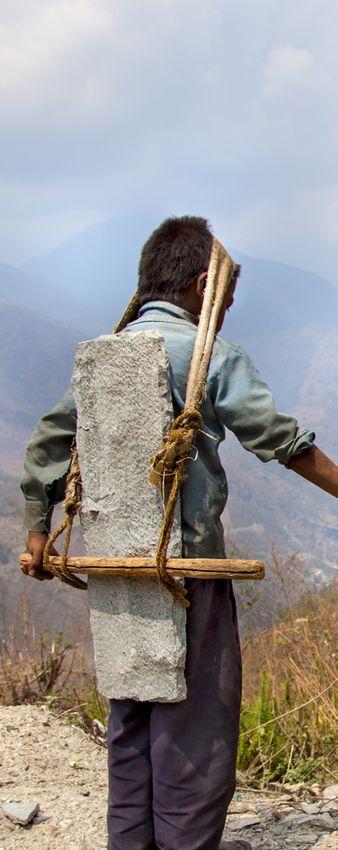
Table 1

Global estimates results at a glance

                                                  Children in           Of which: Children     Of which: Children in
                                                 employment              in child labour         hazardous work

                                                   2012         2016        2012        2016        2012        2016

World                          Number (000s)    264 427    218 019       167 956     151 622      85 344      72 525
(5–17 years)
                               Prevalence (%)       16.7         13.8        10.6        9.6          5.4         4.6
                               Number (000s)    144 066    130 364       120 453     114 472       37 841     35 376
                5–14 years
                               Prevalence (%)       11.8         10.6         9.9        9.3           3.1        2.9
Age range
                               Number (000s)    120 362    87 655         47 503      37 149      47 503      37 149
                15–17 years
                               Prevalence (%)      33.0         24.9         13.0       10.5         13.0        10.5
                               Number (000s)    148 327    123 190        99 766      87 521      55 048      44 774
                Male
Sex                            Prevalence (%)       18.1         15.0        12.2       10.7          6.7         5.5
(5–17 years)                   Number (000s)     116 100   94 829         68 190     64 100       30 296       27 751
                Female
                               Prevalence (%)       15.2         12.4         8.9        8.4          4.0         3.6
                               Number (000s)          --    99 417             --     72 113           --      31 538
                Africa
                               Prevalence (%)         --         27.1          --       19.6           --         8.6
                               Number (000s)          --    17 725             --     10 735           --      6 553
                Americas
                               Prevalence (%)         --          8.8          --        5.3           --         3.2
Region          Asia and       Number (000s)    129 358    90 236         77 723     62 077       33 860      28 469
(5–17 years)    the Pacific    Prevalence (%)       15.5         10.7         9.3        7.4          4.1         3.4
                Europe and     Number (000s)          --     8 773             --      5 534           --      5 349
                Central Asia   Prevalence (%)         --          6.5          --        4.1           --         4.0
                               Number (000s)          --        1 868          --      1 162           --        616
                Arab States
                               Prevalence (%)         --         4.6           --        2.9           --         1.5

                                                                                                                       9
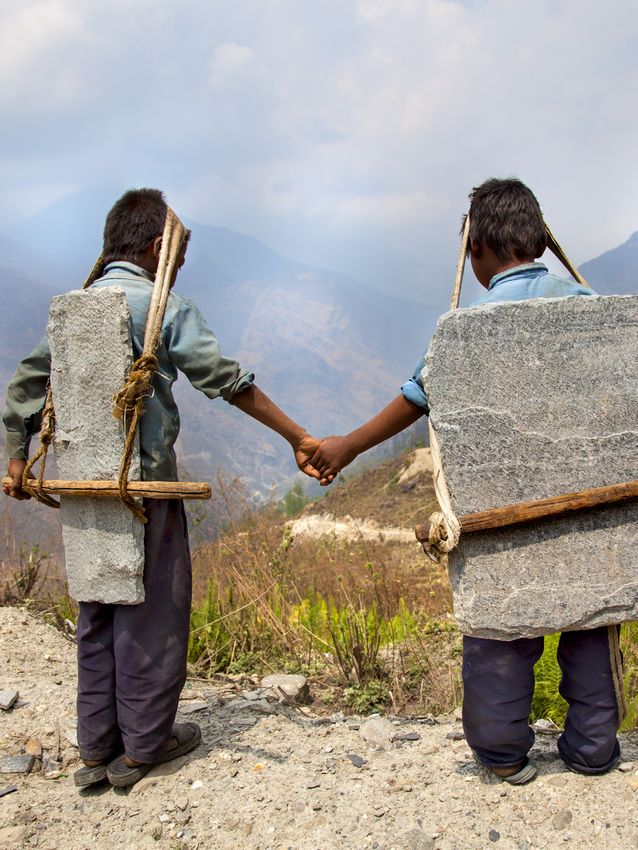
© Lisa Kristine
Executive
                summary
                    The Sustainable Development Goals in-          for ending child labour. The bottom line
                    clude a renewed global commitment              is that we remain far from the world we
                    to ending child labour. Specifically, tar-     want: 152 million children are still en-
                    get 8.7 of the Sustainable Development         gaged in child labour, almost half them in
                    Goals calls on the global community to:        its worst forms.

                         Take immediate and effective
                         measures to eradicate forced
                         labour, end modern slavery and
                         human trafficking and secure the          Global figures
                         prohibition and elimination of the
                                                                   The challenge of ending child labour re-
                         worst forms of child labour, includ-
                                                                   mains formidable. A total of 152 million
                         ing recruitment and use of child
                                                                   children – 64 million girls and 88 million
                         soldiers, and by 2025 end child
                                                                   boys – are in child labour globally, ac-
                         labour in all its forms.
                                                                   counting for almost one in ten of all chil-
                    The current report, the fifth edition of the   dren worldwide. Nearly half of all those in
                    ILO’s quadrennial report series on glob-       child labour – 73 million children in abso-
                    al estimates of child labour, charts how       lute terms – are in hazardous work that
                    far we have come and how far we still          directly endangers their health, safety,
                    have to go to honour this commitment           and moral development. Children in em-
                    to ending child labour. The report de-         ployment, a broader measure comprising
                    scribes the scale and key characteristics      both child labour and permitted forms of
                    of child labour in the world today, as well    employment involving children of legal
                    as changes in the global child labour situ-    working age, number 218 million.
                    ation over time. It also discusses key poli-
                                                                   The dynamic picture indicates that we
                    cy priorities in the campaign to reach the
                                                                   are moving in the right direction. Child
                    2025 target. The report, and the global
                                                                   labour declined during the period from
                    estimation exercise that underpins it,
                                                                   2012 to 2016, continuing a trend seen
                    form part of a broader inter-agency ef-
                                                                   since the publication of the ILO’s first
                    fort under Alliance 8.7 to measure and
                                                                   global estimates of child labour in 2000.
                    monitor progress towards target 8.7 of
                                                                   The 16-year period starting in 2000 saw
                    the Sustainable Development Goals.
                                                                   a net reduction of 94 million in children
                    The 2016 estimates tell a story both of        in child labour. The number of children
                    real progress and of a job unfinished.         in hazardous work fell by more than
                    They show a dramatic decline in child          half over the same period. There were
                    labour over the 16 years since the ILO         almost 134 million fewer children in em-
                    began monitoring child labour in 2000.         ployment in 2016 than in 2000. Real
                    But the estimates also indicate that the       advances have been made in the fight
                    pace of decline has slowed considerably        against child labour, providing an im-
                    in the last four years, precisely at a time    portant foundation for efforts moving
                    when substantial acceleration is needed        forward.
                    to reach the ambitious 2025 target date

Executive summary                                                                                           11
But progress slowed during 2012 to we have comparable estimates for 2012,
2016. A narrower focus on the most re- witnessed a rise in child labour during
cent four-year period indicates a signifi- the 2012 to 2016 period, in contrast to
cant slowing down of progress. The re- the other major regions where child la-
duction in the number of children in child bour continued to decline, and despite
labour amounted to 16 million for the 2012 the number of targeted policies imple-
to 2016 period, just one third of the 47 mented by African governments to com-
million reduction recorded during 2008 bat child labour. It is likely that the ret-
to 2012. Expressed in relative terms, the rogression was driven in important part
share of children in child labour fell by by broader economic and demographic
only one percentage point during 2012 forces acting against governmental ef-
to 2016 compared to three percentage forts, although this is a matter requiring
points in the previous four-year period. further research.
The decline in hazardous work slowed in
a similar fashion. There is a strong correlation between
child labour and situations of conflict
We must move much faster if we are to and disaster. The Africa region has also
honour our commitment to ending child been among those most affected by sit-
labour in all its forms by 2025. A sim- uations of conflict and disaster, which in
ple projection of future progress based turn heighten the risk of child labour. The
on the pace of progress achieved during incidence of child labour in countries af-
2012 to 2016 – the business-as-usual sce- fected by armed conflict is 77 per cent
nario – would leave 121 million children higher than the global average, while
still in child labour in 2025, of which 52 the incidence of hazardous work is 50
million would be in hazardous work. A per cent higher in countries affected
similar calculation indicates that even by armed conflict than in the world as
maintaining the pace achieved during a whole. This situation underscores the
2008 to 2012 – the fastest recorded to importance of prioritizing child labour
date – would not be nearly enough. We within humanitarian responses and dur-
are moving in the right direction, but we ing reconstruction and recovery; govern-
will need to move much more quickly to ments, workers’ and employers’ organi-
reach zero by 2025. zations, and humanitarian actors all have
a critical role to play in this context.
Regional figures
The Africa region and the Asia and the
Characteristics of
Pacific region together host nine out of child labour
every ten children in child labour. Africa
ranks highest both in the percentage of The agricultural sector accounts for by
children in child labour – one-fifth – and far the largest share of child labour.
the absolute number of children in child The sector accounts for 71 per cent of all
labour – 72 million. Asia and the Pacif- those in child labour and for 108 million
ic ranks second highest in both these children in absolute terms. Child labour
measures – 7 per cent of all children, 62 in agriculture relates primarily to subsist-
million in absolute terms, are in child la- ence and commercial farming and live-
bour in this region. The remaining child stock herding. It is often hazardous in its
labour population is divided among the nature and in the circumstances in which
Americas (11 million), Europe and Cen- it is carried out. Children in child labour in
tral Asia (6 million), and the Arab States the services and industry sectors number
(1 million). 26 million and 18 million, respectively, but
these sectors are likely to become more
A breakthrough in Africa will be critical relevant in some regions in the future in
to ending child labour worldwide. The the face of forces such as climate change
2016 estimates suggest that sub-Saharan displacing families from their farms and
Africa, the regional grouping for which into cities.
12 Global estimates of child labour: Results and trends, 2012-2016Most child labour takes place within the in absolute terms, 84 million children
family unit. More than two-thirds of all in child labour, accounting for 56 per
children in child labour work as contribut- cent of all those in child labour, actually
ing family labourers, while paid employ- live in middle-income countries, and an
ment and own-account workers make up additional 2 million live in high-income
27 per cent and 4 per cent, respectively, countries. These statistics make clear
of those in child labour. These numbers that while poorer countries will require
underscore an important broader point special attention, the fight against child
concerning the nature of child labour in labour will not be won by focusing on
the world today. Most children in child poorer countries alone.
labour are not in an employment rela-
tionship with a third-party employer, but AGE PROFILE OF CHILD LABOUR
rather work on family farms and in family
Children aged 5 to 11 years form the
enterprises; understanding and address-
largest share of those in child labour and
ing family reliance on children’s labour
also form a substantial share of those in
will therefore be critical to broader pro-
hazardous work. Forty-eight per cent
gress towards ending child labour.
of all those in child labour are in the 5–11
Forced labour of children requires spe- years age bracket, 28 per cent are aged
cial attention. According to the 2016 12–14 years, and 25 per cent fall into the
Global Estimates of Modern Slavery,1 15–17 years age range. Younger children
there were about 4.3 million children constitute a smaller but still substan-
aged below 18 years in forced labour, tial share of total children in hazardous
representing 18 per cent of the 24.8 mil- work. A quarter of all children in the haz-
lion total forced labour victims world- ardous work group – 19 million children
wide. This estimate includes 1.0 million in absolute terms – are aged 5-11 years.
children in commerical sexual exploita- While there are no possible exceptions
tion, 3.0 million children in forced labour for hazardous work – all children must be
for other forms of labour exploitation, protected from hazardous child labour –
and 300,000 children in forced labour the group of very young children facing
imposed by state authorities. This ex- hazardous work conditions directly en-
treme form of child labour, in which the dangering their health, safety, and moral
children suffer both the impact of the development is of special concern.
hazardous working conditions and the
There are still substantial numbers of
trauma of coercion, threats of penalty,
children in child labour who are above
and lack of freedom, require urgent ac-
the minimum working age. Recent pro-
tion from governments and the interna-
gress has been fastest among children
tional community.
aged 15–17 years, but there are almost
38 million children – 24 million boys and
14 million girls – in this age range in child
labour. It should be recalled that 15-17
Other key results year-olds are above the minimum work-
ing age and therefore are not counted
CHILD LABOUR as child labourers because they are too
AND NATIONAL INCOME young. Rather, they are in child labour
because their work is or may be physi-
Child labour is most prevalent in
cally or psychologically injurious to their
low-income countries but it is by no
health and well-being. This basic fact is
means only a low-income country
reinforced by country-level statistics in-
problem. The prevalence of child labour
dicating that 15-17 year-olds in child la-
is highest in the low-income countries,
bour suffer higher levels of work-related
at 19 per cent. By comparison, 9 per
illness and injury than other employed
cent of children in lower-middle-income
children in this age range. They are also
countries, 7 per cent of children in up-
more likely than other employed 15-17
per-middle-income countries, and 1 per
year-olds to have dropped out of school
cent of children in upper-income coun-
prematurely.
tries are in child labour. But expressed
Executive summary 13GENDER PROFILE OF CHILD LABOUR address the relationship between school-
ing and child labour, in turn one of the
Boys appear to face a greater risk of most important determinants of the im-
child labour than girls. There are 23 mil- pact of child labour on decent work and
lion more boys than girls in child labour sustainable livelihood prospects later in
and 17 million more boys than girls in haz- the life cycle. The estimates indicate that
ardous work. The gender gap increases a very large number of children in child
with age. The difference in child labour labour are completely deprived of educa-
incidence is less than one percentage tion – for the 5–14 years age group, there
point for 5–11 year-olds, rising to three are 36 million children in child labour who
percentage points for 12–14 year-olds and are out of school, 32 per cent of all those
to five percentage points for 15–17 year- in child labour in this age range. While the
olds. But it is possible that these figures remaining 68 per cent are able to attend
understate girls’ work relative to that of school, a growing body of research sug-
boys. As pointed out in previous glob- gests that these children too are penal-
al reports, girls may be more present in ized educationally for their involvement
less visible and therefore under-reported in child labour. The time and energy re-
forms of child labour such as domestic quired by work interfere with children’s
service in private households. It is also ability to derive educational benefit from
worth noting that the decline in child their time in the classroom and to find
labour among girls was only half that time outside the classroom for independ-
among boys during the 2012 to 2016 ent study. As a result, children in child la-
period, meaning that the gender gap in bour tend to perform relatively poorly in
child labour has narrowed. terms of learning achievement and to lag
Girls are much more likely than boys to behind their non-working peers in terms
shoulder responsibility for household of grade progression.
chores, a form of work not considered
in the child labour estimates. Estimates
of children’s involvement in household
chores, produced for the first time for Data sources and
the 2016 Global Estimates, indicates
girls are much more likely than boys methodology
to perform household chores in every
The 2016 estimates use data from a to-
weekly hour bracket. Girls account for
tal of 105 national household surveys
two-thirds of the 54 million children
covering more than 70 per cent of the
aged 5–14 years who perform household
world population of children aged 5 to
chores for at least 21 hours per week, the
17 years. All world regions are covered,
threshold beyond which initial research
and data from the Organization for Eco-
suggests household chores begin to
nomic Cooperation and Development
negatively impact on the ability of chil-
(OECD) countries and China are includ-
dren to attend and benefit from school.
ed for the first time. The ILO gratefully
Girls account for a similar share of the
acknowledges the contributions of nu-
29 million children aged 5-14 years per-
merous national statistical offices, and
forming chores beyond a threshold of
of the United Nations Children’s Fund
28 hours per week, and of the nearly
(UNICEF), the demographic and health
7 million performing chores for 43 or
surveys programme of United States
more hours each week. Girls are also
Agency for International Development
more likely than boys to perform “dou-
(USAID), and the Statistical Office of the
ble work duty”, meaning both work in
European Union (Eurostat) in facilitating
employment and in household chores.
access to the data utilised. The United
CHILD LABOUR AND EDUCATION States Department of Labor provided
important financial support to the ILO’s
Child labour is frequently associated statistical work on child labour. The 2016
with educational marginalization. The estimates are based on the extrapola-
2016 Global Estimates are also the first to tion of data from the surveys following a
14 Global estimates of child labour: Results and trends, 2012-2016similar methodology as that used for the Policy responses should also address
2000, 2004, 2008, and 2012 estimates. the age, gender and regional dimen-
The methodology and data used in pro- sions of child labour. Just under half of
ducing the 2016 Global Estimates are all those in child labour are below 12 years
summarized in Appendix 1 of this report of age and continued attention to these
and are discussed in greater detail in the especially vulnerable children is there-
companion technical paper: Methodolo- fore essential, particularly in light of the
gy of the global estimates of child labour, apparent stagnation in progress for this
2012-2016. group over the last four years. Renewed
attention must also be paid to 15–17 year-
olds in child labour. This group is relevant
to the fields of child labour, youth em-
Conclusions and ployment, and occupational safety and
health, but has hitherto rarely been ac-
way forward corded priority in any of them. This must
change. Differences between boys and
How do we get from where we are now girls in terms of the extent and nature of
to where we want to be by 2025? Thanks their involvement in child labour under-
to a growing body of practical experi- score the continuing relevance of policy
ence, research, and impact evaluations, measures that address the role of gen-
we know a fair deal about the broad der in determining whether children are
strategies and policies that are of most sent to work and the risks they face once
relevance in the fight against child la- there. The results indicating that girls
bour. shoulder disproportionate responsibility
for household chores also raise impor-
Policy responses to child labour need
tant gender concerns that merit consid-
to be integrated into broader national
eration in child labour policies. In regional
development efforts and adapted to lo-
terms, Africa, where child labour is high-
cal circumstances. We know that child
est in both proportionate and absolute
labour is the product of an array of eco-
terms, and where progress has stalled,
nomic and social forces, and attempting
remains a particular priority.
to address it without consideration of
these forces is therefore unlikely to be Continued investment in building the
successful. This means, above all, main- knowledge base on child labour is need-
streaming child labour into broader so- ed to inform policy responses. There is
cial development policies, rather than an ongoing need for information about
treating it as an isolated issue. Ensuring the impact of policies and interventions
that child labour concerns are reflected on child labour. With the exception of
in broader policies in the areas of edu- cash transfers, still too little is known
cation, social protection, labour markets about the effectiveness of interventions
and labour standards is especially rele- in policy areas of relevance to child la-
vant to progress against child labour. bour, which, in turn, is impeding policy
We also know from experience that development. There is a general need for
there is no one-size-fits-all approach to more knowledge of the implications for
addressing child labour. Rather, stra- child labour of broader global challeng-
tegic responses need to be tailored to es, including climate change, migration,
the variety of contexts in which child la- inequality, urbanization, and changes in
bour persists. This includes contexts of the world of work. We also need to know
state fragility and armed conflict, where more about how child labour is linked to
a large share of children in child labour other violations of fundamental labour
live. It also includes contexts affected by rights. The effective targeting of policies
forces such as climate change, economic will require better information on children
informality, urbanization, and globaliza- in the worst forms of child labour other
tion, each of which presents special chal- than hazardous work, building on the re-
lenges in terms of protecting children search and methodological work already
from child labour. undertaken by the ILO and other bodies.
Executive summary 15International cooperation and partner- ship will also be critical to progress. Alliance 8.7 has a key role to play in sup- porting governments in efforts towards ending child labour by the 2025 target date. The Alliance focuses on acceler- ating action, conducting research and sharing knowledge, driving innovation, and increasing and leveraging resourc- es. It brings together all actors, including the critically important social partners – workers’ and employers’ organizations – as well as civil society organizations. In many countries, the cost of required action far exceeds available government resources, meaning that international resource mobilization will also be im- perative to success against child labour, within the spirit of Article 8 of ILO Worst Forms of Child Labour Convention, 1999 (No. 182). The returns on the investment in ending child labour are incalculable. Children who are free from the burden of child labour are able to fully realize their rights to education, leisure, and healthy development, in turn providing the es- sential foundation for broader social and economic development, poverty eradi- cation, and human rights. 16 Global estimates of child labour: Results and trends, 2012-2016
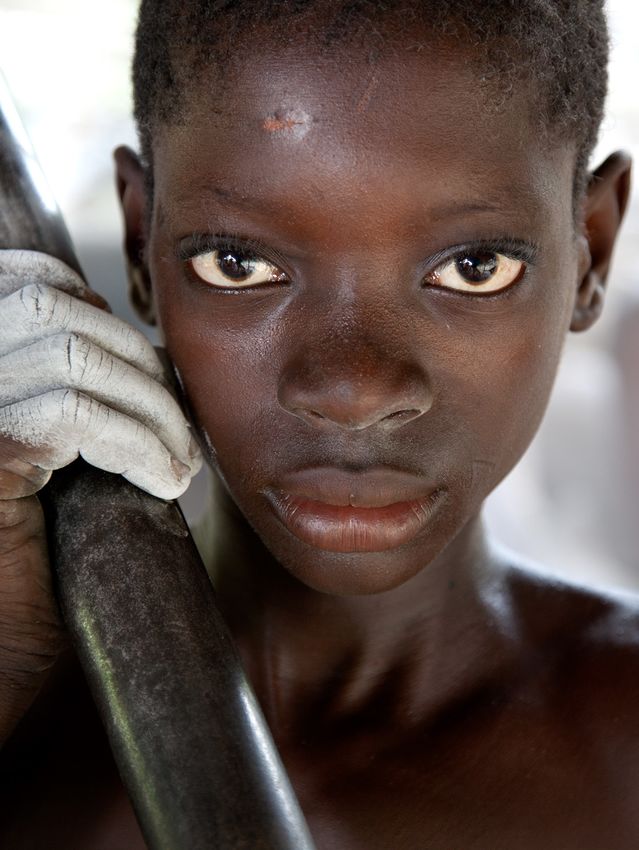
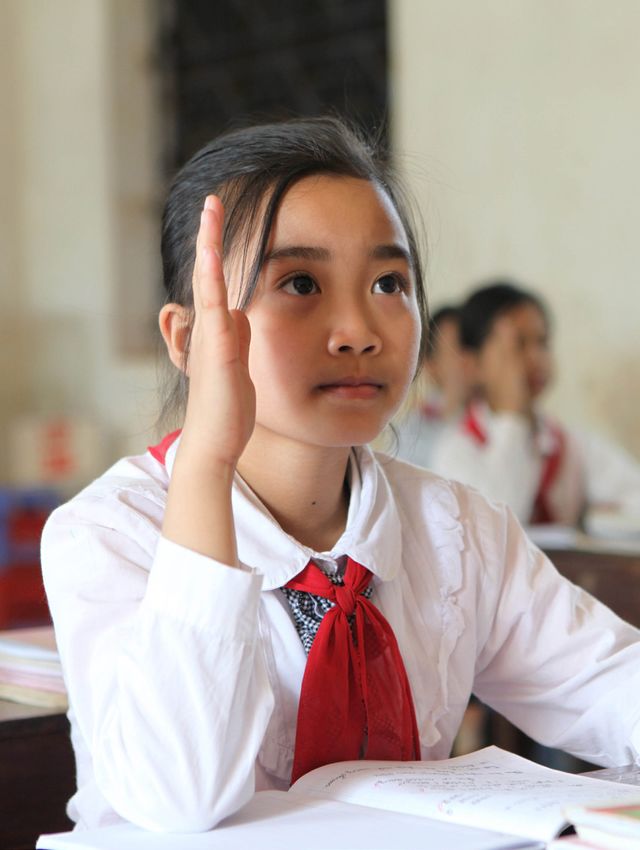
© Lisa Kristine
Introduction
               Some things are just wrong. Child labour             prohibition and elimination of the
               is a brake on sustainable development                worst forms of child labour, includ-
               and anathema to just societies, and its              ing recruitment and use of child
               eradication must be pursued with ut-                 soldiers, and by 2025 end child
               most determination. The eradication of               labour in all its forms.
               child labour is a matter of human rights,
               with an institutional umbrella provided         The current report, the fifth edition of
               by two fundamental International Labour         the ILO’s quadrennial report series on
               Organization (ILO) Conventions, the             global estimates of child labour, charts
               Minimum Age Convention, 1973 (No. 138)          how far we have come and how far we
               and the Worst Forms of Child Labour             still have to go to honour this commit-
               Convention, 1999 (No. 182), as well as by       ment to ending child labour. The report
               the United Nations (UN) Convention on           describes the scale and key characteris-
               the Rights of the Child. These Conven-          tics of child labour in the world today, as
               tions emphasize that freedom from child         well as changes in the global child labour
               labour is a human right and that the elim-      situation over time. It also discusses key
               ination of child labour is a universal and      policy priorities in the campaign to reach
               fundamental value.                              the 2025 target. The report, and the
                                                               global estimation exercise that underpins
               The 2016 Global Estimates present the           it, forms part of a broader inter-agency
               scale, prevalence, and key characteristics      effort under Alliance 8.7 (see next sec-
               of child labour in the world today. Child       tion) to measure and monitor progress
               labour remains endemic and its elimina-         towards target 8.7 of the Sustainable De-
               tion requires both economic and social          velopment Goals.
               reform as well as the active cooperation
               of all those active cooperation of govern-      As for those produced for 2000, 2004,
               ments, workers’ and employers’ organi-          2008, and 2012, the 2016 estimates are
               zations, enterprises, international organi-     based on the extrapolation of data from
               zations, and civil society at large.            national household surveys. The new es-
                                                               timates use data from a total of 105 sur-
               In response to persistent and emerg-            veys covering more than 70 per cent of
               ing development challenges, the global          the world population of children aged 5
               community adopted the 2030 Sustain-             to 17 years. All world regions are covered,
               able Development Goals (SDGs). This             and data from the Organization for Eco-
               “2030 Agenda” is a comprehensive,               nomic Cooperation and Development
               far-reaching, and people-centred set of         (OECD) countries and China are included
               17 interrelated goals and 169 associated        for the first time. The ILO gratefully ac-
               targets to guide global development ef-         knowledges the contributions of numer-
               forts over the coming 13 years. The Sus-        ous national statistical offices, the United
               tainable Development Goals include a            Nations Children’s Fund (UNICEF), the
               renewed global commitment to ending             Demographic and Health Surveys (DHS)
               child labour. Specifically, target 8.7 of the   programme of the United States Agency
               Sustainable Development Goals calls on          for International Development (USAID),
               the global community to:                        and the Statistical Office of the Europe-
                                                               an Union (Eurostat) in facilitating access
                    Take immediate and effective               to the data used to produce the global
                    measures to eradicate forced               estimates. The US Department of Labor
                    labour, end modern slavery and             provided important financial support to
                    human trafficking and secure the           the ILO’s statistical work on child labour.

Introduction                                                                                             19
Thanks to more and richer data from na- we remain far from the world we want:
tional household surveys and ongoing 152 million children are still engaged in
refinements in estimation methods, the child labour, almost half them in its worst
child labour profile emerging from the forms.
2016 estimates is the most detailed to
date. In addition to expanded geograph- It is hoped that the findings presented
ical coverage, these latest estimates in the report, besides alerting all actors
break new ground in providing the first to the extent of child labour in the world
global estimates of children’s involve- today, will also help inform efforts to-
ment in household chores and of the wards ensuring that the obligations to
relationship between child labour and our children enshrined in international
schooling. The methodology and data and national law are met, and that chil-
used in producing the global estimates dren are fully able to realise and exercise
are summarized in Annex 1 of this report their rights.
and are discussed in greater detail in the
THE REPORT IS STRUCTURED
companion technical paper: Methodolo-
AS FOLLOWS:
gy of the global estimates of child labour,
2012-2016.2 Part 1 presents the main results of the
global estimates on child labour and re-
A mixed picture emerges from the lat-
views trends. It reports levels and chang-
est global estimates. Child labour has
es in child labour by region, age, sex, and
continued to fall but the pace of decline
national income levels. It also addresses
has slowed considerably in the past four
the characteristics of child labour and the
years. A simple projection based on the
extent to which children in child labour
pace of past progress suggests we are
are able to attend school. For the first
moving much too slowly to end child la-
time, the profile has been extended to in-
bour by the 2025 target date. Progress
clude household chores and the amount
has slowed most notably for younger
of time children dedicate to them.
children and girls in child labour, groups
that are especially vulnerable. Progress Part 2 discusses the road forward. It
has also failed to extend equally across looks at key overall priorities in ending
regions; Africa in particular has fallen child labour and the main areas of policy
further behind. The bottom line is that focus for addressing them.
Panel 1
Statistical concepts and definitions used in this report
Three main international in 2008 translates these le- such as agricultural pro-
conventions – the UN Con- gal standards into statisti- duce for own use). This
vention on the Rights of the cal terms for the purpose of group includes children in
Child, and ILO Convention child labour measurement.(a) forms of work in both the
Nos 138 and 182 – togeth- The statistical concepts and formal and informal econo-
er set the legal boundaries definitions used in this report my; inside and outside fam-
for child labour and provide are consistent with this ICLS ily settings; for pay or profit
the legal grounds for nation- resolution. (in cash or in kind, part-time
al and international actions or full-time); and domestic
against it. Resolution II con- ▪▪ Children in employment are work outside the child’s
cerning statistics of child la- those working in any form own household for an em-
bour approved at the 18th of market production and ployer (paid or unpaid).
International Conference of certain types of non-mar-
Labour Statisticians (ICLS) ket production (principally, ▪▪ Children in child labour is
the production of goods a narrower category than
20 Global estimates of child labour: Results and trends, 2012-2016children in employment. It harm their health, safety, working age as 14 years) in
excludes children in em- or morals. In general, haz- light work which is: (a) not
ployment who are in per- ardous work may include likely to be harmful to their
mitted light work and those night work and long hours health or development; and
above the minimum age of work, exposure to physi- (b) not such as to prejudice
whose work is not classi- cal, psychological, or sexual their attendance at school,
fied as a worst form of child abuse; work underground, their participation in voca-
labour, or, in particular, as under water, at dangerous tional orientation or train-
“hazardous work”. heights or in confined spac- ing programmes approved
es; work with dangerous by the competent authority
▪▪ Children in the worst forms machinery, equipment, and or their capacity to bene-
of child labour are those tools, or which involves the fit from the instruction re-
in the categories of child manual handling or trans- ceived. For the purpose of
labour set out in Article 3 port of heavy loads; and statistical measurement,
of ILO Convention No. 182. work in an unhealthy en- in this report light work
These categories comprise: vironment which may, for includes children 12 to 14
(a) all forms of slavery or example, expose children years old in employment
practices similar to slav- to hazardous substances, who work in non-hazard-
ery, such as the sale and agents, or processes, or to ous work for less than 14
trafficking of children, debt temperatures, noise lev- hours a week.
bondage and serfdom, and els, or vibrations damag-
forced or compulsory la- ing their health. Hazardous ▪▪ Children performing house-
bour, including forced or work by children is often hold chores refer to those
compulsory recruitment of treated as a proxy cate- performing domestic and
children for use in armed gory for the worst forms personal services for con-
conflict; (b) the use, pro- of child labour. This is for sumption within their
curing or offering of a child two reasons. First, reliable own households. House-
for prostitution, for the pro- national data on the worst hold chores include caring
duction of pornography or forms of child labour other for household members;
for pornographic perfor- than hazardous work, such cleaning and minor house-
mances; (c) the use, pro- as children in bonded and hold repairs; cooking and
curing or offering of a child forced labour or in com- serving meals; washing
for illicit activities, in par- mercial sexual exploitation, and ironing clothes; and
ticular for the production are still difficult to come by. transporting or accompa-
and trafficking of drugs as Second, children in hazard- nying family members to
defined in the relevant in- ous work account for the and from work and school.
ternational treaties; and (d) overwhelming majority of In more technical terms,
work which, by its nature or those in the worst forms of these tasks constitute a
the circumstances in which child labour. “non-economic” form of
it is carried out, is likely to production and are ex-
harm the health, safety, or ▪▪ Children in light work. Ac- cluded from consideration
morals of children. cording to Article 7 of ILO in the UN System of Na-
Convention No. 138, nation- tional Accounts (UNSNA),
▪▪ Children in hazardous al laws or regulations may the internationally agreed
work are those involved in permit the employment or standard set of guidelines
any activity or occupation work of persons from 13 for measuring national eco-
that, by its nature or the years of age (or 12 years in nomic activity, as well from
circumstances in which it countries that have speci- the 2016 Global Estimates.
is carried out, is likely to fied the general minimum
Note: (a) See Resolution II concerning statistics of child labour in: ILO: Report of the Conference, 18th International Conference
of Labour Statisticians, Geneva, 24 November–5 December 2008. ICLS/18/2008/IV/FINAL (ILO, Geneva, 2009). ISBN: 978-
92-2-121730-5 (print).
Introduction 21© ILO
Part 1.
                   Global estimates
                   and trends

        1.1         Main results of the                          cent of children in child labour work in
                                                                 the agricultural sector and 69 per cent
                    global estimates                             work within their own family unit. Near-
                                                                 ly half of all those in child labour – 73
                                                                 million children in absolute terms – are in
                    THE CHALLENGE OF ENDING CHILD                hazardous work that directly endangers
                    LABOUR REMAINS FORMIDABLE                    their health, safety, and moral develop-
                                                                 ment. Children in employment, a broad-
                    The latest ILO estimates indicate that 152   er measure comprising both child labour
                    million children – 64 million girls and 88   and permitted forms of employment,
                    million boys – are in child labour global-   involving children of legal working age,
                    ly, accounting for almost one in ten of      number 218 million.
                    all children worldwide. Seventy-one per

                    Figure 1

                    2016 Global Estimates of children in hazardous work, in child labour, and in employ-
                    ment

                                      Children in
                                       hazardous
                                         work,
                                      72,525,000

                                       Children in
                                      child labour,
                                      151,622,000

                                       Children in
                                      employment,
                                      218,019,000

Part 1. Global estimates and trends                                                                      23
These headline figures make clear that THE DYNAMIC PICTURE INDICATES
the challenge of ending child labour re- THAT WE ARE MOVING IN
mains formidable. Even one child in child THE RIGHT DIRECTION
labour is too many and the fact that there
are still 152 million children engaged in While the challenge is still great, we are
child labour worldwide is inexcusable. clearly moving in the right direction. The
A hypothetical country made up only of 2016 results show that child labour has
these children would rank as the world’s again declined worldwide, continuing
ninth largest. We know from more than a trend seen since the publication of
two decades of research and program- the Global Estimates of Child Labour in
ming experience what works in the fight 2000 (see Figure 2). The 16-year period
against child labour. With the adoption starting in 2000 saw a net reduction of
of the Sustainable Development Goals, 94 million in children in child labour. The
the international community committed number of children in hazardous work
to ending child labour. We now must fell by more than half over the same pe-
turn this knowledge and commitment riod. There were almost 134 million fewer
into accelerated action. children in employment in 2016 than in
2000. Real advances have been made in
the fight against child labour, providing
an important foundation for efforts mov-
ing forward.
Figure 2
Children’s involvement in child labour and hazardous work, 2000–16
Percentage and absolute number of children in child labour and hazardous work, 5–17 years age range,
2000 to 2016(b)
245,500,000 Child labour
20%
Hazardous work
222,294,000
215,209,000
16.0%
15%
167,956,000
14.2%
13.6% 151,622,000
11.1%
10% 10.6%
9.6%
8.2%
170,500,000 7.3%
5.4%
5% 128,381,000
115,314,000
85,344,000 4.6%
72,525,000
0%
2000 2004 2008 2012 2016
Note: (b) Bubbles are proportionate to the absolute number of children in child labour and hazardous work.
24 Global estimates of child labour: Results and trends, 2012-2016PROGRESS SLOWED DURING 2012 broader labour market conditions, and
TO 2016, AND WE HAVE FALLEN therefore may be fragile. The ongoing
WELL SHORT OF OUR GOAL worldwide youth employment crisis has
OF ELIMINATING THE WORST FORMS made it difficult in many countries for
OF CHILD LABOUR BY 2016 children above the minimum working
age to secure jobs, and this low labour
But a narrower focus on the most recent market demand may also have helped
four-year period indicates a significant to reduce their involvement in hazard-
slowing down of progress. The reduc- ous jobs constituting child labour.
tion in the number of children in child la-
bour amounted to 16 million for the 2012 The latest estimate on the forced la-
to 2016 period, just one-third of the 47 bour of children shows little change in
million reduction recorded during 2008 the number of children in forced labour,
to 2012. Expressed in relative terms, the in the private labour economy, and in
share of children in child labour fell by commercial sexual exploitation.3 The few
only one percentage point during 2012 studies undertaken of child victims of
to 2016 compared to three percentage forced labour all mention the difficulty of
points in the previous four-year period. identifying and targeting these hard-to-
The decline in hazardous work slowed in reach children, despite their situations of
a similar fashion. The rapid pace of pro- extreme abuse.
gress recorded from 2008 to 2012 had
given rise to hopes of a gathering mo- THE SLOWING OF PROGRESS DURING
mentum in the fight against child labour, 2012 TO 2016 IS PART OF A BROADER
in turn bringing us closer to the target PATTERN OF UNEVEN PROGRESS
set by the ILO constituency of eliminat- A simple charting of rates of decline over
ing the worst forms of child labour by the four separate four-year intervals
2016. We now know that has not oc- starting in 2000 highlights the uneven
curred and that we have fallen well short nature of global progress against child
of the 2016 target. labour (see Figure 3). The first four-year
OTHER WARNING SIGNS ALSO interval, 2000 to 2004, saw substantial
EMERGE FROM THE LATEST RESULTS strides forward, leading to the optimistic
conclusion that the end of child labour
Beyond this general slowdown in pro- was “within reach”.4 But this optimism
gress, the 2016 results highlight a num- was tempered considerably by the re-
ber of specific areas of concern. Child la- sults of the next, 2004 to 2008, interval,
bour increased in Africa, despite the fact which pointed to a marked slowing of
that many African countries have taken progress, and provided an early warning
strong action to combat child labour. A sign that attaining the 2016 target would
closer look at the progress made during be difficult. The penultimate four-year in-
2012 to 2016 also indicates that it was terval, 2008 to 2012, brought much better
limited primarily to adolescents aged news. The results for this period showed
15-17 years. Numbers of adolescents in the largest decline up to that point in
child labour fell by more than one-fifth, numbers in child labour, even though
while progress among those in the 5-11 the period coincided with a deep glob-
years age range stalled. Gender differ- al economic recession. Unfortunately,
ences in recent progress are another as noted above, progress once more
concern – the decline in child labour slowed during 2012 to 2016, pushing the
among girls was only half that of boys timeline for ending child labour further
during 2012 to 2016. Recent progress is into the future.
also likely in part to be attributable to
Part 1. Global estimates and trends 25Figure 3
Changes in rates of progress against child labour since 2000
Percentage decline in the number of children in child labour, 5–17 years age group, four-year intervals, 2000
to 2016
4%
0%
-3.2%
-4%
-9.5% -9.7%
-8%
-22.0%
-12%
-16%
-20%
-24%
Decline during Decline during Decline during Decline during
2000-04 2004-08 2008-12 2012-16
Thus, the experience over the 16-year WE MUST MOVE MUCH FASTER IF
period has not been one of quickening, WE ARE TO HONOUR OUR
or even steady, progress. We have yet COMMITMENT TO ENDING CHILD
to generate real momentum towards LABOUR IN ALL ITS FORMS BY 2025
ending child labour. This momentum
will be urgently needed if we are to suc- How much faster do we need to go in or-
ceed in moving forward. We must use der to realize target 8.7 of the Sustainable
success as an impetus for achieving fur- Development Goals, calling for the end
ther success and in this way quicken the of child labour in all its forms by 2025?
pace towards ending child labour. We A simple projection of future progress
must also guard against complacency based on the pace of progress achieved
when our goals are in sight. during 2012 to 2016 provides a loud
wake-up call in this regard. As report-
ed in Figure 4, maintaining the current
rate of progress – the business-as-usu-
al scenario – would leave 121 million
children still in child labour in 2025, of
which 52 million would be in hazardous
work. A similar calculation, also shown in
Figure 4, indicates that, even maintaining
the pace achieved during 2008 to 2012
– the fastest recorded to date – would
not be nearly enough. We are moving in
the right direction, but we will need to
move much more quickly to reach zero
by 2025.
26 Global estimates of child labour: Results and trends, 2012-2016Figure 4
Assessing the pace of progress towards target 8.7 of the Sustainable
Development Goals
Number of children involved in child labour, 5–17 years age range, actual and projected trends lines
Target 8.7 date
300 for ending child
labour in all its
forms
246
250
222
215
200
168
152
Millions
150 137
121
Trend line based on
pace of progress
during 2012–16
100
Trend line based on
pace of progress
during 2008–12
50
0
2000 2004 2008 2012 2016 2020 2025
Authors’ calculation based on ILO: Methodology of the global estimates of child labour, 2012-2016, Geneva,
2017.
Part 1. Global estimates and trends 271.2 The regional
picture
Table 2
Regional profile of child labour and hazardous work
Number and percentage of children in child labour and hazardous work, by region, 2016
Children in child labour Children in hazardous work
Number (000s) % Number (000s) %
World (5–17 years) 151 622 9.6 72 525 4.6
Africa 72 113 19.6 31 538 8.6
Arab States 1 162 2.9 616 1.5
Region Asia and the Pacific 62 077 7.4 28 469 3.4
Americas 10 735 5.3 6 553 3.2
Europe and Central Asia 5 534 4.1 5 349 4.0
Note: This report makes use of the new regional classification system developed by ILO-STAT. In accordance
with this system, the Africa region comprises both northern Africa and sub-Saharan Africa, while the Arab
States region excludes northern Africa. The Americas region comprises both Latin American and the Caribbean
and northern America. The regional estimates based on the new regional classifications are therefore not com-
parable with the regional estimates based on the previous regional classification system employed in the 2012
and 2008 global estimate reports. The listing of the countries in each region is provided in Annex 1, table A1, of
the technical report Methodology of the global estimates of child labour, 2012-2016.5
THE AFRICA AND ASIA AND cas (11 million), Europe and Central Asia
THE PACIFIC REGIONS ARE HOST (6 million), and the Arab States (1 mil-
TO NINE OUT OF EVERY lion). In terms of incidence, 5 per cent of
TEN CHILDREN IN CHILD LABOUR children are in child labour in the Amer-
icas, 4 per cent in Europe and Central
Africa ranks highest both in the per- Asia, and 3 per cent in the Arab States.
centage of children in child labour – The regional rankings for hazardous
one-fifth – and the absolute number of work are broadly similar.6
children in child labour – 72 million. Asia
and the Pacific ranks second highest in
both these measures – 7 per cent of all
children, 62 million in absolute terms,
are in child labour in this region. The
Africa and the Asia and the Pacific re-
gions together account for almost nine
out of every ten children in child labour
worldwide. The remaining child labour
population is divided among the Ameri-
28 Global estimates of child labour: Results and trends, 2012-2016Figure 5
Children’s involvement in child labour and hazardous work by region
Percentage and number (in thousands) of children in child labour and hazardous work, 5–17 years age group,
by region, 2016(c)
72,113
Child labour
Hazardous work
20% 19.6%
15%
10% 62 077
8.6%
10,735
7.4%
5,534
31,538 5.3%
5% 1,162
4.1%
3.4% 4.0% 2.9%
3.2%
28,469 6,553 5,349 1.5%
0% 616
Africa Asia and Americas Europe and Arab States
the Pacific Central Asia
Note: (c) Bubble size is proportionate to absolute number of children in child labour and hazardous work in
each region.
A BREAKTHROUGH IN AFRICA riod, in contrast to the other major re-
WILL BE CRITICAL TO ENDING gions where child labour continued to
CHILD LABOUR WORLDWIDE decline (see Figure 6), and despite the
number of targeted policies implement-
In previous global reports, we have ed by African governments to combat
stressed the need above all for a break- child labour. It is likely that the retro-
through in Africa, and the 2016 esti- gression was driven in important part
mates make clear that this has not yet by broader economic and demographic
occurred. Indeed, the latest estimates forces acting against governmental ef-
suggest that sub-Saharan Africa, the forts, although this is a matter requiring
regional grouping for which we have further research. The Africa region has
comparable estimates for 2012,7 is fall- also been among those most affected
ing further behind the rest of the world. by situations of state fragility and crisis,
Sub-Saharan Africa witnessed a rise in which in turn heighten the risk of child
child labour during the 2012 to 2016 pe- labour (see Panel 2).
Part 1. Global estimates and trends 29Figure 6
Change in children’s involvement in child labour from 2012 to 2016, by region
Percentage of children in child labour, 5–17 years age group, 2012 and 2016, by region
25% 2012 2016 Net percentage point change 2012–2016
20%
15%
21.4% 22.4%
10%
5% 9.3% 8.8%
7.4% 7.3%
0% +1.0%
-1.9% -1.5%
-5% Asia and the Pacific Latin America and the Caribbean Sub-Saharan Africa
Panel 2
Child labour in situations of fragility and crisis
According to UNICEF, an es- – characterized by income children’s labour as a cop-
timated 535 million children shocks, a breakdown in for- ing mechanism in situations
(almost one in four children) mal and family social support of heightened vulnerability.8
live in countries affected by networks, displacement, and We also know that children,
conflict or disaster (https:// disruptions in basic services once pulled out of the class-
www.unicef.ch/sites/default/ provision – create the con- room to work, often do not
files/humanitarian-action-re- ditions for further violations go back, meaning that even
port-2017-en.pdf). Children of fundamental labour rights, short-term crises can have
also comprise more than including an elevated risk of enduring adverse conse-
half of the 65 million peo- child labour. We know from quences for children.
ple presently displaced by a large body of research that
war. These fragile situations households can use their
30 Global estimates of child labour: Results and trends, 2012-2016Figure 7
Child labour in countries affected by armed conflict
Percentage of children in employment, child labour and hazardous work, 5–17 years age range, globally and in
countries affected by armed conflict, 2016
25% Global estimates
Countries
20% affected by
armed conflicts
15%
23.3%
10%
17.0%
13.8%
5% 9.6%
6.9%
4.6%
0%
Children in employment Child labour Hazardous work
Note: Countries classified as “affected by armed conflict” are taken from the Report of the Secretary-General
on children and armed conflict, submitted to the UN Security Council in 2015. The category “countries af-
fected by armed conflict” includes Afghanistan, the Central African Republic, Colombia, Iraq, Mali, Nigeria,
the Philippines, South Sudan, Ukraine, Yemen, and the Democratic Republic of the Congo. Countries affected
by armed conflict for which child labour data is not available in the current global estimates include: Libya,
Myanmar, Somalia, Sudan, and the Syrian Arab Republic.
Panel 2 (continued)
In view of these facts, it is higher in countries affected and recovery; governments,
not surprising that there is a by armed conflict than in the workers’ and employers’ or-
strong correlation between world as a whole. Syria repre- ganizations and humanitarian
child labour and situations of sents one of the most tragic actors all have a critical role
conflict and disaster. The Re- contemporary examples of to play in this context. Tools
port of the Secretary-General the link between armed con- are needed to rapidly assess
on children and armed con- flict and child labour. A recent risks of child labour and oth-
flict (S/2015/409), submitted ILO study of Syrian refugees er fundamental labour rights
to the UN Security Council in in Jordan shows poor Syrian violations in fragile situa-
2015, indicates that the share children are much more ex- tions and to guide responses,
of children in employment, posed to child labour than building on those developed
child labour, and hazardous their Jordanian peers.9 Oth- by the ILO and UNICEF for
work is significantly higher in er studies also suggest that assessing the situation and
countries affected by armed the Syria crisis is associated estimating the number of
conflict than global averages. with an alarming rise in child children recruited and used
As reported in Figure 7, the labour.10 by armed groups and armed
incidence of child labour in forces. At the same time, new
countries affected by armed This situation calls for con- intervention models need to
conflict is 77 per cent high- tinued action on a number be developed and tested to
er than the global average, of levels. Child labour must address child labour in crisis
while the incidence of haz- be treated as a priority with- or in fragile situations and to
ardous work is 50 per cent in humanitarian responses, strengthen protection and
and during reconstruction
Part 1. Global estimates and trends 31Panel 2 (continued)
remedies for children and Guiding Principles on the ac- pal, the Philippines, Rwanda,
other affected groups. The cess of refugees and other and Sri Lanka), from which
new guidelines produced by forcibly displaced persons to lessons can be drawn. The
the ILO and Plan Internation- the labour market adopted complexity of crisis and frag-
al for humanitarian workers by the ILO Governing Body ile situations, and the many
on protecting children from in 2016. overlapping mandates for
child labour represent an responding to them, means
important resource in this Economic and social rein- that ensuring close coordina-
regard.11 Where possible, in- tegration to prevent child tion around the issue of child
tervention models should labour in post-conflict and labour is another important
include measures to provide post-emergency situations priority. Alliance 8.7 provides
refugees and other forcibly must not be neglected either. an important vehicle in this
displaced persons with ac- The ILO and its partners have context. One of its six Action
cess to the labour market extensive experience in this Groups deals specifically with
in order to ensure minimum area (for example, in Burun- the issue of child labour in sit-
livelihoods and reduce possi- di, Colombia, the Congo, the uations of fragility.
ble dependence child labour; Democratic Republic of the
this area is dealt with in the Congo, Haiti, Myanmar, Ne-
1.3 Child labour and
national income
Table 3
Child labour and hazardous work by national income
Number and percentage of children in child labour and hazardous work, by national income grouping, 2016
Children in child labour Children in hazardous work
Number (000s) % Number (000s) %
Low-income 65 203 19.4 29 664 8.8
Lower-middle-income 58 184 8.5 33 465 4.9
National
income grouping
Upper-middle-income 26 209 6.6 7 751 2.0
High-income 2 025 1.2 1 645 1.0
Note: The countries are grouped into four categories according to their gross national income per capita
in 2015. The income ranges for each are as follows: low-income (US$1,045 or less), lower-middle-income
(US$1,046–$4,125); upper-middle-income (US$4,126–$12.735) and high-income (US$12,736 or more) countries.
32 Global estimates of child labour: Results and trends, 2012-2016You can also read