More Jobs, Less Pollution: Growing the Recycling Economy in the U.S - Prepared by: Tellus Institute with Sound Resource Management
←
→
Page content transcription
If your browser does not render page correctly, please read the page content below
More Jobs, Less Pollution:
                                   Growing the Recycling Economy in the U.S.

Prepared by: Tellus Institute with Sound Resource Management
Prepared for:
                                 More Jobs, Less Pollution:
                                 Growing the Recycling Economy in the U.S.
BlueGreen Alliance
www.bluegreenalliance.org
                                 Prepared by: Tellus Institute with Sound Resource Management

Teamsters
www.teamster.org

SEIU
www.seiu.org

NRDC
www.nrdc.org

Recycling Works
www.recyclingworkscampaign.org

GAIA
www.no-burn.org
More Jobs, Less Pollution: Growing the Recycling Economy in the U.S.

                            TABLE OF CONTENTS
                             KEY FINDINGS                                                              1

                             EXECUTIVE SUMMARY                                                         3

                             I.   INTRODUCTION                                                         9
                             II. CURRENT WASTE GENERATION, COMPOSITION & MANAGEMENT                   11
                                    A. 2008 Municipal Solid Waste (MSW)
                                    B. 2008 Construction and Demolition Debris (C&D)

                             III. 2030 WASTE GENERATION, COMPOSITION & MANAGEMENT:
                                  BASE CASE (“BUSINESS AS USUAL”) SCENARIO                            17
                                    A. 2030 Base Case – MSW
                                    B. 2030 Base Case – C&D

                             IV. 2030 WASTE GENERATION, COMPOSITION & MANAGEMENT:
                                 GREEN ECONOMY (75% DIVERSION) SCENARIO                               21
                                    A. 2030 Green Economy Scenario – MSW
                                    B. 2030 Green Economy Scenario – C&D

                             V.   EMPLOYMENT IMPACTS:
                                  BASE CASE AND GREEN ECONOMY SCENARIOS                               29
                                    A. Methodology
                                    B. Jobs Related to Current (2008) MSW Management System
                                    C. Base Case Scenario – MSW Management Job Creation (2030)
                                    D. Green Economy Scenario – MSW Management Job Creation (2030)
                                    E. Jobs Related to Current (2008) C&D Management System
                                    F. Base Case Scenario – C&D Management Job Creation (2030)
                                    G. Green Economy Scenario – C&D Management Job Creation (2030)
                                    H. Summary: Total MSW and C&D Job Impacts in 2030

                             VI. ENVIRONMENTAL EMISSIONS:
                                 BASE CASE AND GREEN ECONOMY SCENARIOS                                41
                                    A. Methodology
                                    B. Results: Comparison of Emission Reductions for Each Scenario

                             REFERENCES                                                               51

                             APPENDICES                                                               55

                             ACKNOWLEDGEMENTS                                                         57
More Jobs, Less Pollution: Growing the Recycling Economy in the U.S.

                            KEY FINDINGS
                            This study provides strong evidence that an enhanced national recycling
                            and composting strategy in the United States can significantly and sus-
                            tainably address critical national priorities including climate change, last-
                            ing job creation, and improved health. Achieving a 75 percent diversion1
                            rate for municipal solid waste (MSW) and construction and demolition
                            debris (C&D) by 2030 will result in:

                            •   A total of 2.3 million jobs: Almost twice as many jobs as the projected
                                2030 Base Case Scenario, and about 2.7 times as many jobs as exist in
                                2008. There would be a significant number of additional indirect jobs
                                associated with suppliers to this growing sector, and additional in-
                                duced jobs from the increased spending by the new workers.

                            •   Lower greenhouse gas emissions: The reduction of almost 515 million
                                metric tons of carbon dioxide equivalent (eMTCO2) from diversion ac-
                                tivities, an additional 276 million eMTCO2 than the Base Case, equiva-
                                lent to shutting down about 72 coal power plants or taking 50 million
                                cars off the road.

                            •   Less pollution overall: Significant reductions in a range of conven-
                                tional and toxic emissions that impact human and ecosystem health.

                            •   Unquantified benefits of reducing ecological pressures associated with
                                use of non-renewable resources, conserving energy throughout the ma-
                                terials economy, and generating economic resiliency through stable, local
                                employment.

                                                                                                            1
More Jobs, Less Pollution: Growing the Recycling Economy in the U.S.
EXECUTIVE SUMMARY
We face a series of crises in America today. Nationwide To conduct the analysis, we compared two waste man-
unemployment currently hovers just below 10 percent. agement scenarios: the “Base Case Scenario,” character-
Climate change is already disrupting the American ized by a continuation of current practices and trends
economy and will have greater impacts in coming years, over the next two decades, and the “Green Economy Sce-
and a range of pollutants continue to degrade our nario,” based on a national enhanced recycling and com-
ecosystems and burden public health. Transforming the posting strategy that achieves an overall diversion rate of
“waste sector” into a “materials management sector” 75 percent by 2030.
will create more jobs, reduce greenhouse gas emissions
that cause climate change, and lower other types of pol- THE CURRENT WASTE STREAM
lution and related public health consequences.
In order to construct the alternative scenarios for 2030
we must first understand the magnitude and composi-
While the vast majority of municipal solid waste can be
tion of the existing waste stream. In terms of MSW,
readily recycled, re-used, or composted, only 33 percent
five materials comprise about 77 percent of the almost
is currently diverted from disposal. Most of our discards
250 million tons of total MSW generated in 2008:
are still sent to landfills and incinerators.
paper and paperboard, yard waste, food scraps, plas-
tics, and metals. Organic components made up about
While waste diversion nationally is relatively low, because
64 percent of total 2008 MSW generation.2
of the sheer size of the waste stream, recycling has grown
into an important part of the U.S. economy. Moreover, a
Specific materials are recovered for recycling and com-
number of cities have achieved considerably higher waste
posting at very different rates. As summarized in Figure
diversion rates and provide successful models that show a
ES-1, the U.S. diverted approximately 33 percent of
path to a significantly stronger recycling economy.
MSW in 2008. This is considerably below the diversion
rates of many cities and states with robust recycling and
This report assesses the impacts of implementing a
composting programs, leaving considerable room for
bold national recycling and composting strategy in the
additional diversion.
United States over the next two decades. Specifically,
we explore the impact on jobs and environmental pol-
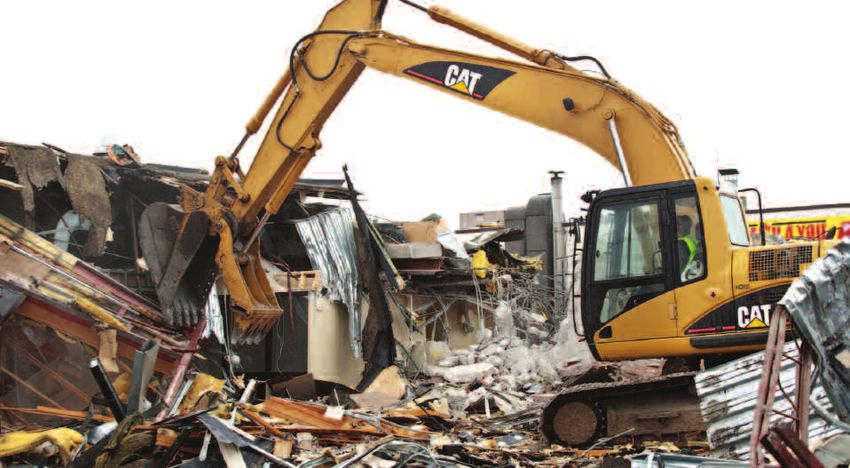
In addition to MSW, 178 million tons of C&D waste
lutants if the U.S. were to achieve a 75 percent national
was generated in 2008. The C&D stream includes
waste diversion rate by 2030.
wastes generated from demolition, renovation, and
new construction. Two materials dominate C&D waste
The report analyzes both municipal solid waste (MSW),
and comprise roughly 70 percent of the total: concrete
as well as construction and demolition debris (C&D).
and mixed rubble (45 percent), and wood (25 per-
MSW is generated by households as well as commercial
cent). In 2008 approximately 30 percent of C&D de-
and institutional entities. It does not include industrial
bris generated in the U.S. was diverted (recycled) and
waste. C&D is generated from construction and demoli-
70 percent was disposed.3 Virtually all recovered C&D
tion activities in the residential and commercial sectors.
waste was recycled; almost none was composted. Simi-
Although less visible than MSW, C&D debris is included
larly, virtually all C&D disposal was via landfill and
in this analysis because of its importance relative to MSW
very little was incinerated. As with MSW, much higher
(building-related C&D alone is roughly 70 percent as
C&D diversion rates have been achieved in various ju-
large as MSW generation) and because it presents strong
risdictions throughout the U.S., indicating that there
opportunities for reuse and recycling.
3
are significant opportunities for increased diversion on    respective impacts on emissions and jobs in the Green
    a national scale.                                           Economy Scenario, we do provide examples of the
                                                                kinds of policy, regulatory, and lifestyle initiatives that
    2030 BASE CASE SCENARIO                                     will be necessary to achieve the higher level of recy-
    The Base Case Scenario represents a “business as usual”     cling and composting in this Scenario.
    approach to solid waste management in which current
    practices and trends continue until 2030. No major new      Figures ES-1 and ES-2, below, provide a comparative
    policy interventions or lifestyle changes are introduced,   summary of the MSW and C&D waste flows and
    and most basic assumptions remain unchanged.                management practices in 2008 and for the two sce-
                                                                narios in 2030.
    Based on trends over the past decade, per capita
    MSW generation is projected to remain unchanged
                                                                Figure ES-1
                                                                       Figure ES-1
    from 2008 levels (1,697 lbs. per person),4 and popula-
                                                                U.S. MSW
                                                                      U.S. Waste Flows Flows
                                                                           MSW Waste
    tion is expected to grow from 304 million in 2008 to
                                                                   350
    374 million in 2030.5 Thus, the overall MSW stream
    is expected to grow at the rate of population growth,          300
    from 250 million tons in 2008 to about 314 million
    tons in 2030. In addition, the modest growth in the            250
    MSW diversion rate that has been experienced in the
    U.S. over the past decade (one percent per year) is as-        200

    sumed to continue, reaching 41 percent in 2030 in
                                                                   150
    the Base Case Scenario.
                                                                   100
    Similar projections are made for C&D in the Base Case
    Scenario, based on the best available data. As a result,        50

    C&D generation is projected to reach almost 219 mil-
                                                                     0
    lion tons in 2030. The diversion rate increases to 37                            2008     2030 Base Case         2030 Green Economy
                                                                                                                           Scenario
    percent by 2030, accounting for almost 82 million
    tons, while 137 million tons of C&D continues to be                                      KEY    Disposal         Composted    Recycling

    disposed in landfills.

                                                                Figure ES-2
    THE GREEN ECONOMY SCENARIO                                         Figure ES-2
                                                                U.S. C&D
    The Green Economy Scenario is based on the same as-               U.S.Waste Flows Flows
                                                                          C&D Waste
    sumptions used in the Base Case in terms of the               250
    growth of MSW and C&D, driven by expected popu-
    lation growth through 2030. The fundamental differ-           200
    ence is that the Green Economy Scenario reflects an
    overall waste diversion rate of 75 percent. This figure
                                                                  150
    represents what is achievable through implementation
    of a set of enhanced policy, regulatory, and lifestyle
    changes to reach this level of recycling and compost-         100
    ing. Though considered aggressive by today’s prac-
    tices, the policies, regulations and behavior changes          50
    driving this scenario are based on what are considered
    “best practices” currently in place in a number of ju-
                                                                     0
    risdictions in the U.S. and abroad.                                              2008      2030 Base Case        2030 Green Economy
                                                                                                                           Scenario

    While we do not attempt to provide detailed descrip-                                                       KEY     Disposal   Recycling

    tions of each of the specific best practices and their

4
JOB CREATION IMPACTS labor intensive. Manufacturing using recycled materials
Based on the waste stream characteristics and manage- creates a relatively high number of jobs per 1,000 tons,
ment practices developed for the Base Case and Green varying by material/sector (e.g., about 4 jobs per 1,000
Economy Scenarios, the employment implications of tons for paper manufacturing and iron and steel manu-
each scenario were analyzed. The analysis includes the facturing, and about 10 jobs per 1,000 tons for plastics
various stages of materials management including col- manufacturing). Though relatively small tonnages of
lection, hauling, and processing (if any), as well as the material are involved, MSW reuse and remanufacturing
ultimate disposition of the collected materials through activities are particularly job intensive owing to the
reuse/remanufacturing, new product manufacturing, labor required for disassembly, inspection, repair/refur-
composting, or disposal via landfilling or incineration. bishment, reassembly, and testing.
Based on several existing data sources6 we derived The job creation impacts of the Base Case and Green
estimates of jobs produced per 1,000 tons of MSW man- Economy Scenarios are summarized below in Figure ES-3.
aged for each of the diversion and disposal management
Figure ES-3
activities (collection, processing, manufacturing,
Total MSW and C&D Job Impacts
reuse/remanufacturing, landfilling, and incineration), for
each material in the waste stream (paper, glass, metals, 2,500,000
plastics, rubber, textiles, wood, food scraps, yard trim-
mings, miscellaneous organic wastes, and other wastes). 2,000,000
In addition to job impacts from waste disposal (landfill- 1,500,000
ing and incineration), we estimate job creation for three
categories of recycling: (1) Recycling Industries, includ-
1,000,000
ing collection and processing of recyclables to make
them available for use in new industrial processes; (2)
Recycling Reliant Industries, including industries that 500,000
purchase secondary materials from the Recycling Indus-
try; and (3) Reuse and Remanufacturing Industries, in- 0
2008 2030 Base Case 2030 Green Economy
cluding those industries that directly reuse and/or Scenario
remanufacture products for their original use. KEY C&D MSW
The job creation data reveal that waste disposal is not
labor intensive and generates the fewest jobs per ton of In 2008 there were approximately 861,000 jobs directly
waste (0.1 job per 1,000 tons) for the various management associated with the management of MSW and C&D
activities. This is not surprising given that the capital in- (666,000 and 195,000, respectively). Though more
tensive equipment used at disposal facilities can handle than two-thirds of MSW and C&D waste was disposed
large tonnages with few employees. Materials collection in 2008, only about 15 percent of the jobs associated
also generates relatively few jobs, but more than disposal. with managing these wastes were from disposal related
activities (collection and landfilling or incineration).
By contrast, because of the labor intensity of waste
The Green Economy Scenario with a 75 diversion, 85 percent of the jobs were associated with
various diversion activities (collection, processing,
percent diversion rate generates 2,347,000
manufacturing with recycled materials, and compost-
total direct jobs—over 1.1 million more ing). Jobs associated with manufacturing using recy-
jobs than in the Base Case, and nearly 1.5 cled inputs accounts for about 44 percent of the total
jobs created related to MSW management and 24 per-
million more jobs than in 2008.
cent of C&D management related jobs. Recycled mate-
rial collection and processing also creates a significant
Processing of recyclables (2 jobs per 1,000 tons) and fraction of the overall jobs for both MSW (37 percent)
organics (0.5 jobs per 1,000 tons) is somewhat more and C&D (33 percent).
5In the Base Case Scenario, due to growth in the waste • Use phase: product use; and
stream and modest increases in the recycling and com- • End-of-life phase: management of product
posting rate (from 33 percent to 41 percent), about discards.
368,000 incremental jobs are created by 2030, resulting in This approach accounts for how reuse and recycling
a total of almost 1,229,000 jobs associated with the man- eliminate the need for much of the upstream phase,
agement of both the MSW and C&D waste streams. Due thereby conserving energy and reducing waste and pol-
to the increase in the recycling rates, diversion related ac- lutants in the production of goods and services, in addi-
tivities account for about 89 percent of the total jobs. tion to the benefits achieved in the end of life phase.
In contrast, the Green Economy Scenario with a 75 For key materials in the MSW and C&D streams the
percent diversion rate generates 2,347,000 total direct methodology aggregates pollutants for seven environ-
jobs in 2030—over 1.1 million more jobs than in the Base mental impact categories in the following indicator
Case, and nearly 1.5 million more jobs than in 2008. The pollutants:
combination of the higher diversion rate and the relative
labor intensity of diversion activities means that in the
• Climate change – carbon dioxide equivalents (eCO2);
Green Economy Scenario 98 percent of total waste man- • Human health-particulates – particulate matter less
agement jobs are related to MSW & C&D diversion activi- than 2.5 microns equivalents (ePM2.5);
ties and only 2 percent are associated with disposal. • Human health-toxics – toluene equivalents
Manufacturing jobs using recycled materials accounts for (eToluene);
the largest share by far of the projected jobs in 2030; 49 • Human health-carcinogens – benzene equivalents
percent of MSW management jobs and about 44 percent (eBenzene);
of C&D related jobs. We provide a detailed breakdown of • Eutrophication – nitrogen equivalents (eN);
job creation by management activity in the report. • Acidification – sulfur dioxide equivalents (eSO2); and
• Ecosystems toxicity – herbicide 2,4-D equivalents
ENVIRONMENTAL EMISSION IMPACTS (e2,4-D).
An increased diversion rate not only spurs job cre-
ation, but also significantly reduces greenhouse gas
emissions that contribute to climate change, as well as The Green Economy Scenario avoids
emission of toxic pollutants that are dangerous to
human lives and our ecosystems.
about 515 million eMTCO2 in 2030, more
than twice as much as the Base Case.
To assess the relative environmental impacts of the
Base Case and Green Economy waste management
scenarios in 2030 we utilized the Measuring Environ- For each of the seven emissions categories modeled,
mental Benefits Calculator (MEBCalc) model, a life- the assessment indicates that recycling/composting
cycle assessment (LCA) tool.7 The model employs a reduces emissions considerably relative to waste dis-
life-cycle approach to capture the input of energy and posal. These environmental benefits come primarily
the output of wastes and pollution that occur not just from pollution reductions in the manufacture of new
at the end of use, but over the three phases of a mater- products with recycled materials instead of virgin raw
ial’s or product’s life cycle: materials, and the replacement of synthetic petroleum-
• Upstream phase: resource extraction, materials based fertilizers with compost. For most pollutants,
refining, and product manufacture; the relative upstream benefits of diversion are quite
dramatic. For example, recycling reduces energy-re-
lated eCO2 emissions in the manufacturing process
The Green Economy Scenario represents a and avoids emissions from waste management. More-
powerful opportunity to reduce the human over, in the case of paper, recycling maintains the on-
going sequestration of carbon in trees that would
health and ecosystem impacts of pollution otherwise need to be harvested to manufacture paper.
from waste management activities. Given the prominence of climate change in current
U.S. and global policy debates, the impacts of the
6different waste management scenarios on green- Figures ES-5 and ES-6 summarize the relative emission
house gas emissions is important. reduction benefits of the Base Case and Green Econ-
omy Scenario for particulate emissions (less than 2.5
Figure ES-4, below, presents the relative GHG savings microns equivalents, ePM2.5) associated with respira-
that accrue from diversion activities in the MSW and tory illnesses and for sulfur dioxide (eSO2) that leads
C&D management systems. to ecosystem degradation in terms of acidification of
water bodies. As with GHGs, the reductions in emis-
Figure ES-4 sions of these pollutants in the Green Economy Sce-
Climate Change Emissions Reductions from Diversion nario are significantly greater than those in the Base
600
Case. This trend follows for the other pollutant emis-
sions measured in this study. The Green Economy
500
Scenario, therefore, represents a powerful opportu-
nity to reduce the human health and ecosystem im-
400
pacts of pollution from waste management activities.
300
Figure ES-5
Figure ES-5
200 Respiratory Emissions
Respiratory Reductions
Emissions from Diversion
Reductions from Diversion
600
100
500
0
2008 2030 Base Case 2030 Green Economy 400
Scenario
KEY C&D MSW
300
MSW and C&D diversion activities in 2008 reduced 200
GHG emissions about 153 million eMTCO2. In the Base
Case Scenario the modest growth in recycling rates 100
combined with a growing waste stream result in annual
GHG emission reductions in 2030 of about 238 million 0
eMTCO2, while in the Green Economy Scenario GHG 2008 2030 Base Case 2030 Green Economy
Scenario
reductions of about 515 million eMTCO2 are achieved.
KEY C&D MSW
This is equivalent to shutting down about 72 coal-fired
power plants or taking 50 million cars off the road.8 Figure ES-6
Figure ES-6
Acidification Emissions
Acidification Reductions
Emissions from Diversion
Reductions from Diversion
The high organic content of MSW (paper and paper- 2500
board, yard waste, food scraps, and plastics) means
that diversion of MSW accounts for the vast majority 2000
of GHG emission reductions. By contrast, C&D waste
has a considerable fraction of inorganic material
1500
(concrete, rubble, brick), so C&D diversion con-
tributes only about 15 percent of overall GHG reduc-
tions in the Base Case Scenario and 25 percent in the 1000
Green Economy Scenario. The somewhat higher frac-
tion from C&D diversion in the Green Economy Sce- 500
nario is driven by the increased recycling/reuse of
wood and, to a lesser extent, plastics.
0
2008 2030 Base Case 2030 Green Economy
Scenario
The results of the analysis are similar for human
health and ecosystem related impacts. For example, KEY C&D MSW
7More Jobs, Less Pollution: Growing the Recycling Economy in the U.S.
I. INTRODUCTION
There is growing recognition and urgency surround- and the other reflecting 75-percent diversion through sig-
ing a series of environmental and economic challenges nificantly enhanced recycling and composting efforts.9
facing the United States. In the environmental arena
these include climate change, natural resource deple- There are many data gaps and related challenges in carry-
tion, an increasing proliferation of wastes, toxics con- ing out such an analysis. In conducting this study we have
tamination and destruction of essential ecosystems. relied on existing data from federal, state and local agen-
On the economic front, they include volatile energy cies; non-governmental organizations; consultant re-
and commodity prices as well as continued high un- ports; and academic papers. To the extent feasible, we
employment. These challenges are multifaceted and used standard sources frequently cited in the field, such as
require new approaches that transform existing prac- information produced by the U.S. EPA, the U.S. Depart-
tices from those that are resource intensive, polluting, ment of Labor, the U.S. Department of Commerce, the
and produce few jobs to those that minimize use of U.S. Census Bureau and various state environmental
virgin materials, are environmentally preferable and agencies, as well as data developed by the National Recy-
create significant job opportunities. cling Coalition and others.
The current solid waste management system in the ORGANIZATION OF THIS REPORT
U.S. presents an excellent opportunity to encourage Following this Introduction, Section II presents an
such a shift. A new “materials management” paradigm overview of 2008 waste generation, composition and
recognizes the important link between our consump- management practices for municipal solid waste
tion patterns, waste generation, environmental emis- (MSW) and construction and demolition (C&D) de-
sions and jobs. It places greater emphasis on reducing bris. It documents the specific materials that comprise
virgin material inputs; encompasses a deeper level of each of these two waste streams, how much of each
waste reduction through reuse, recycling and compost- material type is generated, and how much of each ma-
ing; and has the potential for significant reductions in terial is recycled, composted and disposed. This pro-
greenhouse gas emissions (and other toxics), while at vides the starting point for the assessment of
the same time creating large numbers of new jobs alternative future scenarios.
throughout the U.S.
Section III describes the “Base Case” Scenario in which
This report assesses the impacts of implementing a the current waste generation, composition and man-
bold national recycling strategy in the United States agement profile is projected to 2030. In the Base Case
over the next two decades. Specifically, we explore the no major new policy interventions or lifestyle changes
impacts on jobs and on certain environmental emis- are introduced. Rather, it can be characterized as
sions of achieving a 75-percent waste diversion rate by “business-as-usual,” where current practices and
2030. By “diversion” we mean diversion from waste trends continue. In Section IV, an alternative scenario
disposal either in landfills or incineration facilities. is presented that reflects an overall waste diversion rate
Waste diversion approaches include waste reduction, of 75 percent. This Green Economy Scenario is defined
reuse and remanufacturing, recycling and composting. normatively, meaning it represents what is achievable
through implementation of an enhanced set of policy,
To conduct the analysis, we compared two waste manage- regulatory and lifestyle changes to achieve this level of
ment scenarios, one based on continuing current practices, recycling and composting.
9Based on the profile of waste stream characteristics
and management practices developed for the Base
Case and Green Economy Scenarios, Section V assesses
and compares the employment implications of each
scenario. This analysis covers the various stages of ma-
terials management, including collection, hauling and
processing, if any, as well as the ultimate management
of the collected materials through reuse/remanufactur-
ing, new product manufacturing, composting, or dis-
posal via landfilling or incineration.
Section VI assesses the life-cycle environmental impacts
of the alternative scenarios. By applying the Measuring
Environmental Benefits Calculator (MEBCalc), it com-
pares the emissions of greenhouse gases and various
other pollutants associated with the alternative materials
management practices of the two scenarios.
Finally, Section VII presents a summary of our find-
ings, discusses key policy implications and identifies
areas requiring further research.
10More Jobs, Less Pollution: Growing the Recycling Economy in the U.S.
II. CURRENT WASTE GENERATION,
COMPOSITION & MANAGEMENT
Before analyzing alternative waste management scenar- Figure 1
ios, we need to understand the magnitude and compo- MSW Generation Rates, 1960 to 2008
sition of the current municipal solid waste (MSW) and
300 10
construction and demolition debris (C&D) waste
streams and how they are managed. This involves char- 250 8
acterizing the materials that comprise these waste
streams, the tonnage of each material type that is gen- 200
6
erated, and how much of each material is currently
150
recycled,10 composted or disposed. 4
100
The waste streams considered include both MSW and 2
C&D. It does not include industrial or agricultural 50
wastes. As described in the report, MSW is generated
0
by households as well as commercial and institutional 0
1960 1970 1980 1990 2000 2007 2008
entities. C&D is generated from construction and
demolition activities in the residential and commercial KEY Total MSW generation Per capita generation
sectors. Though it is often overlooked by the public
and many policymakers, C&D debris is included in
this analysis because of its importance in the overall As summarized in Figure 2, the EPA data reveal several
waste stream: building-related C&D alone is roughly trends in U.S. waste management practices over the
70 percent as large as MSW generation.11 Inclusion of past several decades:
C&D, therefore, is important in assessing alternative • Recycling played a minor role in waste manage-
waste management scenarios and developing a com- ment through the 1970s, grew rapidly in terms of
prehensive materials management program. tonnage and percent of the waste stream in the
1980s and 1990s, and has leveled off since about
A. 2008 MUNICIPAL SOLID WASTE (MSW) 2000. Recycling managed about 24 percent of the
waste stream in 2008.
Total MSW generation in the U.S. has been steadily
growing over the past several decades (notwithstanding
• Composting was negligible until the late 1980s,
grew rapidly in the 1990s and has continued to
a minor drop in 2008, likely related to the severe eco- grow modestly since 2000. Composting managed
nomic recession), with 2008 generation of about 250 less than 9 percent of the waste stream in 2008.
million tons.12 At the same time, per-capita generation
has grown much more slowly, reaching 4.5 pounds per
• MSW incineration was minimal until the mid-
1980s, when the vast majority of the plants cur-
person per day (lbs/person/day) in 1990 and it has hov- rently operating were constructed, grew modestly
ered between 4.4. and 4.6 lbs/person/day since that time in the 1990s, and has declined modestly both in
(see Figure 1). Given the known demographic trends in terms of tonnage and percent of the waste stream
the U.S. over the past 20 years, it appears that increases since 2000, to less than 13 percent of the waste
in MSW generation over this period have been driven stream in 2008.
primarily by population growth. • As the waste stream has grown over the years, the
13relative importance of landfill disposal in terms of Table 1
the fraction of the waste stream managed declined MSW Generation in the U.S. – 2008
rapidly in the 1980s and 1990s, with only very mod-
est declines since 2000. As of 2008, landfills managed MATERIALS 1000S OF SHARE OF
about 54 percent of the total waste stream. In terms TONS TOTAL MSW
of tonnage the amount sent to landfills has been re- Materials in Products
markably stable since about 1980.
Paper & Paperboard 77,420 31%
Glass 12,150 5%
Figure 2
U.S. MSW Management, 1960 to 2008 Metals
Ferrous 15,680 6%
300
Recovery of the composting
component of recycling
Aluminum 3,410 1%
250
Other Nonferrous 1,760 1%
Recovery for recycling
200 Plastics 30,050 12%
Combustion with
energy recovery Rubber & Leather 7,410 3%
150
Landfill, other disposal
Textiles 12,370 5%
100 Wood 16,390 7%
50
Other** 4,500 2%
Total Materials in Products 181,140 73%
0
1960 1965 1970 1975 1980 1985 1990 1995 2000 2005
Other Wastes
A more detailed summary table of MSW generation
Food Scraps 31,790 13%
and management by material type is included in Ap-
pendix A. Yard Trimmings 32,900 13%
Misc. Inorganic Wastes 3,780 2%
Figure 3
U.S. MSW Management, 2008 Total Other Wastes 68,470 27%
(1000 tons)
31,550
13% Total MSW Generated 249,610 100%
60,770 As summarized in Figure 3, of the 250 million tons of
24%
MSW generated in the U.S. in 2008, 63 percent was
disposed of in landfills or incinerators while 37 per-
135,190
cent was diverted through recycling or composting.
54%
22,100
9%
KEY Diversion Recycled Diversion Composted
Disposal Landfill Disposal Incineration
Table 1 provides a profile of more than a dozen major
types of materials generated13 and the tonnage for each
material for 2008, the most recent year for which data
are available.
14Key Points Regarding 2008 overall solid waste stream14 (40 percent or more in
MSW Generation and Management most estimates) and is, therefore, important to address
in an assessment of the jobs and environmental im-
Based on the data summarized above, the following key
pacts of alternative material management scenarios.
points about MSW generation and management in 2008
should be highlighted:
There is not, however, a consensus definition of what
• Five materials comprise about 77 percent of the is included in the C&D waste stream and what is ex-
almost 250 million tons of total MSW generated in cluded. Broadly defined, structures that generate C&D
2008: include buildings (both residential and non-residen-
Material 2008 Tonnage % Total tial), as well as infrastructure such as roads and
(millions)
bridges. It may also include land-clearing debris re-
Paper and paperboard 77 31% lated to construction-site preparation. Different juris-
Yard waste 33 13% dictions have adopted different definitions, hampering
Food scraps 32 13% consistent data reporting and collection. Moreover,
Plastics 30 12% even within building-related C&D, new construction,
renovation and demolition each generate somewhat
Metals (3 types) 21 8%
different waste streams, as do residential versus non-
Totals 193 77% residential buildings. Further complicating the C&D
data and analysis picture is the fact that sometimes,
• Organic components of the waste stream (yard particularly in rural areas, C&D debris is comingled
trimmings, food scraps, paper and paperboard, and with MSW.
wood) comprise approximately 64 percent of total
2008 MSW generation. Thus, it is not surprising that unlike for MSW, there
• Materials are recovered for recycling and composting is not a single widely accepted source for up-to-date
at very different rates. For example, almost 69 per- data on C&D debris generation, composition and
cent of nonferrous metals and 55 percent of paper/ management. For the current study, we have focused
paperboard is recycled, while only 7 percent of plas- on building-related C&D, as this is included in virtu-
tics and 10 percent of wood is recycled. About 65 ally all definitions, and to date it has been the focus
percent of yard trimmings are composted compared
of EPA’s efforts to assemble the disparate sources of
with less than 3 percent of food scraps.
data and analyze national C&D generation and man-
• A 33-percent MSW diversion rate lags well below what agement activities.
might be considered “best practice” in the U.S. Numer-
ous municipalities and states (and other countries)
have achieved much higher diversion rates, especially EPA acknowledges that “Limited information is avail-
those adopting a “zero waste” or “materials manage- able on the amount of C&D materials generated and
ment” policy framework (e.g., Massachusetts, Oregon, managed in the U.S.” and that “efforts to improve C&D
San Francisco, Seattle). measurement are currently hampered by a general lack
of data. Thus, it should be recognized that the C&D
This profile of existing generation and diversion by mate- materials estimates presented to date, including those
rial type is critical input for identifying the target mate- [assembled by EPA]…have some level of uncer-
rials and programs that can lead to much more robust tainty…Nevertheless, we believe that the estimates
MSW recycling and composting, as described in the contained in this report reflect and are based on the
Green Economy Scenario in Section IV. best data that are currently available.”15, 16
According to EPA data, demolition generates the
B. 2008 CONSTRUCTION AND largest share of building-related C&D (on the order of
DEMOLITION DEBRIS (C&D) 50 percent), followed by renovation (as much as 40
C&D debris is material that is generated in the con- percent), with new construction contributing the
struction, renovation or demolition of structures. smallest share.17 For construction and renovation,
C&D debris comprise a significant fraction of the there is generally better data on residential buildings
15than non-residential buildings. The materials most com- recovered material.
mon in residential construction debris are wood and dry-
wall. By contrast, the C&D debris from building As summarized in Figure 4, in 2008 approximately 30
renovation is extremely diverse given that it is generated percent of the 178 million tons of C&D debris gener-
from all kinds of remodeling efforts – from kitchens and ated in the U.S. was diverted (recycled) and 70 percent
bathrooms to roofs and driveways – and includes both was disposed. Unlike other components in the MSW
new construction waste and demolition debris. In terms stream, virtually all recovered C&D waste was recycled;
of demolition, wood, concrete and drywall are the largest almost none was composted, as only the wood waste
components of residential demolition debris while con- component of the C&D stream is compostable. Simi-
crete and mixed rubble comprise the largest share of larly, virtually all C&D disposal was via landfill and
nonresidential demolition debris.18 very little was incinerated, though small amounts of
recovered wood and other high-BTU materials were
Given the various state-level definitions for which ma- used in industrial boilers.
terials are included in the C&D waste stream and the
Figure 4
wide range of reporting methods, it is not surprising
that there is no widely accepted standard source for U.S. C&D Management, 2008
(1000 tons)
national C&D composition data. For the purposes of
the current analysis, C&D waste composition is based
on estimates developed by U.S. EPA for building-re-
lated C&D.19
Diversion rates for specific materials found in C&D 124,812
53,414
are not provided by EPA. This report estimates mate- 70%
30%
rial-specific diversion rates based on EPA’s overall
C&D diversion estimate of 30 percent20 and a variety
of other sources, including EPA’s 1998 and 2009 C&D
studies, a study for the Massachusetts Department of
Environmental Protection21 and others.22 Relatively
high diversion rates (roughly 50 percent) are assumed
for concrete and mixed rubble, bricks and metals, re- KEY Recycled Landfill
flecting the ease and cost-effective manner with which
these materials can be recycled in much of the U.S. and
their prevalence at C&D recycling facilities as reported
by various states. A summary of the base year C&D waste generation
and management situation by material type is pre-
While some wood is diverted from the C&D waste sented in Table 2.
stream, it is difficult to recycle due to contamination
by paint, preservatives or metals. Thus, some of the
recovered wood is sent to industrial boilers and co-
fired for energy production. According to U.S. EPA,
certain states count this as diverted material; others
do not.23
Drywall, asphalt roofing and plastics in the C&D
stream have had very low diversion rates, partly due to
the lack of processing-facility infrastructure that can
cost-effectively separate these materials. A very small
fraction (well under 5 percent) of drywall is recovered
due to the lack of processing capacity and markets for
16Table 2
C&D Generation and Management in the U.S. – 2008
(Thousands of Tons and Percentage of Total Generated)
MATERIALS GENERATION a DIVERTED b DISPOSED c
Total Total Diversion Rate Total Disposal Rate
Concrete & Mixed Rubble 80,202 38,497 48% 41,705 52%
Wood 44,557 6,683 15% 37,873 85%
Drywall / Gypsum 17,823 178 1% 17,644 99%
Asphalt roofing 14,258 713 5% 13,545 95%
Metals 7,129 3565 50% 3,565 50%
Bricks 7,129 3,422 48% 3,707 52%
Plastics 7,129 356 5% 6,773 95%
Total 178,226 53,414 30% 124,812 70%
Key Points Regarding 2008 C&D wood is recycled, recovery rates for drywall, roofing
Generation and Management shingles and plastics are very low.
The data above illustrates the following key points about • The 30-percent national diversion rate for C&D lags
well below what might be considered “best practice”
C&D generation and management in 2008:
in the U.S. Numerous municipalities and states have
• Two materials dominate the C&D waste stream and achieved much higher diversion rates (e.g., more than
comprise roughly 70 percent of the total 170 million tons 60 percent in Massachusetts and about 80 percent in
generated: concrete and mixed rubble (45 percent), and King County, Washington).
wood (25 percent). Drywall (10 percent) and asphalt
roofing (8 percent) are also important contributors. This profile of existing C&D generation and diversion by
• Less than a third (30 percent) of C&D debris is cur- material type is critical input for identifying the target
rently recycled or reused. Concrete and mixed rubble, materials and programs that can lead to a significantly
bricks and metals are recovered at relatively high higher diversion rate (see Section IV).
rates, around 50 percent. While roughly 15 percent of
Figure 1 Source: “Municipal Solid Waste Generation, Recycling and Disposal in the United States: Facts and Figures for 2008,” U.S. EPA, November 2009.
Figure 2 Source: “Municipal Solid Waste Generation, Recycling and Disposal in the United States, Detailed Tables and Figures for 2008,” U.S. EPA,
November 2009, Figure 26, developed by Franklin Associates.
Figure 3 Source: Based on “Municipal Solid Waste Generation, Recycling and Disposal in the United States: Facts and Figures for 2008,” U.S. EPA,
November 2009.
Figure 4 Source: Based on “Characterization of Building-Related Construction and Demolition Debris in the United States,” (p. 3-9) prepared by
Franklin Associates for U.S. EPA, June 1998.
Table 1 Source: Based on “Municipal Solid Waste Generation, Recycling and Disposal in the United States: Facts and Figures for 2008,” U.S. EPA,
November 2009. Details might not add to totals due to rounding.
Table 2 Sources: aTotal generation based on “Estimating 2003 Building-Related Construction and Demolition Materials Amounts,” U.S. EPA, March
2009, escalated by U.S. Census Bureau population growth rate from 2003 to 2008. Allocation by material based on EPA ranges reported at
www.epa.gov/epawaste/nonhaz/industrial/cd/basic.htm.
b
Overall diversion rate based on range provided in “Characterization of Building-Related Construction and Demolition Debris in the United
States,” (p. 3-9) prepared by Franklin Associates for U.S. EPA, June 1998. Diversion rates for specific materials governed by EPA’s national diversion
estimate of 30 percent and based on Tellus estimates informed by C&D diversion data from EPA, Massachusetts and other states, plus personal com-
munication with Kim Cochran, EPA Office of Resource Conservation and Recovery, 8/12/10.
c
Disposed equals generation less diversion. 17More Jobs, Less Pollution: Growing the Recycling Economy in the U.S.
III. 2030 WASTE GENERATION,
COMPOSITION & MANAGEMENT:
BASE CASE (“BUSINESS AS USUAL”) SCENARIO
The Base Case Scenario represents a “business as about 341 million in 2020 and to almost 374 mil-
usual” approach to solid waste management in which lion in 2030.
current practices and trends continue. No major new
policy interventions or lifestyle changes are introduced With constant per capita waste generation, overall Base
and most basic assumptions remain unchanged. The Case waste generation grows at the same rate as the
modest growth in the MSW diversion rate that has U.S. population. Thus, as Figure 5 shows, we project
been experienced in the U.S. over the past decade (1 that total annual generation will grow from almost 250
percent per year) is assumed to continue through 2030 million tons in 2008 to about 314 million tons in 2030.
in the Base Case Scenario. A more detailed summary of MSW Generation and
Management by material type in the Base Case Sce-
nario is included in Appendix B.
A. 2030 BASE CASE – MSW
Projected waste generation figures to the year 2030 are Figure 5
driven by two primary factors: (1) expected per capita U.S. MSW Management, 2030
waste generation, and (2) changes in U.S. population. Base Case
It is important to note that per capita waste generation (1000 tons)
is net of any source reduction that is achieved before 31,550
materials enter the MSW management system.24 While 10%
U.S. EPA estimates that source reduction increased
through the 1990s, net per capita generation has re-
mained relatively stable.
152,431 95,020
30%
(1) Projected per capita generation: According to the 49%
U.S. EPA, per capita waste generation has remained
relatively constant since 2000. Thus, for the Base
Case Scenario we have used a generation figure of
4.6 lbs per capita per day or 1,697 lbs per year25 34,55
from 2008 through 2030. This corresponds to the 11%
average per capita generation rate since 2000. Based KEY Diversion Recycled Diversion Composted
on EPA’s estimates of source reduction through Disposal Landfill Disposal Incineration
2000, this reflects a source reduction rate of about
19 percent.26
(2) Projected U.S. population: For U.S. population Given that the Base Case is defined as a “business as
projections we have used the U.S. Census Bureau’s usual” scenario, the diversion rates for each material
2008 national projections through 2050 for both and the overall diversion rate are assumed to con-
scenarios.27 These projections estimate that the U.S. tinue to grow at 1 percent per year.28 By 2030 the
population of 304 million in 2008 will grow to MSW diversion rate increases from 33.2 to 41.3
19percent. This results in total diversion of almost 130 Similar to the Base Case assumptions for diversion of
million tons of material, and total disposal of about MSW in 2030, the C&D diversion rates for each mate-
184 million tons. rial and the overall diversion rate is assumed to grow
from the 2008 level.30 As summarized in Figure 6 and
Similarly, the fraction of diverted material that is recy- Table 3, for the Base Case Scenario total C&D genera-
cled (73 percent) versus composted (27 percent) is as- tion reaches almost 219 million tons in 2030. C&D di-
sumed to be the same as in 2008. In terms of disposal, version reaches 37 percent by 2030, accounting for
the Base Case assumes that the same tonnage of mate- almost 82 million tons of C&D, while 137 million tons
rial is incinerated (about 31.5 million tons per year), continues to be disposed.
and that the additional tonnage requiring disposal is
sent to landfills. This assumption implies that what-
Figure 6
ever incineration capacity is retired over the next two
U.S. C&D Management, 2030
decades is replaced by an equal amount of capacity. It Base Case
also recognizes that fluctuations in the tonnage of (1000 tons)
MSW disposed are more likely to impact the amount
managed by landfills rather than incinerators. This is
partly due to the relative difficulty of bringing new in-
cineration capacity on line – because of siting issues,
large capital requirements and the need for long-term 1
137,119
disposal contracts – whereas expanding landfill 63%
81,586
capacity by opening new cells is comparatively “easier” 37%
and less costly.
B. 2030 BASE CASE – C&D
Similar to MSW, C&D generation in the Base Case is
assumed to grow with U.S. population over the study
period (slightly less than 1 percent per year). As de- KEY Recycled Landfill
scribed above in the discussion of C&D generation in
2008, this is likely a conservative assumption as to the
size of the C&D waste stream in 2030 and is used in The Base Case C&D waste stream profile for 2030 is
the current study for illustrative purposes.29 assumed to be the same as in 2008. It is dominated by
Table 3
C&D Generation and Management in the U.S. - 2030 Base Case
(Thousands of Tons and Percentage of Total Generated)
MATERIALS GENERATION a DIVERTED b DISPOSED c
Total Total Diversion Rate Total Disposal Rate
Concrete & Mixed Rubble 98,417 58,801 60% 39,616 40%
Wood 54,676 10,208 19% 44,468 81%
Drywall / Gypsum 21,870 272 1% 21,598 99%
Asphalt roofing 17,496 1,089 6% 16,407 94%
Metals 8,748 5,444 62% 3,304 38%
Bricks 8,748 5,227 60% 3,521 40%
Plastics 8,748 544 6% 8,204 94%
Total 218,704 81,586 37% 137,119 63%
20two materials: concrete and mixed rubble, and wood, As mentioned, this relatively low diversion rate for
which comprise 70 percent of total generation. About C&D is well below rates achieved in jurisdictions with
50 percent of concrete and mixed rubble, bricks and more effective C&D diversion programs and it con-
metals are assumed to be recovered, while diversion trasts with the rate projected to be achieved through
rates for drywall, roofing shingles and plastics remain the set of policy, regulatory and lifestyle changes in the
very low. Green Economy Scenario, described next.
Figure 5 Sources: 2030 generation based on 2008 generation from “Municipal Solid Waste Generation, Recycling and Disposal in the United States,
Detailed Tables and Figures for 2008,” U.S. EPA, November 2009, times the projected population growth rate from the U.S. Census Bureau’s “Table
1. Projections of the Population and Components of Change for the United States: 2010 to 2050 (NP2008-T1),” Release Date: August 14, 2008. Di-
version rate assumed to grow 1 percent per year from 2008 levels. No net change in waste incineration tonnage is assumed.
Figure 6 Sources: Total generation as derived from “Estimating 2003 Building-Related Construction and Demolition Materials Amounts,” U.S. EPA,
March 2009, escalated by U.S. Census Bureau population growth rate from 2003 to 2030. 2030 diversion rate based on range provided in “Charac-
terization of Building-Related Construction and Demolition Debris in the United States,” (p. 3-9) prepared by Franklin Associates for U.S. EPA,
June 1998. No change in diversion rate assumed in Base Case.
Table 3 Sources: a Total generation based on “Estimating 2003 Building-Related Construction and Demolition Materials Amounts,” U.S. EPA,
March 2009, escalated by U.S. Census Bureau population growth rate from 2003 to 2030. Allocation by material based on EPA ranges reported at
www.epa.gov/epawaste/nonhaz/industrial/cd/basic.htm.
b
Overall diversion rate based on range provided in “Characterization of Building-Related Construction and Demolition Debris in the United
States,” (p. 3-9) prepared by Franklin Associates for U.S. EPA, June 1998. Diversion rates for specific materials governed by EPA’s national diversion
estimate of 30 percent and based on Tellus estimates informed by C&D diversion data from EPA, Massachusetts and other states, plus personal com-
munication with Kim Cochran, EPA Office of Resource Conservation and Recovery, 8/12/10.
c
Disposed equals generation less diversion. 21More Jobs, Less Pollution: Growing the Recycling Economy in the U.S.
IV. 2030 WASTE GENERATION, COMPOSITION
& MANAGEMENT: THE GREEN ECONOMY
(75 PERCENT DIVERSION) SCENARIO
The Green Economy Scenario presented in this section the one adopted by San Francisco in 2009 (de-
reflects an overall waste diversion rate of 75 percent. This scribed below).
alternative scenario represents what is achievable through • Disposal bans on recyclable materials, including
implementation of a set of enhanced policy, regulatory certain unprocessed materials in the C&D waste
and lifestyle changes to achieve this level of recycling and stream, such as those in place in Massachusetts for
composting. The policies, regulations and behavior several years (described below).
changes driving this scenario are based on what are con- • Extended producer responsibility (EPR) regula-
sidered “best practices” currently in place in various juris- tions to encourage changes in product and packag-
dictions in the U.S. and abroad. ing design that reduce volume/weight and toxicity
and enhance recyclability or compostability.
While the Green Economy Scenario does not attempt • A (national) bottle bill covering not only carbon-
to provide detailed descriptions of each of the specific ated beverages such as soda and beer, but also bot-
best practices and their respective impacts on emis- tled water, sports drinks, fruit juice, teas, etc., as has
sions and jobs, examples of the kinds of policy, regula- been adopted in California, Hawaii and Maine.
tory and lifestyle initiatives that will be necessary to
achieve the level of recycling and composting in the Lifestyle Examples
Green Economy Scenario are highlighted below. In ad- • Purchasing practices that give preference to prod-
dition, detailed descriptions of three leading waste di- ucts that have less packaging and are recyclable or
version programs (Massachusetts C&D, San Francisco compostable or contain high levels of recycled
mandatory recycling and Seattle food composting) are material.
provided at the end of this section. • Conscientious participation in local recycling and
composting programs by residents and businesses.
Policy Examples
• Pay As You Throw (PAYT) programs to incentivize A. 2030 GREEN ECONOMY SCENARIO - MSW
recycling and composting, now in place in thou- The Green Economy Scenario assumes the same gen-
sands of communities throughout the U.S. eration and material composition as in the Base Case
• Resource Management Contracting to incentivize Scenario for 2030. Total generation is almost 314 mil-
commercial waste generators and their waste man- lion tons, with paper/paperboard, yard waste and food
agement contractors to reduce disposal. scraps, and plastics and metals (in order) having the
• Grants, expedited permitting and other support for largest shares. However, unlike the 41-percent diver-
the development of MSW and C&D recycling and sion rate associated with business-as-usual practices in
composting infrastructure as well as recycling- the Base Case Scenario, through implementation of a
based manufacturing. coordinated suite of policy, regulatory and lifestyle
initiatives such as summarized above, the Green
Regulatory Examples Economy Scenario achieves a 75-percent MSW di-
• Mandatory recycling and composting laws such as version rate.
23CASE STUDY:
Achieving High Rates of Construction and Demolition
Debris Recycling: The Massachusetts C&D Recycling Program
Massachusetts has implemented one of the most successful statewide construction and demolition (C&D) recycling
programs in the U.S. Informed by a broad stakeholder consultation process, the state’s Department of Environmental
Protection (MassDEP) accomplished this through a coordinated effort comprising technical assistance, market devel-
opment and a ban on unprocessed disposal of selected C&D waste materials.
In an effort to reach its goal of reducing non-municipal solid waste by 88 percent by 2010, as laid out in MassDEP’s Beyond
2000 Solid Waste Master Plan, the department instituted a disposal ban on select C&D materials in July 2006. The banned
materials are asphalt paving, brick, concrete, metal and wood. Massachusetts has the only statewide ban and regulations on
disposing unprocessed C&D waste (for specified materials) in the country. DEP estimates that in 2010, out of 3.8 million
tons of C&D debris generated, more than 3 million tons were diverted for an overall diversion rate of about 80 percent.
To develop the ban, MassDEP established a subcommittee of the agency’s Solid Waste Advisory Committee in 2001. By
2010 this subcommittee had 160 members, comprised of architects, engineers, building owners, contractors, haulers,
C&D processors, landfill owners, transfer station owners, municipalities, environmental groups and trade associations.
The subcommittee ultimately recommended a phased-in ban of the specific materials mentioned above rather than all
unprocessed C&D debris. These materials were targeted because recycling and reuse markets exist for each of them. In
addition, once the subcommittee recommended the ban, several businesses established additional facilities to recycle
and/or reuse these materials, further enhancing not only the recycling and reuse markets but also the job creation po-
tential of such a ban. Though this stakeholder process was successful, it took a considerable amount of time. From writ-
ing regulations to infrastructure and market development, it took more than four years for MassDEP to institute the ban.
To ensure the ban’s success, MassDEP provided financial and technical assistance to develop infrastructure for diversion
through reduction, reuse and recycling. As of 2010, Massachusetts had more than 15 C&D processing and/or recycling
facilities, which recover recyclable materials from mixed C&D debris for reuse, sale or further processing. Massachu-
setts also has the first gypsum recycling facility in the U.S., modeled after a successful Scandinavian program that
processes gypsum wallboard waste to produce new wallboard. The state now has one of the best C&D processing in-
frastructures in the country. Although the number of direct and indirect jobs associated with this C&D infrastructure has
not been quantified, numerous jobs are supported in operating facilities, processing materials and manufacturing prod-
ucts from recycled materials.
MassDEP reviews and approves solid waste facility waste ban compliance plans and inspects solid waste facilities to en-
sure they are in compliance with monitoring, inspections, record keeping and other facility waste ban requirements.
Businesses and municipalities that do not divert banned items from their waste run the risk of having solid waste facili-
ties reject their waste and charge additional handling fees, as well as potential enforcement penalties from MassDEP.
MassDEP has made available several case studies that demonstrate the waste diversion and economic benefits of the
ban. Clarke Corporation, a wholesale distributer of kitchen appliances, renovated and expanded its distribution center
in Milford, Mass. Ninety-eight percent of materials generated on site were recycled or reused, resulting in cost savings
of $259,043. In another case, recycling during the commercial demolition of the Massachusetts Institute of Technology
(MIT) Media Lab in Cambridge resulted in 96 percent waste reduction and cost savings of $17,684. For more informa-
tion and the C&D recycling case studies, see http://www.mass.gov/dep/recycle/reduce/managing.htm.
Sources: http://www.mass.gov/dep/recycle/priorities/08swdata.pdf, p. 10 and http://www.gypsumrecycling.us/Pages/News/6712-1-280/
24You can also read