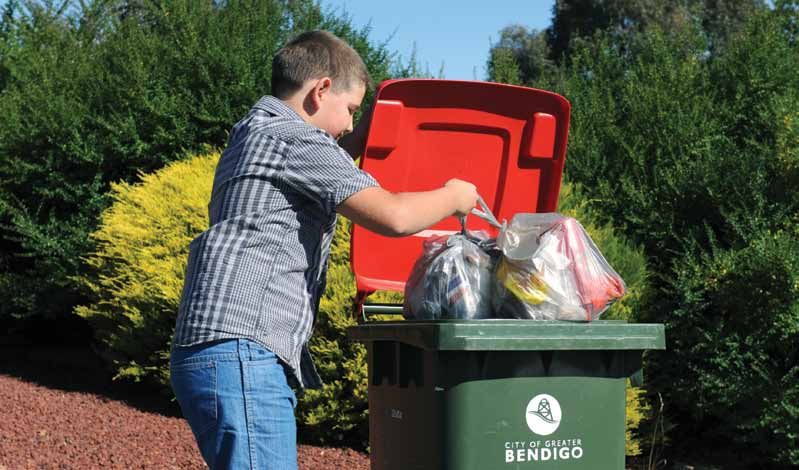
City of Greater Bendigo - Waste & Resource Management
←
→
Page content transcription
If your browser does not render page correctly, please read the page content below
City of Greater Bendigo
Waste & Resource Management
            Strategy 2014–2019
City of Greater Bendigo Waste
                                                                                       and Resources Management Strategy
                                                                                       © City of Greater Bendigo, 2014

                                                                                       City of Greater Bendigo
                                                                                       PO Box 733
                                                                                       Bendigo VIC 3552
                                                                                       T: 03 5434 6000
                                                                                       F: 03 5434 6200
                                                                                       E: info@bendigo.vic.gov.au
                                                                                          www.bendigo.vic.gov.au
                                                                                       A copy of this publication is available on
                                                                                       the City of Greater Bendigo’s website:
                                                                                       www.bendigo.vic.gov.au

Acknowledgements:                                      List of Initialisations:
Waste and Resource Management Strategy                 AWT          Alternative Waste Treatment
Steering Team: City of Greater Bendigo staff;
                                                       BAU          Business as Usual
Alex Malone, Gary Leech, Darren Fuzzard,
Neville Stewart, Ben Devanny, Ros Manning,             BPEM         Best Practice Environmental Management
Simon Clay and Robyn Major; Calder Regional
                                                       C&I          Commercial and Industrial
Waste Management Group, Peter Chudek;
Environment Protection Authority, (Phase One:          C&D          Construction and Demolition
Background paper) Paul Ratajczyk.
                                                       CDL          Container Deposit Legislation
Waste and Resource Advisory Committee:
                                                       CoGB         City of Greater Bendigo (generally referred to as “the City”)
Cr Peter Cox (Chair), Cr Barry Lyons, Cr Elise
Chapman, Jeff Cummins, Rebecca Dempsey,                DEPI         Department Environment and Primary Industries
Veronica Hall, Chris Harrington, Nicole Hood,
                                                       EPA          Environment Protection Authority Victoria
Verity Lougoon, Glenn Morrison, Danny Potter,
Brian Stanmore, Don Erskine.                           GFV          Getting Full Value – Victorian Waste
                                                                    and Resource Recovery policy
Disclaimer:                                            LGA          Local Government Area
This publication may be of assistance to you,          MRF          Materials Recovery Facility
but the City of Greater Bendigo, its employees,
                                                       MSW          Municipal Solid Waste
consultants and contractors do not guarantee
that the publication is without flaw of any kind or    PPR          Public Place Recycling
is wholly appropriate for your particular purposes
                                                       SMEs         Small to Medium Sized Enterprises
and therefore disclaims all liability for any error,
loss or other consequence which may arise from         SV           Sustainability Victoria
you relying on the information in this publication.
                                                       TS           Transfer Station
                                                       W&RMS        Waste and Resource Management Strategy
                                                       WRRG         Waste and Resource Recovery Group

Waste and Resource Management Strategy 2014–2019
Contents
1.   Executive Summary                                   2   Appendices
                                                             Appendix 1: Indicative waste cost modelling                 41
2.   Overview                                            4
                                                             Appendix 2: Specific waste streams                          42
  2.1      Introduction                                  4
  2.2      About Bendigo                                 5   Figures
  2.3      Legislation and policy                        6
                                                             Figure 1: The municipality of Greater Bendigo                5
  2.4      Stakeholder contribution
		         and strategy development                      8   Figure 2: Waste stream volumes managed
                                                                       by CoGB in 2012–13 (tonnes)                       10
3.   Waste currently managed by the City                10   Figure 3: Detailed recent domestic garbage audit results 12
     3.1   Domestic waste                               11   Figure 4: Breakdown of domestic recycling
     3.2   Recycling composition                        12             recovered at the MRF in 2011–2012                 12
     3.3   Commercial waste                             13
                                                             Figure 5: The ‘Waste Hierarchy’ – as it applies to
     3.4   Current cost of managing waste               14
                                                                       the City’s level of responsibility and control    15
4.   Drivers for Change                                 15
                                                             Tables
  4.1      Aligning with the waste hierarchy            15
  4.2      Price – a lever for change                   16   Table 1:   Municipal solid waste volumes
  4.3      Reducing greenhouse gas                      16              2011–12 and 2012–13.                             11
  4.4      Population growth, development                    Table 2:   Current Commercial & Industrial
		         & future waste projections                   17              and Construction & Demolition waste
  4.5      Land use planning for waste infrastructure   17              volumes 2011–2012 and 2012–13                    13
                                                             Table 3:   Summary of high-level modelling results          41
5.   Waste Services provided by
     the City and its partners                          18   Table 4:   Issues with ‘problem wastes’ and                 42
                                                                        potential management strategies
  5.1      Collection                                   18
  5.2      Receiving and separating waste               19
  5.3      Waste disposal                               20
  5.4      Past actions to establish a new landfill
		         or advanced waste treatment facility         21
  5.5      Managing waste into the future               22
  5.6      Education and awareness programs             27
  5.7      Advocacy and leading by example              27

6.   Managing ‘other’ waste streams                     29
     6.1 Specific waste streams                         29
     6.2 Hard waste or bulky items                      29

7.   Littering and illegal dumping                      30

8.   Implementation Plan                                31
  8.1      Avoid and minimise waste generation          31
  8.2      Reuse, recycle and recover                   34
  8.3      Infrastructure, innovation
		         and private sector waste                     36
  8.4      Littering and illegal dumping                39

                                                                        Waste and Resource Management Strategy 2014–2019 • 1
1. Executive Summary

1. Executive Summary
Greater Bendigo like many other communities across Australia          In developing this strategy significant time was invested in
is facing major challenges with the collection and disposal of        consulting with key stakeholders, businesses and the general
solid wastes. Landfills are fast running out of space and there is    community over a two year period to get their views and input
growing community concern that councils need to take a more           on what is important and valued. Utilising considerable initial
sustainable approach to the way waste is managed.                     community feedback through forums, surveys and interviews the
                                                                      City’s traditional waste services to the community were tested
In recognising this need for change the City of Greater Bendigo
                                                                      and actions identified that aim to achieve the right balance
(the City) embarked on developing this Waste and Resource
                                                                      between accessibility, affordability and sustainability.
Management Strategy (W&RMS) to provide guidance in meeting
the following objectives:                                             This strategy identifies and directly responds to those aspects
                                                                      that will make our achievements in waste and resource manage-
• Reduce waste, increase resource recovery;
                                                                      ment something we as a community can be proud of. While it
• Focus on diverting organic waste from landfill to minimise
                                                                      is clear there is still significant investigation required to provide
  current and future financial and environmental liabilities;
                                                                      explicit detail in the implementation of some of the strategies
• Provide an efficient, convenient and safe resource
                                                                      outlined in this document the key recommendations include:-
  management system for residents;
• Develop partnerships locally and throughout Victoria                • The City will introduce a solution for the food and garden
  to develop and deliver sustainable services;                          organics to reduce waste going to landfill;
• Minimise the costs and risks to ratepayers;                         • The City will introduce optional 360 litre recycling bins to
• Support innovation in resource management and                         residents wishing to increase their recycling capacity;
  look for opportunities to maximise sector development               • The City will not pursue the development of a new landfill
  in Greater Bendigo;                                                   once Eaglehawk Landfill reaches its capacity;
• Reduce the incidence of illegal dumping and littering.              • The City will commit to a powerful and targeted education
                                                                        and awareness program to support strategy initiatives;
The focus of this W&RMS is on the domestic waste stream,
                                                                      • The City will not introduce a kerbside hard waste collection
known as Municipal Solid Waste (MSW), for which the City is
                                                                        service, but will promote the range of existing enterprises
directly responsible. This Strategy also acknowledges the role
                                                                        that service this need;
the City currently occupies in the delivery of waste services to
                                                                      • The City will continue to commit to reducing littering
the business and industry sector on a commercial basis such
                                                                        and illegal dumping;
as operating a landfill.
                                                                      • The City will continue to create the opportunity for
Appropriately, legislation and policy of both a directive and           innovative responses to the management of our
coercive nature steers Councils and the community toward                waste streams.
the right balance between social, economic and environmental
objectives for waste management. The State Government’s               Creating resource streams
Getting Full Value policy on waste and resource management
                                                                      Current trends in waste management call for us to think of waste
will be particularly important in this regard.
                                                                      in terms of potential resource streams; each stream representing
Within these legislative controls however, Councils still have big    a resource input for industry or a business opportunity. The City
decisions to make based on what they believe is right for their       as the manager of municipal solid waste currently separates
community and what their community cares about. While the             and offers recyclable material for reuse, and is looking towards
municipality of Greater Bendigo is enjoying terrific success at the   separating and offering the next biggest resource stream, food
forefront of regional development in Victoria, our performance in     and garden organics.
minimising waste going to landfill has languished at close to the
                                                                      Organic material generated from the garden and kitchen makes
worst in the State for many years. Equally the amount of waste
                                                                      up approximately 50% of the residual waste stream and this
that we are generating per person is higher than our neighbours
                                                                      material could be treated to produce a useable product such
and other regional cities.
                                                                      as compost or energy.

                                                                      Improving recycling performance
                                                                      at home and in public places
                                                                      Opportunities to better capture the ‘traditional’ recyclables that
                                                                      continue to be discarded through our waste bins at home and
                                                                      in our public places are explored and actions established.

2 • Waste and Resource Management Strategy 2014–2019
1. Executive Summary

These actions will include information on how to improve our
recycling habits so we can make better use of our recycling bin
space such as crushing, folding and flattening items. However,
if lack of recycle bin space continues to be a problem residents
will be given the option of obtaining a 360 litre bin.
Public place recycling bins will be installed in high profile locations
to re-enforce the message that recycling is ‘just what we do
wherever we are’ and retail complexes will also be encouraged
to provide recycling bins for shoppers.
                                                                          Hard waste collection
No new landfill                                                           Approaches to the management of hard waste vary across
                                                                          Councils. Historically the most common being the collection
It is a primary objective of this strategy to substantially reduce
                                                                          on-mass of items from the kerbside but this has changed
the amount of waste going to landfill. The City has an obligation
                                                                          significantly due to difficulties associated with OH&S, visual
to ensure that residual municipal solid waste is disposed of
                                                                          amenity and pilfering of high value material inflating the cost of
appropriately however this does not mean that the City must
                                                                          collection. Some Councils have introduced on-call arrangements
operate a landfill.
                                                                          to counter these difficulties.
The City has been utilising a privately operated landfill over the
                                                                          In Bendigo, the Eaglehawk Eco-centre, along with various private
past twelve months at a cheaper rate than the waste can be
                                                                          sector businesses currently respond to this demand with either
dealt with at the current Eaglehawk landfill. The ongoing use
                                                                          drop-off or on-call options available. The City will encourage and
and reliance on these private sector facilities is unlikely to pose
                                                                          provide information to support the community to utilise these
a practical problem as the waste sector continues to develop
                                                                          accessible and cost effective services.
and offer a broader range of waste and resource management
services.
                                                                          Minimising littering and dumping
A plan will be developed to guide the City in withdrawing from
                                                                          Littering and illegal dumping pose a threat to wildlife and the
offering landfilling services (other than Heathcote) when Eaglehawk
                                                                          community and can lead to long-term contamination. The City
landfill reaches capacity. Concurrent to this, options for the future
                                                                          is committed to reducing the occurrence of this activity. This will
infrastructure requirements of the Eaglehawk site, to facilitate
                                                                          be achieved through a combination of education, infrastructure
ongoing resource recovery and residual waste management
                                                                          changes and compliance. The City aims to see the rate of these
will be developed.
                                                                          incidences reduce dramatically in the future.
Education and advocacy
                                                                          Addressing past legacies
Education and awareness programs, in partnership with infra-
                                                                          Historical waste management activities such as old landfills have
structure solutions, play a critical role in the bid to teach residents
                                                                          the potential to cause environmental impacts where they were not
about waste management. The City commits to delivering a
                                                                          closed and rehabilitated in a manner that would reduce rainfall
powerful and targeted program to support initiatives emanating
                                                                          infiltration or contaminate groundwater. Although the old landfills
from this Strategy.
                                                                          in the LGA were closed and rehabilitated to the standard of the
The current approach to waste education focuses on encouraging            day our collective understanding of the impacts from historical
residents to view waste as a resource and providing them with the         landfills has increased. Some of the old landfills may now require
knowledge and skills required to participate effectively in waste         further investigation and rehabilitation to minimise environmental
avoidance and resource recovery. Key initiatives include a waste          and health risks. The costs associated with rehabilitating old
services website, workshops, campaigns in local newspapers,               landfills is potentially large and needs to be well managed to
television and radio, displays and promotions for various events          reduce the financial burden to council and ratepayers.
throughout the year.
                                                                          Implementation Plan
In addition to educating the community on ways to avoid creating
waste, the City advocates for legislative changes at a National           The City has included a comprehensive Implementation Plan
and State level to improve resource recovery and reduce waste             within this Waste and Resource Management Strategy to
to landfill.                                                              ensure that the pathway to reaching the key objectives is clear
                                                                          and achievable.

                                                                                     Waste and Resource Management Strategy 2014–2019 • 3
2. Overview

              2. Overview

              2.1 Introduction
              This strategy focuses predominantly on solid, non–hazardous
              waste commonly referred to as Municipal Solid Waste (MSW),
              typically collected from households via kerbside collections as the
              City has a legislative responsibility to ensure this waste stream
              is managed on behalf of the community. For the purposes of
              this strategy it includes material from:
              •   Kerbside collections
              •   Recyclables
              •   Residual waste (garbage)
              •   Transfer stations
              •   Resource Recovery Centre (self haul or drop-off waste)
              •   Street litter (including street litter bins)
              •   Street cleansing and pit cleaning.
              •   Festivals and events
              The role of education in improving performance in waste avoid-
              ance and recycling is also considered and actions proposed. As
              well as actions to address littering and illegal dumping of waste.
              Also discussed is the City’s current and future role in relation
              to the management of commercial and industrial (C&I), and
              construction and demolition (C&D) streams. While the City has
              no legislative responsibility for these two waste streams they are
              very important to the municipality from an economic perspective.
              The City’s role in these streams is conducted from a position of
              advocacy and support for waste industry development, waste
              reduction education and awareness for business and industry,
              as well as service delivery e.g. landfill services at Eaglehawk.
              Waste generated from large businesses including C&I, and
              C&D streams are currently, in part, catered for at the Eaglehawk
              landfill. However, the appropriateness of this extending past the
              closure of that landfill is an important question that this strategy
              also addresses.

4•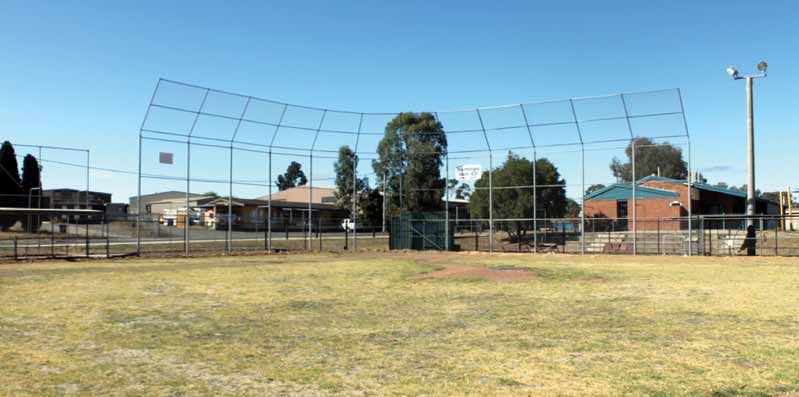
2. Overview

2.2 About Bendigo
The City of Greater Bendigo is located in north central Victoria,                  Occupying a land area of almost 300,000 hectares the munici-
approximately 150km north-west of Melbourne. CoGB is one of                        pality has an overall population density of approximately 0.3
three member councils of the Calder Regional Waste Management                      persons per hectare which is high compared to the average for
Group (RWMG). The local government area (LGA) is bounded by                        regional Victoria, although it does vary considerably across the
the Shire of Campaspe in the north, the Strathbogie and Mitchell                   municipality; from a low of 0.03 persons per hectare in Elmore,
Shires in the east, the Mount Alexander Shire in the south, and                    to a high of 15.60 persons per hectare in Strathdale.
the Loddon Shire in the west.
                                                                                   In 2011, the census indicated that there were 38,494 separate
The population of the City of Greater Bendigo as at the 30 June                    houses in the LGA, 4,520 medium density dwellings, and 7 high
2012 was 103,550 (Australian Bureau of Statistics, Estimated                       density dwellings, with 91% of these dwellings housing up to 4
Resident Population (ERP)) from this ERP, the population fore-                     residents, with 9% housing 5 or more residents.
cast for 2013 is an estimated population of 109,199 (.id (2012)
                                                                                   A map of the Greater Bendigo local government area, as shown
Community Profile). Currently experiencing a growth rate of
                                                                                   in Figure 1, also indicates the location of the City’s two landfills
approximately 1.61% per annum it is forecast that the LGA will
                                                                                   and the two waste transfer stations within the area.
see a population change, between 2013 and 2031, of 36,409
or 33.34% (.id (2012) Community Profile).

Figure 1: The municipality of Greater Bendigo

                                                                                                                            N
                                                                                                                           Legend

                                                                                                                          CoGB Boundary

                                                                                                                          Highway

                                                                                                                          Roads
                                                                             Goornong TS

                                                                                                                          Crown Land

                                                                                                                          Waste Facilities

                               Eaglehawk Landfill

                                                        Strathfieldsaye TS

                                                                                                     Heathcote Landfill

                                                                                               Waste and Resource Management Strategy 2014–2019 • 5
2. Overview

2.3 Legislation and policy                                           Policy

This Waste and Resource Management Strategy is influenced            Federal Policy
and supported by a wider strategic context and legislative and       National Waste Policy: Less waste more resources was agreed
policy environment within which the CoGB operates.                   to by all Australian environment ministers in November 2009.
                                                                     The aims of the policy are clearly described as to:
Legislation                                                            Avoid the generation of waste, reduce the amount of waste
                                                                       (including hazardous waste) for disposal, manage waste
National Legislation                                                   as a resource and ensure that waste treatment, disposal,
Product Stewardship Act 2011 provides a framework for national         recovery and re-use is undertaken in a safe, scientific and
product stewardship schemes. The ‘National Television and              environmentally sound manner, and
Computer Recycling Scheme’ introduced in 2013, in requires
                                                                       Contribute to the reduction in greenhouse gas emissions,
importers of televisions and computers to steward the material
                                                                       energy conservation and production, water efficiency, and
recovery of goods they sell.
                                                                       the productivity of the land.
Clean Energy Futures Act 2011 provides a framework for reduc-
                                                                     National Packaging Covenant (NPC): A voluntary initiative by
ing carbon pollution in Australia. The Act includes a ‘cap and
                                                                     government and industry to reduce the effects of packaging
trade’ scheme which will require emitters of greenhouse gases
                                                                     on the environment.
to acquire a permit for every tonne of carbon dioxide equivalent
(CO2-e) they emit over specified thresholds. Implications of the
                                                                     State Policy
Act are relevant to the management of landfills.
                                                                     Getting Full Value (GFV) – Victorian Waste and Resource Recovery
                                                                     Policy: The Victorian government is primarily responsible for set-
State Legislation
                                                                     ting the policy and regulatory framework within which Victorian
Local Government Act 1989 assigns responsibility for providing
                                                                     councils must deliver waste services. The current Victorian
(either directly or through contractors) collection, transport and
                                                                     Waste and Resource Recovery Policy – Getting Full Value, was
reprocessing or disposal to landfill of municipal solid waste for
                                                                     released in April 2013 replacing the Towards Zero Waste policy
their communities. (This does not require local government to
                                                                     adopted in 2005.
manage disposal facilities such as landfills)
                                                                     The 30 year vision for waste management in Getting Full Value is:
Environment Protection Act 1970 stipulates responsibilities
in relation to waste disposal, in particular the management            “Victoria has an integrated, state-wide waste management
and operation of landfill sites and the rehabilitation of closed       and resource recovery system that provides an essential
landfill sites (including those managed by previous councils).         community service by protecting the environment and
The Environment Protection Act also underpins the application          public health, maximising the productive value of resources,
of a Landfill levy and how and to whom, the revenue from the           and minimising long term costs to households, industry
levy will be allocated.                                                and government.”
The Public Health and Wellbeing Act 2008 requires Councils to        The state policy features six major goals:
ensure the municipal environment is maintained in a clean and
                                                                     1. Help Victorians reduce the waste they generate and save
sanitary condition.
                                                                        Victorians’ money through efficient use of resources.
                                                                     2. Facilitate strong markets for recovered resources.
                                                                     3. Have a Victorian waste and resource recovery system that
                                                                        maximises the economic value of waste.
                                                                     4. Reduce the environmental and public health risks of waste.
                                                                     5. Reduce illegal dumping and littering.
                                                                     6. Reform and strengthen the way institutions work and are
                                                                        governed to effectively implement waste policy.

6 • Waste and Resource Management Strategy 2014–2019
Getting Full Value supports the development of an integrated         The Plan will also provide strategic direction for waste and resource
system of waste infrastructure to cater for the range and variety    recovery planning for the next 30 years with an immediate focus
of waste materials generated across the state, from both             on the next five years. It will provide direction to the develop-
households and businesses. The system described in the               ment of both the metropolitan and regional waste and resource
policy involves waste facilities, such as large transfer stations,   recovery plans to ensure a consistent integrated approach across
landfills and materials recovery facilities, as hubs connected by    all levels of planning. This will ensure that planning at state and
transport and collection routes (spokes). The State Government       regional levels are actively integrated, aligning state directions
has committed in the GFV to working with local government            with regional priorities.
and industry investors to plan for infrastructure and logistics to
                                                                     Victorian Litter Strategy – Creating Cleaner, Safer Places: Strategy
support this connected ‘hub and spoke’ network.
                                                                     to prevent litter and improve litter management practices to
There will be specific focus on investment in infrastructure         achieve clean and safe public places.
hubs that is driven by the commercial pull from markets for
recovered resources and for maximum flexibility allowing the         Regional Policy
market to adapt ‘spoke’ activities to changing waste volumes,        The state government is progressing with changes to the waste
compositions and flows that occur over time. To promote the          management groups, with the current 13 waste management
development of a cost-effective network of waste and resource        groups being amalgamated into six large regional waste and
recovery infrastructure a state-wide infrastructure plan and         resource recovery groups and one metropolitan waste and
corresponding metropolitan and regional waste and resource           resource recovery group. These changes will see the Calder
recovery plans will be developed.                                    Regional Waste Management Group (RWMG), of which Bendigo
                                                                     is currently a member, amalgamated with the Central Murray
The draft Statewide Waste and Resource Recovery Infrastruc-
                                                                     and Mildura RWMGs to form the new Loddon Mallee Waste
ture Plan (SWRRIP) which was released in September 2013
                                                                     and Resource Recovery Group (WRRG) which will extend
provides an evidence base to inform planning and investment
                                                                     from Macedon Ranges to Mildura and comprise eight member
to achieve the vision outlined in Getting Full Value. The plan,
                                                                     councils. The role of the new waste and resource recovery
when completed, will:
                                                                     groups will be expanded to include planning for all solid waste
• Provide an analysis of current and anticipated trends in           streams, (i.e. commercial and industrial (C&I) and construction
  waste generation, composition and levels of resource               and demolition(C&D)) rather than just municipal waste. This
  recovery.                                                          planning will need to be consistent with any statewide strategies
• Provide an analysis of the existing infrastructure for waste       developed by Sustainability Victoria. In addition the new groups
  management and resource recovery as well as anticipating           will be required to develop Waste and Resource Recovery Plans
  future processing needs.                                           which are consistent with the SWRRIP.
• Investigate opportunities for colocation of new waste and
                                                                     Although the CoGB does not plan directly for the management of
  resource recovery infrastructure with similar activities such
                                                                     C&I and C&D waste streams (other than through management of
  as waste water treatment.
                                                                     its own landfills) it will make a contribution to planning all waste
• Consider the transport impacts arising from the movement
                                                                     management and resource recovery infrastructure through its
  of waste and materials.
                                                                     role in the new Loddon Mallee WRRG.
• Provide information regarding key infrastructure that
  requires protection from encroachment.                             The SWRRIP identifies the following significant infrastructure
• Provide clear guidance to local governments and waste              and issues for the Bendigo region:
  management groups.
                                                                     • The Eaglehawk landfill precinct is identified as a significant
• Provide an evidence base for future targeting of
                                                                       regional infrastructure hub because of associated C&D
  government funding and investments.
                                                                       reprocessing and potential for the landfill site to be used
The SWIRRP is expected to be finalised in 2014.                        as a site for additional resource recovery operations,
                                                                       which should be protected from encroachment through
                                                                       appropriate land use planning
                                                                     • A potential opportunity to increase the recovery of garden
                                                                       organics across Ballarat, Bendigo and Geelong
                                                                     • Addition resource recovery infrastructure to reduce landfill
                                                                       requirements once the Eaglehawk landfill ceases operation
                                                                       as an active landfill

                                                                                 Waste and Resource Management Strategy 2014–2019 • 7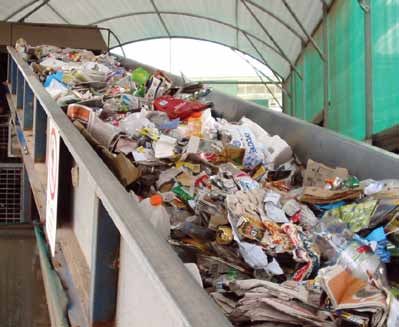
2. Overview

Local Policy                                                         Future Directions
The CoGB Waste and Resource Management Strategy align with,
                                                                     It became apparent through community and industry consulta-
and build on, existing Council plans, policies and strategies that
                                                                     tion that there is a strong desire to drive a change in community
may be directly or indirectly relevant to waste management issues.
                                                                     thinking away from that of waste management, to one of resource
Relevant policies include:                                           management. This change would help community (industry, busi-
                                                                     ness and individuals) understand their role in managing available
• The CoGB Council Plan update 2013 – 2017
                                                                     resources wisely. As reducing the demand for new resources by
• Litter Bin Strategy, 2007
                                                                     using less material through improved product design, reduced
• Environment Local Law (Local Law 3) Section 11:
                                                                     packaging, reuse of items, use of recycled material, and the
  Domestic Waste and Section 12: Trade Waste and Waste
                                                                     separation or by reclaiming materials for further processing, all
  Hoppers
                                                                     result in increased productivity.
• Natural Environment Strategy
• Carbon Management Plan                                             To encapsulate this drive for change the following statement of
• Economic Development Strategy                                      intent has been developed:
The City of Greater Bendigo Council Plan 2013–2017 contains            Increase prosperity and protect the environment by
Strategic Outcomes and Actions which are directly relevant to          maximising our resource recovery and reducing our waste.
the provision of waste services:
                                                                     Guiding principles
Sustainability
                                                                     The following 10 principles were also developed to guide decision
• Reduce all waste to landfill and make productive use of
                                                                     making in this strategy:
  by-products.
• Commence implementation of agreed priorities in the                1. Minimise waste: Follow the waste hierarchy.
  Waste & Resources Management Strategy encompassing:
                                                                     2. Maximise benefits: Reclaim resources,
  reducing resource consumption, a local landfill decision,
                                                                        waste sector development.
  reducing waste to landfill and increasing resource recovery.
                                                                     3. Sustainability: Environment protected,
Container Deposit Legislation (CDL)                                     public health and wellbeing maintained.
In 2009 the Greater Bendigo City Council resolved to support
                                                                     4. Shared responsibility: Community participation,
the introduction of a Container Deposit Scheme in Victoria and
                                                                        education, behaviour change.
throughout Australia and advocate to State and Federal Ministers
about demonstrating the financial, social and environmental          5. Equity: Fair, affordable, accessible.
benefits and actively promote the issue in the community.
                                                                     6. Collaboration: Solutions beyond municipal boundaries.
                                                                     7. Best Practice: Compliant with regulation,
2.4 Stakeholder contribution                                            industry best practice.
    and strategy development                                         8. Accountability: Progress and outcomes
                                                                        measured and reported.
To develop this strategy, the City invested significant time and
                                                                     9. Financial responsibility: Full cost recovery,
resources in consulting with key stakeholders, businesses and
                                                                        user-pays, value for money.
the general community to get their views and input on what
is important and valued. In addition to the broad community          10. Innovation: Consideration of options and opportunities
consultation (including community and business surveys, listening
posts, events and the use of a range of media), specific and
comprehensive input was received from the Waste and Resource
Management Advisory Committee and the Project Steering Team
including representation from Environment Protection Authority
(EPA) and Calder Regional Waste Management Group (RWMG).

8 • Waste and Resource Management Strategy 2014–2019
Key Objectives
Putting the principles into practice the City will:
1. Reduce waste, increase resource recovery.
2. Focus on diverting organic waste from landfill to minimise current and future financial and environmental liabilities.
3. Provide an efficient, convenient and safe resource management system for residents.
4. Develop partnerships throughout Victoria to develop and deliver sustainable services.
5. Minimise the costs and risks to ratepayers
6. Support innovation in resource management and look for opportunities to maximise sector development in Greater Bendigo.
7. Reduce the incidence of illegal dumping and littering.
Measuring performance
The following actions and targets have been established to quantify achievement of the key objectives:
Actions Targets
Reduce waste collected from kerbside. Reduce average residual waste disposal from 642 kg/hh/year to
Key Objective: 1 & 2 320 kg/hh/year by 2019 based on data provided to SV for the
Local Government Annual Survey.
Increase resource recovery from waste. Improve kerbside diversion rate from 26% to 60% (weight) by 2019,
Key Objective: 1 based on data provided to SV for the Local Government Annual Survey.
Reduce the recyclables disposed of in the waste bin
from 77 kg/hh/year to 40 kg/hh/year by 2019.
Support economic development that Resource streams such as organics made
utilises waste streams as a resource. available for private sector development.
Key Objective: 4, 5, 6
Continue to provide an equitable service Maintain or improve rating for waste management in
meeting the needs of the community. annual Victorian Local Government Satisfaction Survey.
Key Objective: 3
Reduce incidence of littering Reduce number of recorded instances of illegal dumping
and illegal dumping. by 5% per year over 5 years, compared to 2013 figures.
Key Objective: 7
Waste and Resource Management Strategy 2014–2019 • 93. Waste currently managed by the city
3. Waste currently managed by the City
Available data indicated that the City managed a total of 113,331 tonnes of waste and recycling across the municipality in the
2012–13 financial years. Just over half of this material (53%) was MSW with C&I waste accounting for 25% and C&D waste 14%.
While MSW flows are well understood, data on C&I waste is relatively limited. Other than the commercial waste that is received at
CoGB landfills, the City has no direct control over the flow of commercial waste. This makes it difficult to directly correlate commercial
disposal and recycling volumes with the actual amount of commercial waste generated within the municipality. The data used to
generate the chart below is based on volumes of waste received at the Eaglehawk and Heathcote landfills.
Figure 2: Waste stream volumes managed by CoGB in 2012–13 (tonnes)
Materials Tonnes
Municipal Solid Waste (MSW) 60,145
Commercial & Industrial (C&I) 28,755
Construction & Demolition (C&D) 16,077
Prescribed Industrial Waste (PIW) 4,347
Heathcote Landfill (mixed streams) 4,000
10 • Waste and Resource Management Strategy 2014–20193. Waste currently managed by the city
3.1 Domestic waste
Of the 61,145 tonnes of MSW handled by the City in 2012–13, A summary of current domestic waste flows is provided in the
approximately 35–40% was diverted from landfill through kerbside following table. It is noted that kerbside waste collection in the
recycling collections and self-haul drop-off recycling and green- municipality also includes approximately 3,000 commercial
waste services provided at the City’s transfer stations (Goornong services, of which approximately 1,300 are rural farm properties
and Strathfieldsaye) and landfills. and the remainder includes businesses and schools.
Within the municipality approximately 600 kg/household/year
of household waste and 250 kg/household/year of recyclables
is collected from the kerbside with a resource recovery rate in
2012–13 of 25.8% (accounting for contamination in recyclables).
This represents no significant change from the 26% kerbside
diversion rate reported for the municipality in Sustainability
Victoria’s Victorian Local Government Annual Survey for the
financial year 2010–11.
Table 1: Municipal Solid Waste volumes 2011–12 and 2012–13.
Kerbside MSW (Domestic) Tonnes/year Rate Tonnes/year Rate
2011/2012 % 2012/2013 %
Kerbside Residual Waste (Garbage) collected 27,194 27,150
Kerbside Recycling collected 10,778 10,571
Total Kerbside Collected 37,972 37,715
Kerbside Recycling Contamination Rate 8.7% 7.8%
MRF Recycling rejects (contaminants) 940 831
Kerbside Diversion Rate 25.9% 25.8%
Self-haul and other municipal waste
Self-haul Residual (Garbage) 7,615 5,716
Other Council Waste (e.g. Street-cleaning) 5,365 5,105
Self-haul Recycling 6,856 7943
Self-haul Greenwaste 3,980 4043
Overall MSW Generation
Total MSW Generation 61,788 60,145
Total MSW Disposed to Landfill 40,174 37,588
Total MSW Recovered/Recycled 20,674 22,557
Overall MSW Diversion Rate 33.5% 37.5%
Waste and Resource Management Strategy 2014–2019 • 113. Waste currently managed by the city
The composition of the kerbside domestic residual waste
(garbage) stream within the municipality has been studied at
3.2 Recycling composition
regular intervals over recent years. Comprehensive kerbside
The composition of domestic recyclables was obtained from
audits were conducted in September 2011, May 2012 and June
the breakdown of materials recovered at the materials recovery
2013, providing a detailed breakdown of material types disposed
facility (MRF) based on data provided by the processor.
at the household level. The results of those detailed audits are
summarised in the following chart and provide the best available Annual data for the past three years shows that there has been
characterisation of the current waste stream. very little variation in the breakdown of the kerbside recycling
stream over this period. Paper and cardboard is by far the major
recovered component of the recyclable stream, comprising
approximately 73%, of which cardboard makes up 50%. The
Figure 3: Detailed recent domestic
detailed recycling composition for 2011–12 is presented in the
garbage audit results.
chart below. Although not presented on this graph, it should be
100% noted that contamination of the kerbside recyclables stream (by
non-recyclable materials) is estimated at over 8%.
90%
80%
Figure 4: Breakdown of domestic recycling
recovered at the MRF in 2011–2012.
70%
60%
50%
40%
30%
20%
10%
0%
September 2011 May 2012
Other (e.g. plastic film, non-recyclable Cardboard 50.7%
hard plastic and kitty litter) Paper 18.1%
Contaminated recyclables Glass - Fines 10.5%
Potentially hazardous Glass - colour 8.2%
Clothing/textile/fabric Newsprint 4.3%
Building Materials HDPE Clear 2.0%
Metal Steel - Tin plate 1.7%
Plastic PET Clear 1.5%
Glass Aluminium 1.4%
Paper LDPE Film 0.9%
Other organic Polypropylene 0.5%
Garden waste HDPE Colour 0.2%
Kitchen organics PET Colour 0.1%
PVC - Vinyl 0.0%
12 • Waste and Resource Management Strategy 2014–20193. Waste currently managed by the city
3.3 Commercial waste
Data available to CoGB on waste generation for commercial streams (i.e. all streams other than MSW) is limited to that which is
processed through the City’s waste facilities as follows:
Table 2: Current Commercial & Industrial and Construction & Demolition waste volumes 2011–2012 and 2012–13
Tonnes/year Tonnes/year
Waste Stream Category
2011/2012 2012/2013
C&I Waste
CoGB Commercial Kerbside Collection *2,192 *2,293
Commercial (self-hauled / private collectors) 23,798 26,462
Total Generation **25,990 **28,755
C&D Waste
Waste to landfill 9,386 3,733
Recovery (Industrial Recycling) 629 591
Recovery (concrete / cover / fill) 11,885 11,753
Total Generation 21,900 16,077 * Waste collected
from commercial area.
Other Waste ** Of this volume, approximately
Heathcote Landfill 4,000 4,000 600 tonnes of C&I is
diverted from landfill
Prescribed Industrial Waste (PIW) 315 4,347 via existing processes.
Waste and Resource Management Strategy 2014–2019 • 133. Waste currently managed by the city
3.4 Current cost of managing waste
The total expenditure by the City on waste management services While funds are being accumulated to help respond to the
in the 2012–2013 financial year was approximately $16.15M. rehabilitation obligations of the City, particularly for the White
Revenue of approximately $16.5M was recouped; gate fees Hills and Eaglehawk landfill sites, the extent of work required
($5,360,000), municipal garbage charge ($8,313,000) and and the timeframe for this to occur is unknown. However, it is
recycling charges ($2,668,000). The remaining income is stored now apparent that historical contributions to this fund will not
in a waste reserve that funds future capital expenditure such be adequate to cover the estimated cost of remediation to
as new kerbside bins, landfill cell development, capping and today’s standards. In addition, the City has identified a further
rehabilitation. 21 sites that are known to have been used for the disposal of
waste materials. Most of these sites have been rehabilitated
Of the $16.15M spent on waste services in 2012/13, $1.73M
to the standards relevant at the time and many are now used
was used for street sweeping and pit/drain cleaning, $137,000
for other purposes such as sports fields. However, the City still
for operation of transfer stations and approximately $4.14M
retains a liability for restitution of any of these sites that prove
was for the kerbside recycling and garbage collection services.
to be detrimental to human health or an environmental risk into
Expenditure of approximately $9M occurred in the operation of the future.
the Eaglehawk and Heathcote landfills. With waste managed
primarily on a cost recovery basis, all costs associated with landfill
management, operation and development are built into the fee
structure and the gate fee allowing such costs to be recouped.
Currently the landfill operation expenses also include payments
covering the price on carbon (payable on waste disposed at
Patho Landfill), the landfill levy and GST. The increasing landfill
levy payable on each tonne of waste deposited is a major
contributor to the continual increase in fees. For every tonne of
waste deposited in Eaglehawk landfill, the City currently collects
on behalf of the Federal and State Governments approximately
$86 in levies and fees; this represents more than fifty percent
of the landfill gate fee and totals more than four millions dollars
each year.
Albert Roy Reserve developed on the
site of a rehabilitated former landfill.
14 • Waste and Resource Management Strategy 2014–20194. Drivers for Change
4. Drivers for Change
4.1 Aligning with the waste hierarchy
The concept of a ‘waste hierarchy’, ranking ways of dealing with waste in order of preference, has been almost universally adopted
as a guiding management principle by governments in Australia and internationally. The waste hierarchy sees avoiding the creation
of waste as the most desired outcome, and landfill disposal the least desired outcome.
Figure 5: The ‘Waste Hierarchy’ – as it applies to the City’s level of responsibility and control
AVOID & The City cannot directly control what items householders buy and dispose of
but can provide education to encourage steps that reduce the creation of
MINIMISE waste and put in place systems and process to minimise waste to landfill.
The reuse of materials that would otherwise end up in the waste stream can
REUSE provide a variety of social and environmental benefits. e.g. the City can
support community-based reuse organisations.
Kerbside recycling services provided by the City and some other local recycling
RECYCLE activities are a key way of reducing the economic and environmental impacts of
managing waste, while also supporting local employment.
Thermal treatment (Energy from Waste) technology is only in the early stages of
ENERGY development in Victoria but offers potential to reduce disposal rates in the future by
RECOVERY recovering energy resources from materials that would otherwise be landfilled.
While disposal is the least preferred option, there will probably always be some residual
DISPOSE and/or hazardous wastes for which landfilling remains the best (or only) option. It is critically
important for the City to maintain cost effective access to a landfill in the foreseeable future.
The City cannot directly control what items householders buy and dispose of
MINIMISE but can provide education to encourage steps that reduce the creation of
waste and put in place systems and process to minimise waste to landfill.
The reuse of materials that would otherwise end up in the waste stream can
REUSE provide a variety of social and environmental benefits. E.g. the city can
support community-based reuse organisations.
Kerbside recycling services provided by the City and some other local
RECYCLE recycling activities are a Waste
key way
andofResource
reducingManagement
the economic and environmental
Strategy
impacts of managing waste, while also supporting local employment.
2014–2019 • 154. Drivers for Change
Landfill development and replacement: In 2010 EPA Victoria
4.2 Price – a lever for change reviewed the Landfill Best Practice Environmental Manage-
ment (BPEM) standards for all licensed landfills in Victoria. The
There are several factors that influence the cost of waste manage-
review incorporated the latest technology and understanding of
ment. At times Federal and State governments use pricing as
sound environmental landfill management and also a number
a mechanism to influence change or introduce more stringent
of recommendations of the Victorian Ombudsmans report
regulation to achieve a desired environmental or social outcome.
Brookland Greens Estate — Investigation into Methane Gas;
These levers result in an increase in the cost of managing waste
a direct result of the investigation into the Cranbourne landfill
which in turn drives the development of alternative and often
failure. The changes to the BPEM have significantly increased the
innovative solutions.
difficulty and expense of developing new landfills and expanding
Approximately $86 out of the $148/tonne gate fee charged existing ones.
at Eaglehawk and Heathcote Landfills goes to the State and
Federal Governments in fees and levies.
4.3 Reducing greenhouse gas
Significant price drivers influencing landfill gate price:
The City in 2009 adopted its first Carbon Management Plan
Landfill Levy: The Victorian Government applies a levy on every
which aims to comprehensively quantify and manage the
tonne of waste disposed in landfills in order to encourage greater
organisation’s greenhouse emission profile as a result of the
resource recovery. The levy is set to increase by approximately
operations and services it delivers to the community (including
10% each year until 2015. A portion of the monies raised is
landfill), and to work towards meeting any obligations the City
returned as grants to local governments through Sustainability
may have under a legislative approach. In 2011 the City adopted
Victoria.
a target of reducing carbon (greenhouse gas) emissions from its
Carbon Liability: The Federal Government’s Carbon Pricing own operations to 50% below 2011 levels by 2020. Reducing
Mechanism applies to landfills emitting more than 25,000t CO2e waste related emissions will significantly contribute to achieving
per annum. As waste disposed today can continue to produce this target.
greenhouse emissions over several decades, future carbon
A range of potential sources of greenhouse gas emissions are
price risks for landfills can be high, and are difficult to manage.
associated with waste and recycling activities from fuel used in
At the time of finalising this document the Federal Government
collection vehicles through to processing and disposal emissions.
has foreshadowed but not passed legislation to repeal the Clean
By far the greatest greenhouse impacts are associated with
Energy Futures Act 2011 which is the framework for the Carbon
landfill gas generation.
Pricing Mechanism. Changes to this Act will impact on the gate
price of many landfills including Eaglehawk and Heathcote. Methane gas (CH4) with a global warming potential of 21 times
greater than carbon dioxide (CO2) is produced when waste
Landfill Management: While disposal of materials to landfill is
breaks down in the anaerobic conditions of a landfill. Landfill
the least preferred management option for waste, landfills will
gas is responsible for nearly 3% of Australia’s total greenhouse
continue to be required to manage those wastes that cannot
gas emissions profile and is usually one of the largest sources
be practically removed from the waste stream. Today’s landfills
of council-generated greenhouse emissions.
must not leave an unacceptable environmental legacy for future
generations to address. Community expectation and increased The amount of landfill gas generated depends on the type of
environmental concern has lead to more stringent requirements waste buried and conditions within the specific landfill. Waste
for landfill management that has significantly increased the cost streams with more biodegradable content (such as paper, food
of monitoring and maintaining all licensed landfills. or garden waste) generate more landfill gas. Based on ‘average’
compositions, the National Greenhouse Accounts (NGA) Factors
(July 2012) specifies lifetime emission factors for each waste
stream. These lifetime emissions occur over a period of many
years as waste can take several decades to fully break down
and is one of the key reasons why liability for landfill rehabilitation
can span decades.
16 • Waste and Resource Management Strategy 2014–20194. Drivers for Change
Existing kerbside recycling services are helping to reduce
greenhouse emissions in two ways;
4.5 Land use planning for
• Firstly by reducing the amount of bio-degradable waste waste infrastructure
buried in landfill (especially paper and cardboard) and;
• Secondly by returning useful materials to the productive Over the past decade planning for waste management infra-
economy; thereby reducing the demand for raw materials structure has primarily been focussed on landfills with proposed
and the energy required to make new products, e.g. sites identified in the Landfill Schedule of each Regional Waste
recycling an aluminium can saves 95% of the energy Management Plan (a requirement of the Environment Protec-
needed to manufacture a new can from virgin materials. tion Act 1970). Currently, the only site within Greater Bendigo
listed on the Calder Regional Waste Management Plan Landfill
Schedule is at Huntly, a site no longer considered appropriate
4.4 Population growth, development for landfill development.
& future waste projections In 2008 a site was purchased at Bagshot after preliminary testing
determined its suitability for landfill development. To date, no
At the time of the 2011 census the number of residential dwellings action has been taken to seek planning approval to develop the
in the municipality was estimated to be 43,926 and is anticipated site for waste disposal infrastructure.
to grow to 60,742 dwellings by 2031(.id (2012) Community
It is increasingly difficult to secure sites for waste and resource
Profile). This would require an average increase of approximately
recovery infrastructure that are readily accessible, compatible
840 new homes each year. However, the residential develop-
with neighbouring land uses and accepted by the neighbouring
ment within Greater Bendigo is currently seeing the demand for
community. The State Government policy Getting Full Value
collection services rise by approximately 1,200 households per
recognises these constraints and has committed to working with
year. As of March 2013 the City provides services to 46,616
local government to better align land use and transport planning
residential properties.
with waste management and resource recovery planning. This
Population growth has been identified as one of the biggest will be supported by ongoing reviews and amendments to the
challenges for waste management. The Victorian waste and State Planning Policy Framework, Victoria Planning Provisions,
resource recovery policy Getting Full Value states that: and planning schemes to appropriately reference and facilitate
waste and resource recovery infrastructure requirements.
• On average, each one of us generates just over two
tonnes of waste per year.
• Over the last 10 years, there has been a 29% increase in
the average amount of waste attributable to each Victorian
every year.
• Over the past decade Victoria’s annual waste generation
has increased from roughly eight million tonnes in 2000 to
12 million tonnes in 2011.
• Between 2010 and 2011 alone there was a seven per cent
increase in the total amount of waste Victoria’s system had
to handle.
• Victorian waste generation is expected to continue
increasing by around 4% per year, and may approach 17.4
million tonnes by 2022.
Using data from 2011–12 as a baseline and a business-as-usual
assumption that does not include the escalation in per person
waste creation predicted by the State, the total annual waste
generation in Bendigo could be approximately 150,000 tonnes
by 2030.
Waste and Resource Management Strategy 2014–2019 • 175. Waste services provided by the City and its partners
5. Waste Services provided by the City and its partners
The City currently provides a number of waste and resource litre bin with approximately 55% of households already taking
management services, including: kerbside garbage and recycling up this option. The garbage collection service is conducted as
collection for domestic and some commercial properties, manage- an ‘in-house’ service by the City.
ment of the Eaglehawk and Heathcote landfills, management of
The City also provides optional commercial and non-residential
transfer stations, rehabilitation of old landfills, street litter collection,
garbage collections on a ‘fee for service’ basis. Properties zoned
public place litter bins, street cleaning, drain and pit cleaning,
within the commercial business districts have the capacity to
and domestic waste education and awareness activities.
extend their weekly service to a multi-day service of one, two,
three, five or seven days a week collection.
5.1 Collection Recycling collection is currently fortnightly with a 240 litre bin size
offered. Collection of kerbside recyclables is also provided to
small and medium sized enterprises (SMEs). There are currently
Kerbside Collection – garbage and recycling
1,275 businesses that make use of this recycling service. The
Most Australian councils provide a kerbside collection service recycling collection service is provided under contract to the City.
for household garbage (usually weekly) and dry commingled
Contamination of the recycling stream with waste material, as
recyclables (usually fortnightly). The variations in collection
well as recyclable material lost to the waste stream continue to
systems and services are numerous and are usually tailored to
be problematic.
ensure a cost effective service that meets the specific needs
of the community.
Public place litter and recycling bins
Currently the City provides kerbside garbage and recyclables
collection services to over 46,600 households in all urban and The City manages and collects garbage from over 1,300 public
rural areas across the municipality with the cost of the services place litter bins within the municipality. A small number of public
recouped as ‘garbage and recycling charges’ in the annual place recycling bins (a total of nine, located at Rosalind Park,
rates process. The weekly garbage collection service offers bins the Chinese Gardens and the Queen Elizabeth Oval) are also
in two sizes; 140 and 240 litre. The 140 litre bin is offered at provided and serviced under contract to the City.
a lesser fee to encourage residents to downsize from the 240
18 • Waste and Resource Management Strategy 2014–20195. Waste services provided by the City and its partners
Other collection services
Detox Your Home –
Annual Mobile Service at Council Depot
The mobile “Detox Your Home” drop-off day held annually in
Bendigo accepts a wide range of household chemicals, including
fertilisers, solvents, acids and alkalis. This service is conducted
by Toxfree with the chemicals either recycled or destroyed in
an environmentally sound way. Sustainability Victoria coordinate
the program with advertising and site support from supporting
councils.
drumMUSTER
drumMUSTER is the national product stewardship program
for the collection and recycling of empty, cleaned, eligible and
non-returnable crop production and on-farm animal health
chemical containers. It is funded from a four cent per litre or
kilogram levy on crop production and animal health products. The
levy is initially paid to drumMUSTER by the manufacturer who
then passes the cost down the supply chain to the consumer.
The levy is used to reimburse local councils or other collection
agencies for any costs incurred.
In a bid to increase recovery rates, permanent drumMUSTER
collection points are provided at the Eaglehawk and Heathcote
Landfills and the Goornong Transfer Station. Also, a one-off
collection occurs annually (in October / November) at Elmore
and Raywood.
drumMUSTER collection points
Approximate
numbers of
5.2 Receiving and separating waste
drums collected
Transfer Stations
Eaglehawk (established July 2000) 1,400 per year
Transfer stations (TS) are sites for the sorting and temporary
Goornong (established November 2003) 800 per year collection of domestic waste and resources. There are cur-
Elmore (established November 2003) 1,500 per year rently two transfer stations in the municipality (Strathfieldsaye
and Goornong) and both are supervised and managed under
Raywood (established November 2003) 600 per year contract. A gate fee applies for waste received at the TS at the
same price structure as the Eaglehawk and Heathcote landfills
Heathcote (established 2010) 300 per year
and recyclables are received at no cost.
The waste received at the two TS is domestic waste including
hard rubbish, metals and household recyclables. (C&I and C&D
waste streams are not accepted).
Sorting of materials occurs on site, the garbage is transported
to the Eaglehawk landfill, recyclables to the materials recovery
facility (MRF), and recovered materials and saleable items go
to the Eaglehawk Eco-centre. The revenue derived from the
gate fees at the TS does not cover the cost of providing these
services. In 2011/12 there was a deficit of approximately $97,000.
However, the TS offer an important service to residents in the
surrounding area.
Waste and Resource Management Strategy 2014–2019 • 19You can also read