NEBRASKA RECYCLING STUDY - March 2015
←
→
Page content transcription
If your browser does not render page correctly, please read the page content below
NEBRASKA RECYCLING STUDY

March 2015

Study Conducted by:
University of Nebraska Public Policy Center
Joslyn Institute for Sustainable Communities
University of Nebraska – Lincoln, Bureau of Sociological Research

Contents
Executive Summary ........................................................................................................................ 4
Section 1: Study Overview and Methods...................................................................................... 10
Section 2: Innovative Practices ..................................................................................................... 16
Section 3: Estimate of Nebraska Recycling Rate ......................................................................... 23
Section 4: Gaps in Nebraska Recycling ........................................................................................ 28
Section 5: Other Issues.................................................................................................................. 40
Section 6: Economic Impact ......................................................................................................... 43
Section 8: City Clerk and County Treasurer Perspectives ............................................................ 50
Section 9: Regional Meetings and Post-Meeting Survey Results ................................................. 56
Section 10: Conclusions and Recommendations .......................................................................... 62
Appendix A: References ............................................................................................................... 66
Appendix B. Recycling Inventories .............................................................................................. 68

Nebraska Recycling Study
                                                                                                                               2|P age
This state-wide recycling study is funded by a grant from the Nebraska Department of Environmental
Quality and administered by the Nebraska State Recycling Association. Survey work, analysis and
meeting organization were conducted by University of Nebraska-Public Policy Center, UNL Bureau of
Sociological Research and the Joslyn Institute for Sustainable Communities.

Copyright ©2015 All rights reserved.

We wish to thank the following individuals on our Recycling Study Coordinating Committee for their
volunteer time and counsel:
Mark Brohman & Marilyn Tabor, Nebraska Environmental Trust
Carrie Hakenkamp & Chris Funk, WasteCap Nebraska
Jane Polson, Keep Nebraska Beautiful
Lash Chaffin, League of Nebraska Municipalities
Paul Dunn, City of Omaha
Anthony Gill, Gill Methane Plant
Gene Hanlon, City of Lincoln
Gary Kuhn, G. N. Kuhn Engineering
Deb Rost and Board Members of the Nebraska State Recycling Association

The University of Nebraska Public Policy Center provides assistance to policymakers in all three
branches of government and researchers on a wide range of public policy issues. The mission of the PPC
is to actively inform public policy by facilitating, developing, and making available objective research
and analyses of issues for elected and appointed officials; state and local agency staff; the public at large;
and others who represent policy interests.

215 Centennial Mall South, Suite 401, Lincoln, NE 68588-0228
Ph: 402-472-5678 | Fax: 402-472-5679
www.ppc.nebraska.edu

                        ®
The University of Nebraska does not discriminate based on gender, age, disability, race, color, religion,
marital status, veteran’s status, national or ethnic origin, or sexual orientation.

Nebraska Recycling Study
                                                                                                    3|P age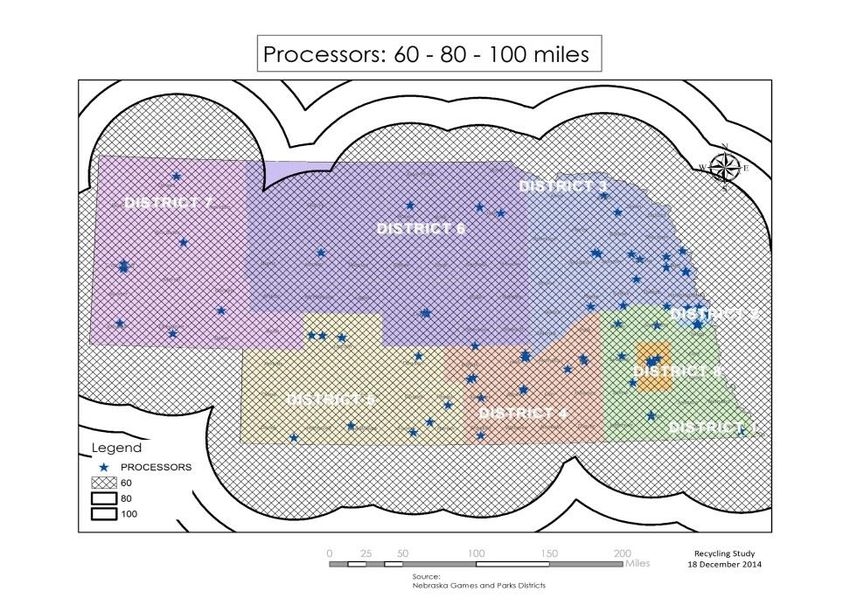
Executive Summary
Of the several methods that exist for the management of municipal solid waste—source
reduction and reuse, recycling, composting, energy recovery through thermal treatment, and
landfilling—the primary focus of this study is on end-of-life management of municipal solid
waste—recycling.

Every year, Nebraskans spend tens of millions of dollars, an estimated $33.5 million in 2013
alone, disposing of materials that could be recycled. This sum does not represent the grant funds
distributed to support recycling and waste reduction programs, but rather represents the cost of
burying recyclable materials in the landfill. The value of the material that could have been
recycled is estimated at $86.5 million based on 2013 market rates. Therefore, Nebraskans spent
approximately $33.5 million to dispose of roughly $86.5 million worth of recyclables.

In 1992, legislation was enacted requiring each solid waste jurisdiction area in the state of
Nebraska develop 20-year integrated solid waste management plans. This legislation established
voluntary waste diversion goals—25% by 1996, 40% by 1999, and by 50% by 2002—without
specifying strategies to meet these goals or a standardized means by which to measure progress.
The 20-year planning period has ended, with many of the goals unfulfilled.

This is a critical juncture for waste management and recycling in the state of Nebraska. It is time
to examine strategic planning efforts to enhance recycling services and infrastructure in the State.

The intent of this study is to better understand recycling in Nebraska at present in an effort to
inform policy decisions and to establish a baseline to measure progress in the future. This study
included 1) surveys of recyclers, city clerks and county treasurers, 2) a review of recycling
practices in other states, and 3) public forums conducted in four communities across Nebraska.

The major findings of the study are: 1) Nebraska lags in recycling compared to other states; 2)
there are significant gaps in availability and accessibility to recycling in the State; 3) there is not
currently a comprehensive plan or strategy to improve recycling in Nebraska; and 4) there are
best practices demonstrated to be effective in other locations and in Nebraska communities that
could be implemented across Nebraska, leading to reductions in waste and increases in recycling.

Findings
Through the study, it was determined that Nebraska has a recycling rate of 17.04% (17.04% of
Nebraska’s Municipal Solid Waste is recycled, while 82.96% is disposed). As shown in Figure 1,
an average of 524.7 pounds of Municipal Solid Waste is recycled for each person in Nebraska
each year, while 2554.1 pounds is disposed.

Nebraska Recycling Study
                                                                                             4|P age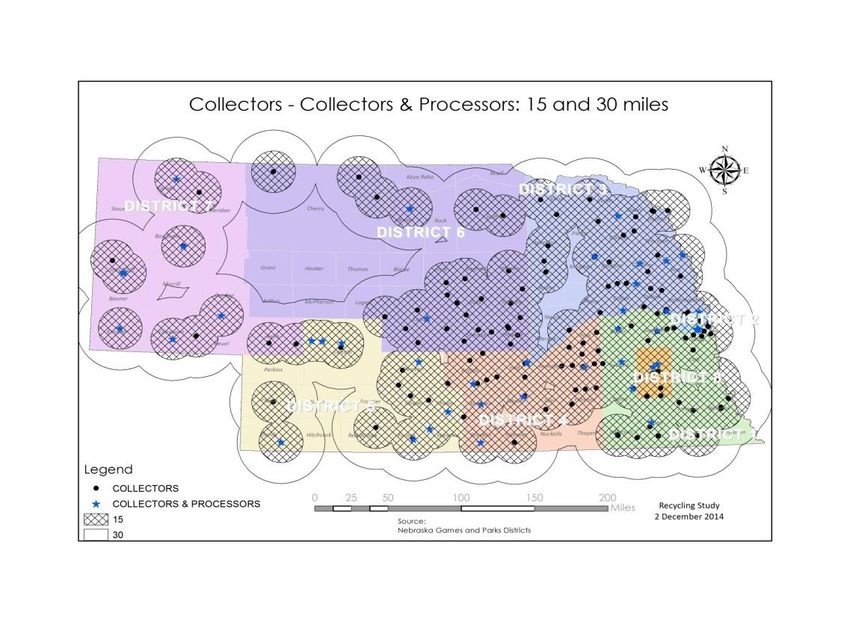
Figure 1: Pounds of Municipal Solid Waste per Person per Year

Based on estimates of recycling amounts from this study, amounts of Municipal Solid Waste
disposed estimated by the Nebraska Department of Environmental Quality, and information
obtained from surrounding states, it appears Nebraska discards more (see Figure 2) and recycles
less (see Figure 3) Municipal Solid Waste than neighboring states.

Figure 2: Pounds of Municipal Solid Waste Disposed per Person per Day by State*

*Caution is urged in comparing municipal solid waste disposal across states since states may use difference methods
for estimating amounts disposed

Nebraska Recycling Study
                                                                                                        5|P age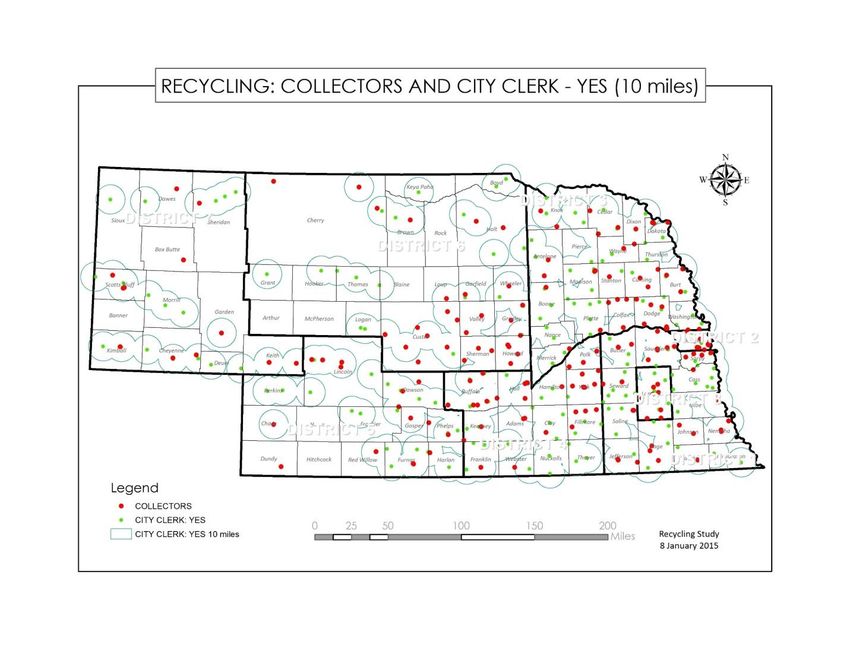
Figure 3: Recycling Rate by State*

*Caution is urged in comparing recycling rates across states since different methods may be used to calculate rates.

Recycling availability is related to population density. Nebraskans in smaller communities have
less access to recycling than do people who live in larger communities. Table 1 shows recycling
availability by City class.

Table 1: Recycling Availability by Community Size
Incorporation Class        Percent of responding communities with access to recycling
Village                                                                                                  55.2%
Second Class City                                                                                        92.4%
First Class City                                                                                         94.7%
Primary Class City                                                                                        100%
Metropolitan Class City                                                                                   100%
Total                                                                                                    66.4%

                                             Figure 4: Recycling Collection Accessibility
  The study examined the
  extent recycling collection
  is available within 15 and
  30 miles. As shown in
  Figure 4, there are areas in
  rural Nebraska, primarily in
  central and western parts of
  the State that do not have
  access to recycling
  collection within 15 and 30
  miles.

Nebraska Recycling Study
                                                                                                          6|P age
Figure 5: Recycling Processor Coverage

                                                                One of the models for
                                                                developing recycling
                                                                collaboratives is called the
                                                                Hub & Spoke Model in
                                                                which Recycling Processors
                                                                serve Collectors within a 60 –
                                                                100 mile radius. As shown in
                                                                Figure 5, Nebraska
                                                                Processors are distributed
                                                                geographically in a way that
                                                                makes this model feasible.

Figure 6: Communities with Curb-Side Pickup by Size
                                                                 One method for
                                                                 maximizing access to
                                                                 recycling is through
                                                                 curbside pickup. As
                                                                 shown in figure 6,
                                                                 curbside pickup is more
                                                                 likely to be available in
                                                                 urban communities. Rural
                                                                 communities may not have
                                                                 the level of population and
                                                                 volume of recycling to
                                                                 allow curbside pickup to
                                                                 be feasible.

The recycling industry has a significant economic impact in Nebraska. Recyclers responding to
the survey indicated they employ 2,302 employees and had a payroll of $40,457,376 in 2013.
Extending this to non-responding recyclers, it is estimated that total payroll for recycling in
Nebraska was approximately $90,000,000 in 2013. Many recyclers indicated they could expand
their recycling operations, although some indicated they would need additional resources or
partnerships to do so (see Figure 7).

Nebraska Recycling Study
                                                                                       7|P age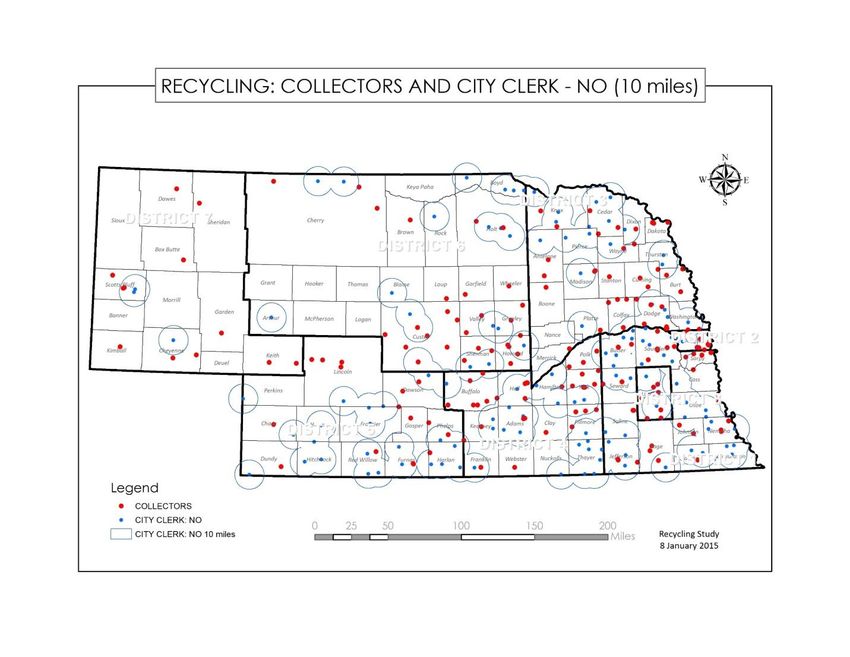
Figure 7: Ability of Recyclers to Expand
When thinking about your business’s current recycling capacity,
how able would your business be to increase capacity?
40
Number of Respondents
35
30
25
20
15
10
5
0
Not at all Slightly Somewhat Able Very able
able able able
Series1 24 27 37 31 18
Other study findings included the following:
Most communities do not calculate their recycling rate and for those that do, there are
different methods used in the calculations
Few communities have policies giving preference to the purchase of recycled materials
Few communities have recycling websites or are aware of school programs supporting
recycling, although larger communities are more likely to have recycling websites and
school recycling programs
Public officials are often unaware of the recycling services available in their communities
In rural areas, processors are more likely to receive material that is separated, while
recyclers in urban areas are more likely to receive materials that are comingled
The type of waste collection systems communities have are correlated with the existence
of recycling services in that community
o Communities with public waste collection systems and transfer stations are more
likely to have recycling in their communities
o Communities with private franchise waste collection systems are more likely to
have curbside pickup recycling services
There was widespread stakeholder support for a broad variety of strategies to enhance
recycling, although landfill bans were considered least effective
Recyclers, public officials and participants at the four regional meetings identified a number of
barriers to improving recycling in Nebraska. These barriers included the following:
Lack of statewide approach and strategies for a comprehensive materials management
approach including recycling
Lack of data and standards related to recycling in Nebraska
Lack of public support for and knowledge about recycling
Nebraska Recycling Study
8|P age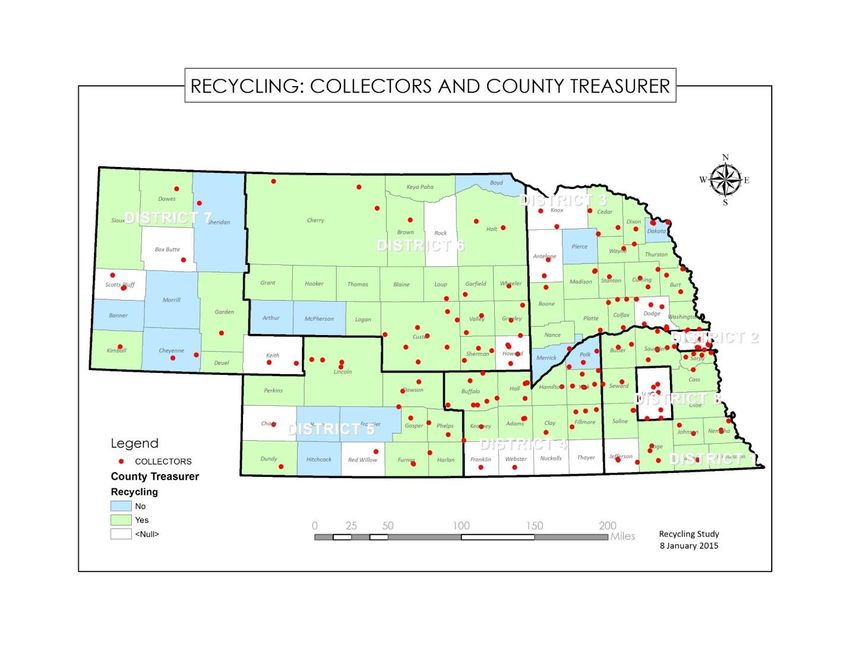
Lack of incentives for recycling
Financial challenges for recycling businesses including lack of markets, lack of
sustainable funding, the cost of transporting materials, and difficulties operating recycling
businesses in areas with low population and low volumes of materials
Additional barriers for recycling businesses included attracting qualified staff and having
resources to invest in additional space and equipment
Based on results of the study, background research on innovative practices, and ideas generated
through the surveys and regional meetings, the following strategies are recommended to improve
recycling in Nebraska:
Through State and community leadership, establish a comprehensive Zero Waste
Planning Approach including a broad based participatory process designed to reduce
waste and enhance recycling.
Develop a coordinated and comprehensive strategic plan for sustainable materials
management in Nebraska. The focus of this effort would be moving away from the
concept of seeing the waste stream as “garbage” toward seeing the waste stream as
“opportunity.”
Direct and maintain local and state resources toward sustainable Hub and Spoke systems
through local and regional public/private partnerships.
Focus developmental efforts toward communities without access to recycling collection
Work to develop product stewardship and extended producer responsibility initiatives
through public/private partnerships.
Focus on composting of food waste including promotion of on-farm composting and
provide education about the benefits for improving the productivity of soil.
Establish standard recycling measurement and reporting systems.
Develop a comprehensive strategic communications plan that includes statewide
universal labeling for recycling receptacles.
Develop comprehensive infrastructure to promote public/private partnerships in Nebraska
communities that includes sharing of best practices and technical assistance resources.
Conduct a comprehensive analysis of the social, environmental and economic costs to
waste production, collection, and disposal and an evaluation regarding how
enhancements in recycling can reduce these costs.
Examine the value of investing additional state and local public and private resources in
more sustainable materials management for the benefit of current Nebraskans and future
generations.
Nebraska Recycling Study
9|P age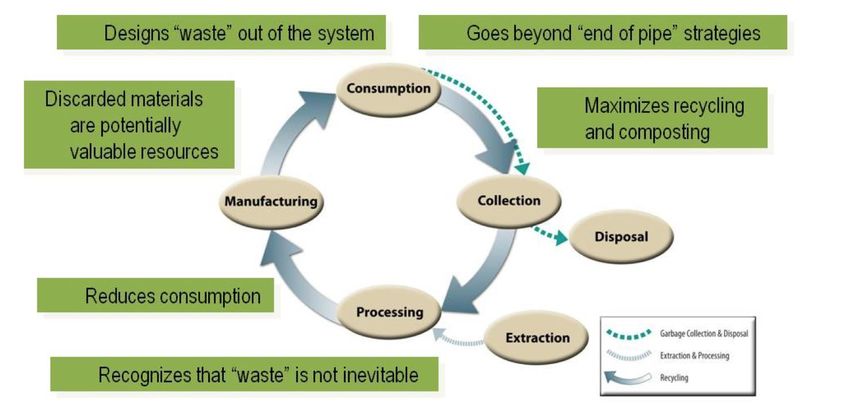
Section 1: Study Overview and Methods
                                        Background to the Study1

Nebraska has a long and rich history of recycling. There were two major recycling landmarks in
Nebraska: In 1943, the Omaha World Herald received the Pulitzer Prize for Public Service for
planning a state-wide campaign for the collection of scrap metal for the war effort. The Nebraska
plan was adopted on a national scale by the daily newspapers, resulting in a united effort that
succeeded in supplying our war industries with necessary scrap material. The second landmark
occurred in 1992, when the Nebraska legislature instituted integrated solid waste plans, which
closed open dumps and set up regional landfills. The legislation required jurisdictions to enter
into interlocal agreements to have solid waste management plans, banned certain materials from
landfills, established a $1.25 landfill surcharge, and established a grant program. This legislation
also established recycling goals and 20-year management plans.

Local recycling initiatives have been financed using a variety of means including general fund
subsidizes, landfill fees, local contributions of labor and financial donations, and grant funds
from the Nebraska Department of Environmental Quality (NDEQ) and the Nebraska
Environmental Trust (NET). The NDEQ provides almost $5 million annually to support
recycling efforts, including $1.75 million for the tire recycling fund, $1.7 million for the litter
reduction and recycling fund, and $1.5 million for the waste reduction and recycling fund. In
addition, the NET provides $1.2 million annually to recycling efforts in the state. Since 1994,
NET has distributed over $20 million; since 1998, NDEQ has distributed over $68 million to
support recycling and solid waste management and education initiatives. Yet, even with this
funding, there are areas of the state that do not have access to recycling.

A waste characterization study published in 2009 found that a significant amount of materials
being thrown away are recyclable materials (see Figure 1.1). In addition to the materials in
Figure 1.1, Electronic Waste was identified in more than 30% of sampled loads, furniture
identified in more than 60% of sampled loads, and construction and demolition debris was
identified in more than 75% of sampled loads.

1
Thanks to Gene Hanlon, City of Lincoln for compiling information for this section
Nebraska Recycling Study
                                                                                           10 | P a g e
Figure 1.1 Discarded Materials from State of Nebraska Waste Characterization Study, 2009
The 2009 waste characterization study found that half of the paper that is thrown away is
recyclable and 27% of plastic that is thrown away can be recycled. The study also found that
recyclable items made up 37.10% of all waste, accounting for 885,274 tons of material; based on
the average commodity price for recyclables in the Chicago region, the value of recyclables
thrown away was $86,528,565 (see Table 1.1). At the time, the State was paying over $33.5
million2 to dispose of $86.5 million worth of recyclables (in 2013 dollars).
2
In 2010, the average landfill disposal fee was $37.87 per ton.
Nebraska Recycling Study
11 | P a g eTable 1.1: Value of Recyclables Buried in Nebraska Landfills in 2013 Based on Annual
Average, 2013 Index Prices (2,386,183 MSW tons in 2013)
Annual Average Value of
Percent of Tons
Material Chicago Region Recyclables in
Waste* Landfilled**
Value /Ton*** Landfills
Cardboard 8.04% 191,849 $87.08 $16,706,220
Paperboard 5.30% 126,468 $42.50 $5,384,875
Office Paper 4.37% 104,276 $124.17 $12,947,975
Newsprint 4.96% 118,355 $12.92 $1,529,140
Magazines 3.85% 91,868 $42.50 $3,904,390
Plastic Ctn 1-7 7.74% 184,691 $61.67 $11,389,865
Aluminum Cans 1.20% 28,634 $1,101.67 $31,545,430
Tin Cans 1.64% 39,133 $80.00 $3,130,670
Total 37.10% 885,274 $86,528,565
*NDEQ Waster Characterization Study Consolidated Data by Weight, Table 5.10, p. 5-20, 2009
**Calculated by multiplying total MSW disposed in 2013 by percent of waste.
*** Prices based on 2013 average commodity prices for cardboard and paper index prices re based on the official
Broad Market Pulp and Paper Index, while plastic, glass and can prices are based on the Waste and Recycling
Secondary Materials Pricing Commodity Index.
It has been 20 years since Nebraska undertook a solid waste management planning effort and
established voluntary waste reduction goals. Following the passage of the Nebraska Integrated
Solid Waste Management Act in 1992, there has been no assessment on how the state is doing
relative to waste reduction and recycling and there are areas of the state that have no access to
recycling. There is no long-term comprehensive plan to ensure all residents and businesses have
access to recycling services or to direct grant agencies funding toward common goals.
A coalition representing municipalities, non-governmental agencies, and solid waste agencies
has been formed to enhance recycling by developing a plan and funding strategy so that every
Nebraska resident and business has access to recycling services. Regional meetings were held in
2011 to help identify recycling needs and barriers; recommendations from these meetings
included conducting a recycling study and hosting regional meetings to identify strategies to
meet the coalition’s goal. The current study was conducted to better understand recycling in
Nebraska Recycling Study
12 | P a g eNebraska in an effort to inform policy decisions and to establish a baseline to measure progress
in the future.
Methods
Surveys
Surveys were constructed for three respondent groups: City Clerks County Treasurers, and
Recyclers. The experience of the Bureau of Sociological Research is that, for this type of survey,
the best response rates are achieved when surveys are administered by mail. Organizations
agreeing to pilot the surveys were identified and contacted by the Nebraska State Recycling
Association. The pilot surveys were sent to these organizations. The pilot organizations were
contacted by phone and asked probing questions regarding the surveys. The surveys were revised
based on feedback from the pilots. Surveys can be found in Appendix B.
The contact lists were compiled for recyclers, city clerks and county treasurers. The Nebraska
League of Municipalities provided contact information for city clerks, developed and signed an
introductory letter for surveys to be mailed by BOSR, and sent out reminder emails. The
Nebraska Association of County Officials provided contact information for county treasurers,
developed and signed an introductory letter for surveys to be mailed by BOSR, and sent out
reminder emails. The Nebraska State Recycling Association provided an introductory letter for
recyclers and BOSR sent pre-survey emails, mail surveys, and postcard reminders. The response
rate for City Clerks was 72% (381 of 529) and 82.3% for County Treasurers (77 or 93).
The initial list consisted of about 350 recyclers that included city owned, independent
companies, and community organizations such as Boy Scouts and Girl Scouts. These lists were
compiled from the DEQ web site, Keep Nebraska Beautiful web site, the WasteCap Nebraska
Online Recycling guide, a list of grants funded by the Environmental Trust, and other recyclers
identified by the Nebraska State Recycling Association. The evaluation team worked with the
Nebraska State Recycling Association to reduce the initial list using the following decision rules:
1. Liquids (oil, antifreeze) should NOT be included.
2. Auto repair shops should NOT be included (batteries will go to scrap metal yard)
3. Auto parts stores can be included because they ship lead acid batteries to distribution
centers for recycling.
4. Auto scrap yards and demolition companies should NOT be included unless it is clear they
are just reporting tin and aluminum cans.
5. Boy scouts, girl scouts, FFA, schools or other similar organizations should NOT be on the
list unless they sort, bale, and ship recyclables to end user in addition to collection.
6. Computer repair or reuse companies should NOT be on included.
7. Primary electronic recyclers should be included (i.e. this is their main business)
8. Wooden pallet remanufacturers and wood processors should NOT be included.
9. Garbage haulers who only collect recycling should NOT be on the list (only include those
that bale and ship recyclables).
10. Large retailers that ship directly to a recycling facility will NOT be included unless they
process recycling in state.
The recycler contact list was pared down to 270 contacts. As treasurers and clerks returned
surveys with additional recycling contacts listed, those recyclers received an inventory to
Nebraska Recycling Study
13 | P a g ecomplete if they were not on our original list. These additions increased the number of recyclers
to 378. The protocol for the surveys included the following:
1. Pre-notice letter sent
2. One week later, inventory sent
3. One week later, postcard sent
4. After returns tapered down for a certain group, a phone call was made to each non-
responder. The Bureau of Sociological Research made one call that either resulted in
talking to the contact person, or a voice message was left. Additional calls were not
attempted unless a voicemail system was not available.
5. Key non-responders for the recycler’s inventory were identified and additional calls were
made to those organizations encouraging them to complete and return the inventory. An
additional 17 surveys were received through this process.
There were 178 surveys returned. The response rate for the original list of recyclers was 56.8%
and 53.6% for the original and subsequent identified lists submitted. The response rate for
recycling processors, which were used to calculate Nebraska’s recycling rate, was 69%.
Review of Recycling Practices
Total waste by region of the state was examined and analyses were conducted on per capita
differences by community population and area of the state. Best practices and recycling rates in
Midwest communities and in states with exemplary and innovative approaches were also
examined. Finally, a literature review was conducted on recommended practices and promising
models to enhance recycling. Information from this research was presented to participants at the
four regional meetings.
Regional Meetings
Regional meetings were held in four locations around the State:
City Date Location
North Platte 1-4 pm, October 23 Harbor Lights Center, 711 North Lake Road
Grand Island 1-4 pm, October 30 Grand Island Public Library,211 N. Washington
Norfolk 1-4 pm, November 12 Norfolk Arts Center, 305 North 5th Street
Omaha 1-4 pm, November 13 Abrahams Public Library, 5111 N. 90th Street
A similar format was used for each Regional Meeting:
1:00 Welcome and Introductions
1:10 Background for Recycling Study
1:20 Nebraska Recycling Inventory Results and Context
1:40 Trends and Innovations
2:00 Small Group Generation of Barriers, Opportunities and Solutions
3:00 Large Group Discussion of Solutions
3:50 Summary and Next Steps
4:00 Adjourn
Invitations were sent to a variety of stakeholders including the following:
1. Steering Committee members’ mailing lists
2. Recycler, Clerk, Treasurer Lists
3. State Senators
Nebraska Recycling Study
14 | P a g e4. NEDEV-L listserv(Nebraska Economic Development)
5. Nebraska Press Advertising Service
Stakeholders were encouraged to forward the invitation to others they believe might be interested
in attending the meetings. Number of presenters and attendees at meetings are shown in Table
1.2.
Table 1.2: Participants and Sponsors at Four Regional Meetings
Location Presenters/Sponsors Participants
North Platte 6 13
Grand Island 7 15
Norfolk 7 20
Omaha 7 29
The results of the regional meetings were analyzed qualitatively to identify themes related to
barriers, opportunities and strategies to improve recycling in Nebraska. Results can be found in
Section 3.
Post-Meeting Survey
There was an interest in perceptions regarding the potential effectiveness of strategies generated
at the regional meetings to improve recycling in Nebraska. A survey on perceived effectiveness
was sent out after the meetings to recyclers, city clerks, county treasurers, and other persons
interested in recycling including individuals who had attended the regional meeting. There were
206 valid surveys completed.
Nebraska Recycling Study
15 | P a g eSection 2: Innovative Practices
To help participants at the four regional meetings understand potential opportunities for
innovation that could be applied to Nebraska, WasteCap Nebraska and the Joslyn Institute for
Sustainable Communities identified and developed presentations on national and Nebraska
recycling models. The highlights are presented here.
The Zero Waste Community Roadmap is a two-year project funded by the Nebraska
Environmental Trust (NET) currently underway to educate public leaders on the principles of
zero waste and those policies and procedures that can be implemented to reduce waste.
WasteCap Nebraska has been working with Broken Bow, Louisville, Wayne, Imperial, and
Hastings, using a model created by EcoCycle in Boulder, Colorado (see Figure 2.1). At its core,
a Zero Waste strategy promotes elimination of the entire concept of waste, leading its
implementers to look for inefficiencies in the use of materials, energy and human resources.
Zero Waste is a goal that is ethical, economical, efficient and visionary,
to guide people in changing their lifestyles and practices to emulate
sustainable natural cycles, where all discarded materials are designed to
become resources for others to use. Zero Waste means designing and
managing products and processes to systematically avoid and eliminate
the volume and toxicity of waste and materials, conserve and recover all
resources, and not burn or bury them.
–Zero Waste International Alliance (www.zwia.org).
Figure 2.1. What is Zero Waste?
Source: City of Lincoln’s 2040 Waste Management Plan
Instead, waste should be thought of as a “residual product” or simply a “potential resource” to
counter our basic acceptance of waste as a normal course of events. Opportunities such as
Nebraska Recycling Study
16 | P a g ereduced costs, increased profits, and reduced environmental impacts are found when returning
these “residual products” or “resources” as food to either natural or industrial systems. As
described by the City of Lincoln’s 2040 Waste Management Plan and illustrated above, a Zero
Waste strategy “maximizes recycling, minimizes waste, reduces consumption and encourages the
development of products that are made to be reused, repaired or recycled back into nature or the
marketplace.”
A Zero Waste strategy can be implemented at any scale—community, business, school, home,
and events. Numerous municipalities have already enacted Zero Waste resolutions, including
Boulder County, Colorado, San Francisco, California and Austin, Texas, among others.
In 2005, the Austin city council committed the City to achieving 20 percent reduction in solid
waste disposal to landfills and incinerators by 2012, and Zero Waste to landfills and incinerators
by 2040. Zero Waste is defined as an ambitious goal to divert 90% of waste from landfills and
incinerators by 2040 using a “whole system approach to evaluate and manage the flow of solid
waste created by our communities” (City of Austin, 2005).
Government entities inspired by the Zero Waste charge must determine the right combination of
programming and policy tools to achieve the goals set forth by that policy. Although the suite of
selected strategies will vary according to the characteristics, existing infrastructure, and market
access of a given community, a Five Domains methodology—one assessing the environmental,
socio-cultural, technological, economic, and public policy conditions relevant to the scale of the
community selected—contextualizes this challenge and can serve both as a means to establish a
baseline from which to measure progress as well as a way to prioritize program and policy
selection. Five domain characteristics of a Zero Waste community include the following:
Environmental: Resource conservation and source reduction (materials, energy, and
natural resources); Geographic distribution of collection points and sanitary landfill
locations (water and air quality); Health and safety (toxicity); Recovery of organic
content (yard and food waste)
Socio-cultural: Education (awareness of public benefit and promotion of existing
services); Behavior modification for valuing waste as a utility rather than “garbage”;
Peer-to-peer learning
Technological: Compatibility and lifespan (programs and equipment); Capacity
(processing); Transportation; Product design for transfers, separations, and reuses
Economic: Economic development opportunity; Market development; Funding
mechanisms (incentives and penalties); Costs and savings to residents, businesses and
municipalities (capital investment, cooperative marketing)
Public policy: Supporting legislation; Disposal bans; Unit-based pricing (Pay-As-You-
Throw); Mandatory recycling; Goal setting; support of public, private, and non-profit
enterprises within the waste management stream; regulating the management of
construction and demolition waste
Nebraska Recycling Study
17 | P a g eUltimately, higher recovery rates will be the result of a suite of program and policy tools unique
to each community. This process is aided by recognition of the fact that there is value in the
waste stream waiting to be reclaimed. Even at the end of the useful life of goods and food, these
products have value that can be recovered. Products and their packaging can be recovered and
made into new products rather than mining virgin materials to manufacture the products.
Food scraps can be recovered and made into to compost that can be used as a soil amendment
that returns nutrients to produce more food. Instead of waste management, environmentalists
argue that policy makers should instead view waste from a materials management perspective
and develop the infrastructure to capture these products and recover the inherit value in them.
Figure 2.2 Systems-Based View of U. S. GHG Emissions (2006)
Source: U.S. EPA, “Opportunities to Reduce Greenhouse Gas Emissions through Materials and Land Management Practices,”
Figure 2.2 presents the US GHG Emissions data reported in the Inventory of US GHG Emissions
and Sinks, allocated to systems and by materials and land management.
U.S. GHG emissions in 2006 were 7,054 MMTCO2E. This converts to per capita emissions of
approximated 23 metric tons. EPA's systems inventory estimated that 42% of these emissions
are associated with the provision of goods and food (collectively referred to as materials
management).
According to the findings of the 2009 Waste Characterization Study, food waste represents more
than 16% of the waste stream in Nebraska. States and municipalities are beginning to
aggressively pursue diversion of organics, including Massachusetts, which seeks 35% diversion
of organic material by 2020, and the City of Seattle, which in 2015 instituted a new ban
prohibiting the disposal of food and food waste—enforced through fines—in an effort to meet
the city’s goal to recycle and compost 60% of its waste by the end of the year.
Nebraska Recycling Study
18 | P a g eThe Massachusetts Department of Environmental Protection Organics Study and 2013 Action
Plan targets businesses and institutions such as hotels, convention centers and supermarkets,
building on the success of a market-based initiative piloted in the 1990s responsible for
stimulating links among farmers, haulers, and commercial food generators. The On-Farm
Composting Project recruited farmers outside of major commerce centers to accept organic
materials from commercial entities, first approaching the current haulers contracted by the
farmers to facilitate connection with organics generators (BioCycle, 1998).
Here in Nebraska, WasteCap Nebraska’s Zero Waste Community Roadmap project engages its
participants at the whole community level with the goal of reaching 50% diversion within the
first four years of a 10-year plan. Elements from the Zero Waste Community Roadmap are
shared in this report to highlight strategies for implementation elsewhere in Nebraska, including:
conversion to a pay-as-you-throw refuse collection model; implementation of universal recycling
in the community, including business recycling, and; mobilizing community ambassadors. These
are a selection among many strategies a community might pursue.
Pay-As-You-Throw
Pay-As-You-Throw (PAYT) is a system for creating more equitable rates for household trash;
this system incentivizes wastes reduction and increased recycling by charging for trash services
based on the amount thrown away instead of a fixed rate. While most utilities, such as electricity,
gas and water, are charged based on the amount used, often charges for garbage collection are
based on a fixed rate—a missed opportunity to incentivize waste reduction.
Basing rates on volume is a way to incentivize conservation. There are a variety of methods that
can be employed to measure waste, including tags, pre-purchased trash bags, or varying waste
container size. According to the US EPA, over 7,100 communities nationally—about 25% of the
US population—have embraced a PAYT system, with 90-95% satisfaction rate (US, EPA, 2006).
The diversion rates of PAYT are also impressive. Pay-As-You-Throw communities generate
about 49 percent less waste per capita than those that don’t have unit based pricing (EPA, 2010).
At the state level, Minnesota has mandated that local governments charging waste generators for
solid waste collection must implement a fee structure that increases as the volume or weight of
waste collection from each generator’s residence or business increases. In both Iowa and
Wisconsin, PAYT at the local level can be required in the instance recycling goals are unmet.
Upwards of 200 communities in each state currently rely upon a PAYT waste collection system.
Sample PAYT municipal ordinance language is available; additional information on PAYT
programs can readily be found on the EPA’s website or PAYTnow.org.
Locally, communities such as Imperial and Laurel, Nebraska, with 2,091 and 957 residents
respectively, have reduced their waste generation with PAYT. Implementation of PAYT can
vary widely. In Imperial, all households pay a base service fee of seven dollars, and select their
preferred option among three measurement strategies: $2.50 for a 30-gallon bag, $7 for a sticker
to place on their 90-gallon container when ready for pick-up, or $30 a month for weekly tote pick
up. Since the PAYT system was established in 1992, the amount of municipal solid waste
Nebraska Recycling Study
19 | P a g egenerated by Imperial has decreased by approximately 40%. Equally impressive is their landfill
disposal rate of is 2 pounds per person per day compared to Nebraska’s average rate of 7 pounds
per person per day. In Laurel, residents have a choice of two plans, an $18 a month flat fee for
weekly pickup of a 90-gallon container, or a combined monthly base fee of $8 and $1 per 15-
gallon bag or $2 per 30-gallon bag. Implemented in 2006, roughly half of Laurel’s population
now opts into the PAYT program, significantly reducing waste management and transportation
expense. Recycling in the community has also increased dramatically.
Universal Recycling
Another component highlighted in the Zero Waste Community Roadmap is universal recycling.
Universal recycling means that the opportunity to recycle exists everywhere in the community—
at home, on the go, at work, and in public, generally.
Given that approximately 50% of waste stream comes from the commercial sector, it is essential
to enlist businesses in recycling. Tonnage generated from the commercial sector also helps to
support markets and infrastructure. It is approximated that on average, businesses subscribe to
30-40% more trash service than they need (EcoCycle). Waste reduction can also be tied to
purchasing habits, procurement policies at the business and local government levels complement
community wide recycling efforts. Nationally, 20% of Americans live in a community that
requires businesses to recycle (EcoCycle).
There are three means by which universal recycling can be achieved: engage city services,
amend hauler contracts, or enact ordinances. The best practices for working with haulers include
ensuring fees cover the cost of providing services (rates may need to be adjusted), building
public-private partnerships, and ensuring the initial rate is set appropriately and that risks are
shared among the stakeholders. Cities or jurisdictions can support recycling by sharing costs with
haulers, providing low-interest loans, phasing implementation, and providing grant opportunities.
Options for local regulation include: requiring trash haulers to provide recycling service
alongside trash service, have businesses submit a recycling plan with their building plan, ensure
building plans have room for recycling containers, mandate recycling policies, and ban specific
materials from landfills.
Education
Twin strategies to enhance community recycling—increase awareness of the public benefit of
recycling and promote knowledge of existing recycling services—can be achieved
simultaneously through peer-to-peer community education. Peer-to-peer community education
employs block leaders to go door to door to discuss recycling guidelines and procedures, and
collect pledges.
A door-to-door campaign launched in Longmont, Colorado is credited as essential to the
community’s successful conversion to PAYT and curbside recycling after an initial public
backlash to the implementation of these programs without first bringing the community on
board. A recycling ambassador pilot program in Alliance, Nebraska began in 2008 and is
underway in seven other cities in the US and Canada.
Nebraska Recycling Study
20 | P a g eRegionalization
Gaps in recycling processing capacity and collection sites in rural areas leave many smaller
communities without access to recycling services, resulting in a disparity among Nebraskans. As
a means to overcome this issue in rural communities, numerous state governments such as New
Mexico, Colorado, Montana, and Tennessee, are adopting a Hub and Spoke strategy to prioritize
capital investment where such gaps in infrastructure exist.
Hub and Spoke recycling is a replicable concept to consolidate marketable volumes and
overcome rural transportation issues. Described simply, the Hub and Spoke recycling model
consists of a centralized processing center for recyclables, or “hub,” where material is sorted,
baled and/or sold to market, the revenue of which supports the cost of operations. Drop-off and
recycling centers in the surrounding communities form the “spokes,” supplying the recyclables
they collect into to the main hub; strategic placement of the hub can reduce tip fees and hauling.
To ensure flow from the spokes to the hub for processing, collaborating entities typically enter
into a formal agreement.
The benefits of a Hub and Spoke system include partnerships among small communities that can
leverage greater investment from large recyclers, costs for equipment, personnel, transportation,
shared marketing costs, conservation of landfill capacity, avoided tipping fees, and increased
revenue potential.
New Mexico has developed the most comprehensive Hub and Spoke System. Beginning with a
USDA Rural Utilities Solid Waste Management Grant in 2008, New Mexico began identifying
potential hub locations in 2009. Three initiatives were established to boost recycling in these
areas. First, six new recycling processing facilities (hubs) came on line in 2011, paid for by two
different federal funding sources. Second, a marketing cooperative was launched to help
developing hubs gain fair market pricing. This cooperative will also organize “milk runs”
between processors in order to fill trucks, minimizing transport time and storage needs for
individual materials. Finally, a PAYT education campaign was launched with the goal of
establishing several pilot PAYT communities beyond the one currently in existence. Between
2007 and 2013, 115 new recycling locations have been established in New Mexico and their
recycling rates have increased by 66% (New Mexico Recycling Coalition).
The state governments of Colorado and Tennessee are currently cultivating Hub and Spoke
through targeted grant making. In 2014, Tennessee awarded $2.3 million to support
regionalization (tn.gov). Colorado recalibrated its Recycling Resources Economic Opportunity
(RREO) Fund Grant Program in 2012 to support Hub and Spoke proposals.
Another exemplary example of regionalizing recycling, distinct from the Hub and Spoke model,
is Northeast Resource Recovery Association (NRRA), an interstate marketing and purchasing
cooperative providing technical assistance, education and networking opportunities to its
member communities. Founded in 1981 as the New Hampshire Resource Recovery Association
by four New Hampshire municipalities, today the 400 plus NRRA members include
municipalities and businesses in Vermont, Massachusetts, Connecticut and Maine. NRRA
promotes member best practices through an annual award program to towns, individuals, and
schools to highlight local innovations.
Nebraska Recycling Study
21 | P a g eIn summary, innovative practices to increase community and statewide recycling include
adopting PAYT price structures for refuse service, establishing universal curbside pickup in
communities large enough to support it, leveraging the participation of the business community
to increase tonnage, and engaging in community education before, during planned change, and,
regionalizing recovery of recyclables through Hub and Spoke systems where infrastructure is
spread thin.
Nebraska Recycling Study
22 | P a g eSection 3: Estimate of Nebraska Recycling Rate
Amount of MSW Disposal in Landfills
The recycling rate is calculated by dividing the total amount of recycling by the amount of
recycling plus the amount of Municipal Solid Waste (MSW) disposed of in landfills. Estimates
for recycling were obtained through the Recycler Survey. The total Municipal Solid Waste
collected in Nebraska Landfills for 2013 was obtained from the Nebraska Department of
Environmental Quality. A caveat is that MSW collected at landfills is not all MSW generated in
Nebraska as some waste may be transported to landfills in other states. Conversely, some
Nebraska landfills receive waste from other states. The assumption is that the amount of waste
coming into the state is roughly equal to the amount leaving the State. Total MSW collected at
the 23 reporting landfills in 2013 was 2,386,183 tons. Most Construction and Demolition Waste
(C&D) is separated and disposed of in dedicated C&D landfills. However, there is some C&D
waste that cannot be separated from the MSW disposal estimates. Hence, the estimated recycling
rate will be lower than if all C&D could be excluded.
Amount of Recycling
The amount of Nebraska Recycling (including yard waste) is derived from the Recycler Survey
conducted in 2014 for calendar year 2013.
Methods and Caveats:
The response rate was 56.8%, similar to the response rate for recycling surveys in other
states; therefore, the amount of materials reported being recycled is less than the actual
amount being recycled. In addition, many of the recyclers who did return surveys were
not able to estimate amounts of material either in total or by type of recyclable material,
which lowers confidence in these estimates. The total Nebraska recycling rate estimate is
extrapolated from information obtained from the returned surveys.
To avoid duplication of the amount of recyclable materials collected, processed and
manufactured, the evaluators used only information obtained from recycling processors
to estimate total amount of MSW recycled. Some processors could not estimate amounts
for specific materials, but could give total amount of recyclables. There were 39
Nebraska processing organizations that could estimate total amount of recyclables
processed for 2013.
There may be materials in Nebraska that are transported out of state for processing; to
this extent, our estimate under-represents the amount of materials generated in Nebraska
that are recycled. The Nebraska inventory specifically asked about processed material
that was collected in Nebraska; however, some respondents may have not distinguished
between instate and out-of-state materials; to this extent, the estimate may over-represent
the amount of materials generated in Nebraska that are recycled. The assumption used for
this analysis is the amount of recyclable materials from Nebraska sent for processing in
other states roughly equals the amount of materials from other states sent to Nebraska for
processing.
To avoid double counting, the survey asked processors if they sent their materials to
another processor in Nebraska for further processing. The amount of recycled materials
processed was reduced by this overlap.
Nebraska Recycling Study
23 | P a g e Some Processors reported non-MSW such as oil and metals (other than tin or aluminum
cans). Amounts of these non-MSW materials were eliminated from processed amounts to
obtain amount of MSW recycled.
Based on survey results and reported recycling for two additional processors, the amount of
unduplicated recyclable MSW reported processed in Nebraska for 2013 was 289,436 tons.
However, the evaluation team determined that yard waste figures are substantially under-
reported because yard waste is generally managed by municipalities or solid waste agencies, not
traditional recycling processing centers. Therefore a separate calculation is used to estimate yard
waste, and yard waste is subtracted from the reported recycling processed. Survey responders
which could separate types of MSW processed reported processing 33,531 tons of yard waste. So
the estimated amount of recycled MSW processed by survey respondents excluding yard waste is
255,905 tons.
To estimate the amount of unreported recyclables processed in Nebraska, the evaluators
estimated the average amount processed by general recycling processors that provided
information (this does not include specialty processors such as scrap metal yards). To estimate
non-yard waste MSW recycled in 2013, the following methods were used:
a. The average MSW (excluding yard waste) processed by 39 reporting general processors
was 4,521 tons in 2013. However, the median amount processed per processor was 598
tons, indicating that the distribution was greatly skewed to the high end. To get a more
representative reflection of the average processor, the highest and lowest processors were
eliminated from the estimate as outliers, which gave a revised per processor estimate of
2,753 tons of recycling for 2013.
b. There were 25 identified recycling processors that did not respond to the survey and
another 17 processors who responded but did not provide information about amount of
material processed. Applying the average of 2,753 for all reporting processors, the
estimate for non-reporting processors (32 X 2,753 tons) is 88,096 tons.
c. Therefore, the total MSW recycled in Nebraska in 2013 excluding yard waste is
estimated to be (255,905 + 88,096) 344,001 tons.
To estimate yard waste, information was received from seven Nebraska communities and
estimated per capita yard waste recycling at .078224 tons per person. Applying this rate to the
state population in 2013 results in an estimated 146,163 tons of yard waste processed. Hence, the
total amount of MSW estimated to be recycled in 2013 was 490,164 tons (146,163 tons yard
waste + 344,001 tons of other MSW). The recycling rate for Nebraska is estimated at 17.04%
(490,164 tons recycled/2,876,347 tons recycled and disposed).
This rate is based on the assumption that non-reporting processors average approximately the
same annual tonnage as reporting processors. Also, as discussed above, the rate estimate for
Nebraska is based on the assumption that the amount of recyclables collected in Nebraska is
reflected in the processed tonnage (the amount of recyclable materials collected in Nebraska and
shipped to out-of-state processors is equivalent to the amount of recyclable materials collected
out-of-state and shipped to processors in Nebraska). In addition, it should be recognized that the
Nebraska rate is an estimate based on extrapolation of data collected from the survey. Other
states that have higher survey response rates may have more accurate estimates. For example,
Nebraska Recycling Study
24 | P a g estates like Montana require licensed recyclers to report volumes of recycling (although reporting
is voluntary for unlicensed recyclers); hence their estimated recycling rates are likely to be based
on more accurate and complete data.
Disposal of MSW per Person
The Nebraska population estimated for July 1, 2013 was 1,868,516. Based on the study results,
on average, the following amounts are generated per person (see Table 3.1):
Table 3.1: Amount of Municipal Solid Waste disposed of and recycled in Nebraska for 2013
Pounds Per Year Per Person Pounds Per Day Per Person
MSW in Landfills 2554.1 7.0
MSW Recycled 524.7 1.4
Total MSW 3078.8 8.4
Nebraska Rate Compared to Other States
Although it is difficult to make comparisons across states (e.g., states use different methods to
measure and estimate waste disposal; available estimates are calculated for different years, some
states include construction and demolition waste), Nebraska appears to dispose more of its
Municipal Solid Waste in Landfills than does any neighboring state (See Table 3.2).
Table 3.2: Total Tonnages of MSW Discarded Per Capita in 2013 in the State of Nebraska and
Contiguous States
State Tons MSW Population Tons Per Pounds Per
Disposal Capita/Year Capita/Day
Nebraska* 2,386,191 1,868,516 1.28 7.00
Colorado 6,537,169 5,268,367 1.24 6.80
Wyoming (2010) 609,800 563,626 1.08 5.93
Iowa* 2,622,570 3,074,186 0.85 4.67
Missouri 5,054,103 6,044,171 0.84 4.60
Kansas 2,221,916 2,893,957 0.78 4.27
South Dakota* 581,673 844,877 0.69 3.77
Note: State environmental agencies provided tons MSW disposal data. Population is according to U. S. Census Bureau.
*
State does not track C&D waste separate from MSW
Although it is difficult to compare recycling rates across states (e.g., states use different methods
for estimating municipal solid waste disposal, states have different methods and response rates
for estimating amount of Municipal Solid Waste recycled, estimates are available for different
Nebraska Recycling Study
25 | P a g eyears), Nebraska appears to recycle less of its Municipal Solid Waste than does any neighboring
state (See Table 3.3).
Table 3.3: Estimated Percent MSW Recycled in 2013 in the State of Nebraska and Contiguous
States
State MSW Generated % Recycled
Nebraska 2,876,347 17.0
Wyominga (2010) 628,500 18.5
South Dakotaa (2011) 711,378 18.5
Missourib (2011) 4,933,141 19.6
Coloradoa 8,692,117 22.8
Iowab (2011) 3,930,863 24.0
Kansasa 3,246,767 31.6
a
Recycling rates furnished by state environmental agency for the year 2013 unless indicated otherwise.
b
Shin, D. (2014). Generation and Disposition of Municipal Solid Waste (MSW) in the
United States—A National Survey.
Recycling Rate by District
The evaluation team examined recycling rates by district based on the amount of recyclable
materials processed in that district in comparison to MSW disposed of in landfills (see Table
3.4). Caution is urged in interpreting the results since materials are often transported across
district lines for processing; hence, the recycled materials processed in each district is not an
accurate reflection of the amount of recycled materials collected in that district. It is likely that
urban centers are more likely to have processors who may receive recyclables from rural areas;
hence, rural areas are likely to exhibit lower recycling rates based on this analysis. Nevertheless,
the analysis may be useful in potentially identifying areas that could use more processing
capacity. It may be that District 1 has lower processing rates than other regions because
collectors are transporting recycling to Lincoln (District 8) and Omaha (District 2) for
processing; however, Region 2 has a relatively low recycling rate as well.
Nebraska Recycling Study
26 | P a g eTable 3.4: Recycling rates by district based on recyclables processed
District Recycle Tons MSW Tons MSW
Rate Recycled Disposed
1 1.44% 11,091.43 759,349
2 14.19% 97,608.30 590,426
3 28.63% 126,471.93 315,334
4 22.87% 55,009.26 185,500
5 9.97% 16,704.70 150,864
6 48.11% 16,019.00 17,277
7 22.88% 18,064.04 60,884
8 25.61% 105,524.12 306,549
Recycling by Material
Table 3.5 shows the amount of each type of recyclable material recycled in 2013 and the per
person amount. Processor respondents to the survey were not able to distinguish 122,063.24 tons
of recycled material by type. This analysis only included Processors that completed surveys and
reported recycling amounts; therefore, recycling amounts are much lower than the total material
estimated to be recycled.
Table 3.5: Amount of Recycling by Material based on Survey Reports
LBS Per Person Per
Material Tons Recycled 2013
Year
Comingled/undifferentiated MSW 122,063.24 130.65
Cardboard and paperboard 75,787.21 81.12
Yard waste & tree trimming/wood chipping 33,531.05 35.89
Newspapers 27,217.59 29.13
Paper 21,564.57 23.08
Wood waste 9,011.89 9.65
Plastic containers 4,239.89 4.54
Electronics 3,588.57 3.84
Glass bottles and jars 3,011.01 3.22
Tin Cans 1,389.77 1.49
Food waste 1,228.80 1.32
Appliances 1,210.43 1.3
Tires 1,135.99 1.22
Aluminum cans 981.91 1.05
Textiles 583.69 0.63
Lead-acid auto batteries 294.38 0.32
Nebraska Recycling Study
27 | P a g eSection 4: Gaps in Nebraska Recycling
By Community Size
An important goal of the study was to examine differences in recycling availability by
community size. As shown in Table 4.1, recycling is related to community size. Recycling is not
as available in small communities: 55% of communities with a population of 800 or fewer
people have recycling while over 90% of communities over 800 people have recycling.
Table 4.1: Recycling Availability by Community Size (City Clerk Survey)
Number % of responding communities
Incorporation Class Population in Class
in NE with access to recycling
Village 800 or fewer 382 55.2%
Second Class City 801 to 5,000 116 92.4%
First Class City 5,001 to 100,000 30 94.7%
Primary Class City 100,001 to 300,000 1 100%
Metropolitan Class City 300,000 or more 1 100%
Total 530 66.4%
Collectors and Processors by Area of the State
To assess the geographic distribution of recycling collectors and processors across the State,
recycler survey responses were used, and, for external sources and steering committee members
identified non-responding collectors and processors. Figure 4.1 shows recycling collectors and
processors and landfills and transfer stations across Nebraska
The study assessed the availability of recycling for people in Nebraska by geographic area;
specifically, whether recycling is available within 15 and 30 miles of individuals. Figure 4.2
shows the locations of recycling collectors across Nebraska with the eight Nebraska Game and
Parks Districts. Gaps in collection are located primarily in the north central area (District 6),
parts of the panhandle (District 7), parts of southwest (District 5), and smaller areas in central
(District 4) and southeast (District 1) Nebraska.
One model for developing recycling collaboratives is the Hub and Spoke Model in which a
centralized processor receives materials from collectors within a 60-100 mile radius. Figure 4.3
shows the location of recycling processors across Nebraska with the eight Nebraska Game and
Parks Districts. Nebraska appears to have a desirable distribution of recycling processors across
the State that would be conducive to developing a Hub and Spoke Model.
An area of interest was comparing reports by County Treasurers and City Clerks to the actual
availability of recycling collection services in each of the communities. Figure 4.4 shows based
on reports from County Treasurers and City Clerks, where in the State recycling collection
services are thought to be available. Interestingly, there are some counties in which the County
Treasurer was not aware of recycling services, but City Clerks indicated collection was available
in their communities. As shown in Figure 4.5, there are a number of counties that reported they
Nebraska Recycling Study
28 | P a g eYou can also read