STATISTICAL ANALYSIS AND REVISION OF ENDANGERED KARST SPECIES DISTRIBUTION, AUSTIN AREA, TEXAS - NCKRI REPORT OF INVESTIGATION 10 - National Cave ...
←
→
Page content transcription
If your browser does not render page correctly, please read the page content below
NCKRI REPORT OF INVESTIGATION 10

 STATISTICAL ANALYSIS AND REVISION OF
ENDANGERED KARST SPECIES DISTRIBUTION,
           AUSTIN AREA, TEXAS

                  www.nckri.org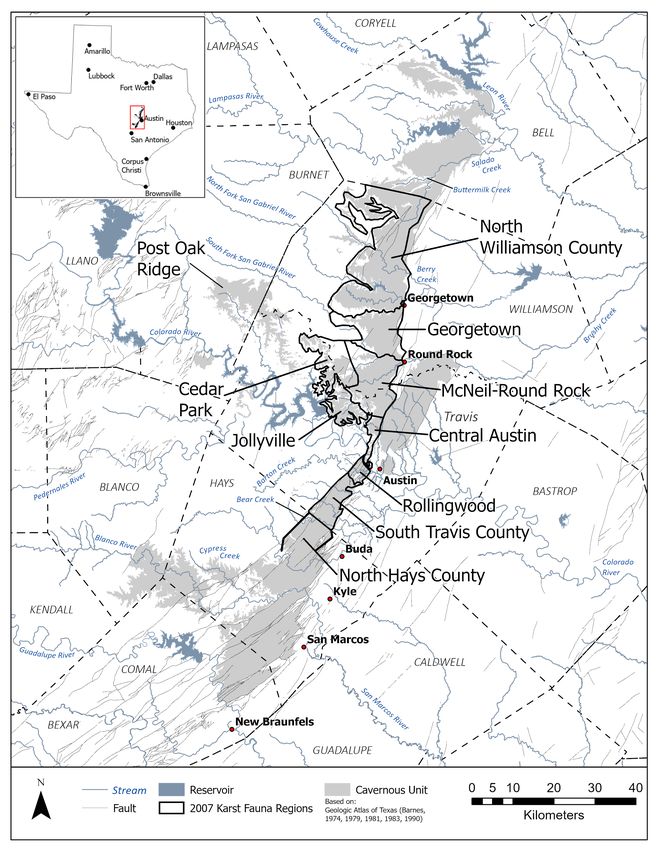
National Cave and Karst Research Institute
                   Report of Investigation 10

Statistical Analysis and Revision of Endangered
 Karst Species Distribution, Austin Area, Texas

          George Veni, PhD, and Michael Jones

        National Cave and Karst Research Institute

                          April 2021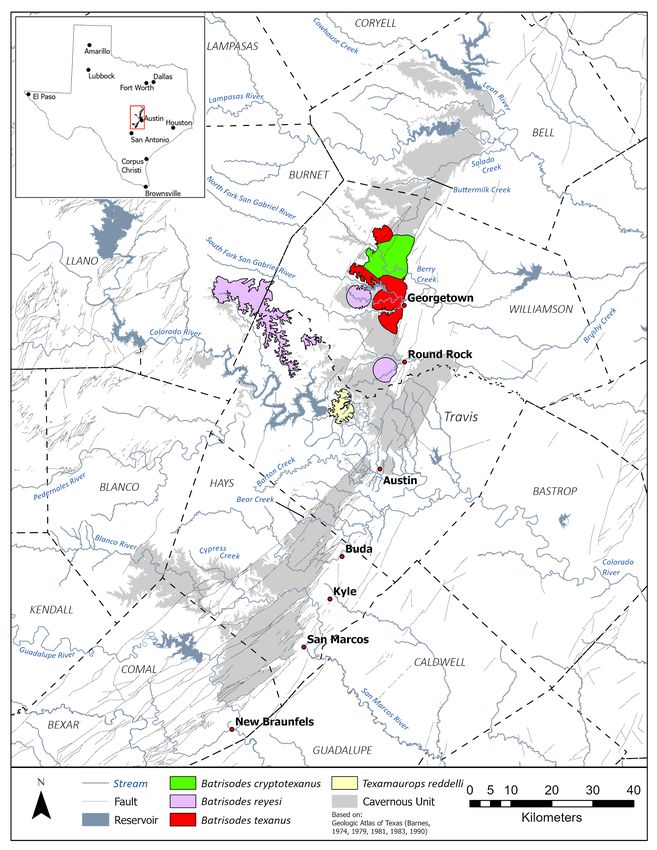
Published and distributed by
National Cave and Karst Research Institute
Dr. George Veni, Executive Director
400-1 Cascades Avenue
Carlsbad, NM 88220 USA
www.nckri.org
The citation information:
Veni G, Jones M. 2021. Statistical Analysis and Revision of Endangered Karst Species Distribution, Austin Area, Texas.
National Cave and Karst Research Institute Report of Investigation 10, Carlsbad, New Mexico.
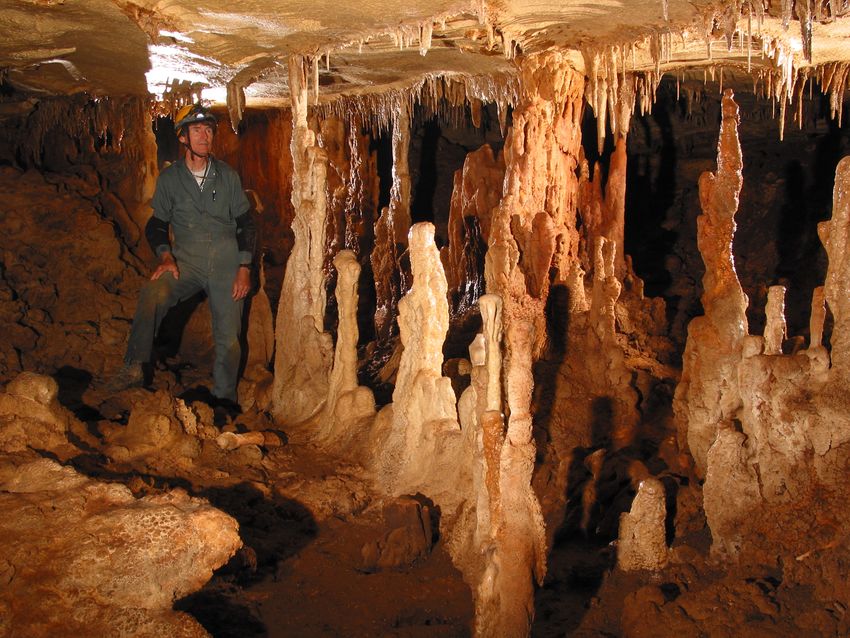
Cover photo: Orion Knox in Electro-Mag Cave, Williamson County, Texas. Discovered by a geophysical survey, this cave is one
of the more extensive and bio-diverse in the study area.
ISBN: 978-1-7333753-4-4
NCKRI Organization and Mission
NCKRI was created by the US Congress in 1998 in partnership with the State of New Mexico and the City of Carlsbad. NCKRI is
administered by the New Mexico Institute of Mining and Technology (aka New Mexico Tech or NMT).
NCKRI’s enabling legislation, the National Cave and Karst Research Institute Act of 1998, 16 USC, §4310, identifies NCKRI’s
mission as to:
1) further the science of speleology;
2) centralize and standardize speleological information;
3) foster interdisciplinary cooperation in cave and karst research programs;
4) promote public education;
5) promote national and international cooperation in protecting the environment for the benefit of cave and karst landforms;
and
6) promote and develop environmentally sound and sustainable resource management practices.
NCKRI Report of Investigation Series
NCKRI uses this report series to publish the findings of its research projects. The reports are produced on a schedule whose
frequency is determined by the timing of the investigations. This series is not limited to any topic or field of research, except that
they involve caves and/or karst. All reports in this series are open access and may be used with citation. To minimize environmental
impact, few or no copies are printed. They may be downloaded at no cost from the NCKRI website at www.nckri.org.
In accordance with the Texas Board of Professional Geoscientists rules at 22 Texas Administrative Code, Part 39, Chapter 851,
Subchapter C, §851.156, this report is signed and sealed to assure the user that the work has been performed by or directly super-
vised by the following professional geologist who takes full responsibility for this work.
The computer-generated seal appearing below was authorized by George Veni, PhD, PG 682, on 6 April 2021.
2 NATIONAL CAVE AND KARST RESEARCH INSTITUTE REPORT OF INVESTIGATION 10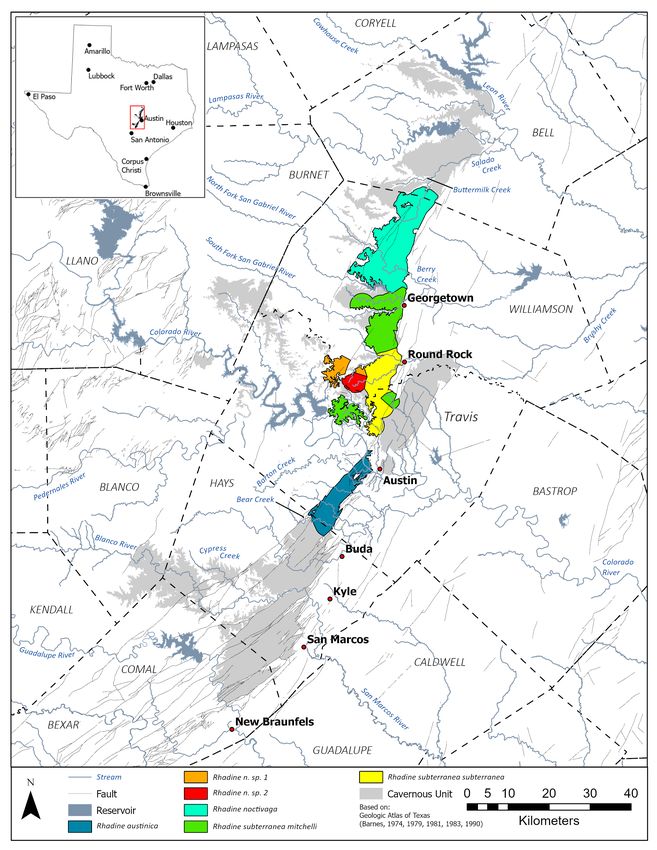
Table of Contents
Introduction................................................................................................................................................5
Methodology.............................................................................................................................................8
    Rare and Endangered Species Data Collection...............................................................................8
    Karst Fauna Region Analysis...............................................................................................................9
    Karst Zone Analysis..............................................................................................................................25
Karst Fauna Region Boundary Analysis..................................................................................................27
    North Hays County - South Travis KFR Boundary..............................................................................27
    South Travis - Rollingwood KFR Boundary.........................................................................................27
    Rollingwood - Central Austin KFR Boundary.....................................................................................28
    Central Austin - McNeil-Round Rock KFR Boundary........................................................................29
    McNeil-Round Rock - Cedar Park KFR Boundary.............................................................................31
    Cedar Park - Jollyville Plateau KFR Boundary..................................................................................32
    Cedar Park KFR Boundary..................................................................................................................33
    Cedar Park - Post Oak Ridge KFR Boundary.....................................................................................34
    McNeil-Round Rock - Georgetown KFR Boundary..........................................................................34
    Georgetown - North Williamson KFR Boundary................................................................................35
    North Williamson - Bell County KFR Boundary..................................................................................36
Karst Zone Revision...................................................................................................................................37
    Blanco-Cypress Karst Fauna Region.................................................................................................37
    Hays County Karst Fauna Region......................................................................................................37
    South Travis County Karst Fauna Region...........................................................................................37
    Rollingwood Karst Fauna Region.......................................................................................................40
    Downtown Austin Karst Fauna Region...............................................................................................40
    Central Austin Karst Fauna Region....................................................................................................40
    Pflugerville Karst Fauna Region..........................................................................................................40
    McNeil-Round Rock Karst Fauna Region..........................................................................................40
    East Cedar Park Karst Fauna Region.................................................................................................41
    Jollyville Plateau Karst Fauna Region................................................................................................41
    West Cedar Park Karst Fauna Region................................................................................................41
    Post Oak Ridge Karst Fauna Region..................................................................................................41
    Marble Falls Karst Fauna Region........................................................................................................42
    Pedernales Karst Fauna Region.........................................................................................................42
    Georgetown Karst Fauna Region.......................................................................................................42
    North Williamson County Karst Fauna Region..................................................................................42
    South Bell County Karst Fauna Region..............................................................................................43
    South Fort Hood Karst Fauna Region.................................................................................................43
    Undesignated Karst Fauna Region....................................................................................................43
Conclusions...............................................................................................................................................44
    Karst Fauna Regions............................................................................................................................44
    Karst Zones...........................................................................................................................................46
Recommendations...................................................................................................................................46
Acknowledgments...................................................................................................................................48
References................................................................................................................................................49

                                                            NATIONAL CAVE AND KARST RESEARCH INSTITUTE REPORT OF INVESTIGATION 10                         3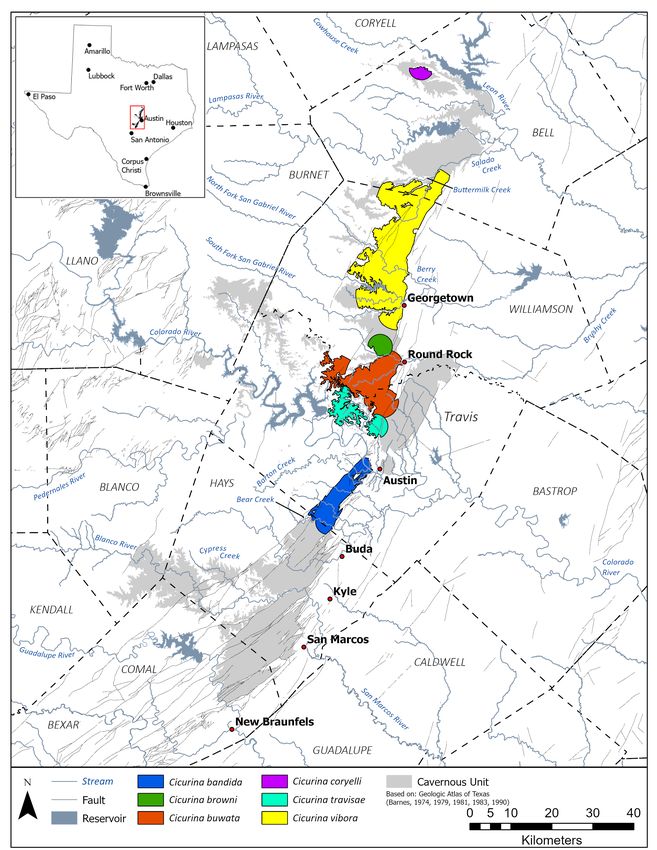
List of Tables and Figures
Table 1
Species and locality data................................................................................................................................................... [online only]

Table 2
Range distances per species....................................................................................................................................................................13

Figure 1
Study area location map with cavernous unit and existing karst fauna regions, as defined by George Veni and Associates
(1992); the North Hays County Karst Fauna Region was only partly defined..................................................................................... 7

Figure 2
Schematic workflow of ArcPro model for analyzing species ranges..................................................................................................11

Figure 3
Ranges of Aphrastochthonius, Dichoxenus, and Mexichthonius species.......................................................................................... 15

Figure 4
Ranges of Bastrisodes and Texamaurops species..................................................................................................................................16

Figure 5
Ranges of Cicurina species.......................................................................................................................................................................17

Figure 6
Range of Eidmannella reclusa..................................................................................................................................................................18

Figure 7
Ranges of robust Rhadine species...........................................................................................................................................................19

Figure 8
Ranges of slender Rhadine species.........................................................................................................................................................20

Figure 9
Ranges of Speodesmus species................................................................................................................................................................21

Figure 10
Ranges of Tartarocreagris species............................................................................................................................................................22

Figure 11
Ranges of Tayshaneta species..................................................................................................................................................................23

Figure 12
Ranges of Texella species..........................................................................................................................................................................24

Figure 13
Combined range margins of all species; see Figures 3–12 for the individual species ranges......................................................... 25

Figure 14
Karst zones as defined by Veni and Martinez (2007).............................................................................................................................39

Figure 15
Karst fauna regions as revised by this study............................................................................................................................................40

Figure 16
Karst zones as revised by this study...........................................................................................................................................................48

4              NATIONAL CAVE AND KARST RESEARCH INSTITUTE REPORT OF INVESTIGATION 10
Statistical Analysis and Revision of Endangered Karst Species
                 Distribution, Austin Area, Texas

                               George Veni, PhD, and Michael Jones
                              National Cave and Karst Research Institute

Abstract                                                       Introduction
The cavernous outcrops in the Austin, Texas, area,             The eastern margin of the Edwards Plateau in the
exposed along the Balcones Fault Zone, contain seven           vicinity of Austin, Texas, is a bio-geologically
troglobitic species of karst invertebrates, federally          complex region. Species living in its caves and related
listed as endangered by the US Fish and Wildlife               voids have become physically isolated from each other
Service to insure their survival. Previous studies             through time, resulting in genetic isolation that has
defined and updated 10 karst fauna regions (KFRs)              produced new species known to occur only within
as mostly distinct ecological regions which include            small geographic areas. The expansion of Austin and
endangered and non-endangered troglobite species.              neighboring communities onto the karst where these
The KFRs are overlapped by four karst zones, which             species occur poses a threat to their survival due to
predict where the endangered karst species are most            the destruction and sealing of caves and karst features,
and least likely to be found in and beyond the KFRs.           changes in nutrient and moisture input into the karst
This report further evaluates and updates those                ecosystem, contaminants introduced into the karst
boundaries, based in part on the development of a GIS          ecosystem, and competition with and predation by
model that maps the ranges of 39 troglobites limited to        non-native species introduced by urbanization (Elliott,
the study area from 479 localities.                            1993 and 2000).

The boundaries of the Central Austin, North Hays               Seven troglobitic species of karst invertebrates in the
County, Post Oak Ridge, and South Travis County                Austin region are federally listed as endangered by
KFRs were confirmed. Minor changes were made                   the US Fish and Wildlife Service (USFWS) to insure
to the Jollyville Plateau, McNeil-Round Rock, and              their survival. Five were listed in September 1988
Rollingwood KFRs. The Georgetown KFR was                       (USFWS, 1988) and a refinement of the taxonomy
extended into what was the southern lobe of the North          added two more species to the list in 1993 (USFWS,
Williamson County KFR, which in turn was extended              1993). The species and their common names are:
north into southern Bell County. The Cedar Park KFR
was divided into the East Cedar Park and West Cedar            Batrisodes texanus (Coffin Cave mold beetle)
Park KFRs. Eight informal KFRs were described                  Rhadine persephone (Tooth Cave ground beetle)
as containing only non-endangered karst species as             Tartarocreagris texana (Tooth Cave pseudoscorpion)
constraints on the distribution of the endangered karst        Tayshaneta myopica (Tooth Cave spider)
species. An “Undesignated” KFR was created for                 Texamaurops reddelli (Kretschmarr Cave mold beetle)
small, biologically unstudied and geologically isolated        Texella reddelli (Bee Creek Cave harvestman)
karst areas until they could be examined to determine          Texella reyesi (Bone Cave harvestman)
if they belong to a designated KFR and which one.
                                                               In 1992, George Veni and Associates examined the
Karst Zone 1, where endangered karst species are               stratigraphic, structural, and hydrological controls
known to occur, was expanded throughout most of the            on cave development in the Austin area, coupled
previous Karst Zone 2 areas based on new localities;           with an evaluation of the distribution of troglobitic
it was reduced in the Rollingwood KFR based on the             species. While some troglobites occur broadly across
GIS modeling. Karst Zone 2, which has a high prob-             the Edwards Plateau, the 1992 study focused on 38
ability of containing the endangered species, changed          species limited to the Austin area to determine if they
in area proportionally to the changes in Karst Zone 1.         were restricted to certain regions.
Karst zones 3 and 4 were each split into two subzones
to better identify their biological status and manage          The “Austin area” was defined in 1992 as the contig-
their ecosystems.                                              uous range of the Cretaceous-age Edwards Limestone

                                             NATIONAL CAVE AND KARST RESEARCH INSTITUTE REPORT OF INVESTIGATION 10   5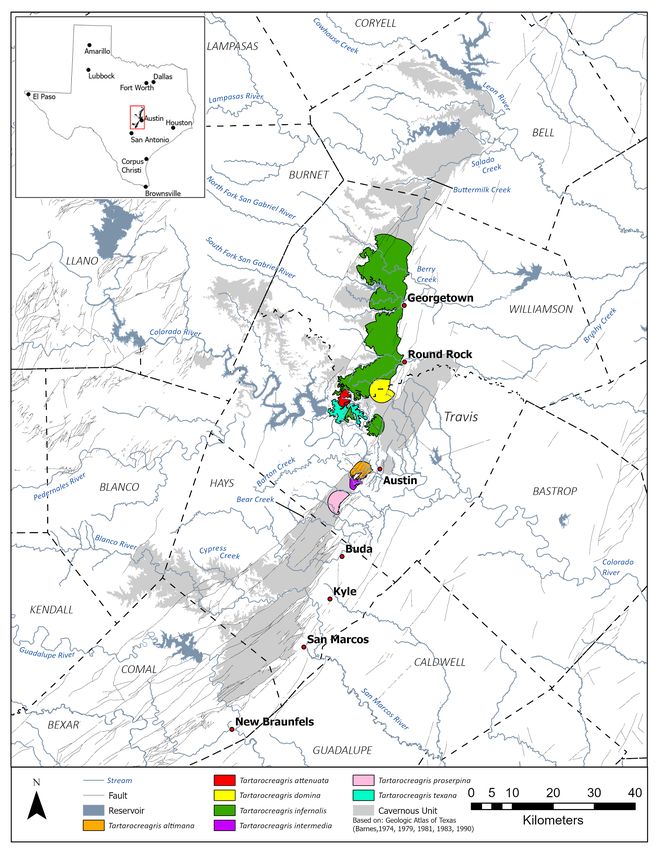
Group extending north approximately 83 km from                    habitat for endangered or other endemic invertebrate
the Hays-Travis County line to the Williamson-Bell                cave fauna;
County line (Figure 1). While other carbonate units               Zone 3: areas that probably do not contain endangered
occur in the area and were considered, nearly all cave            cave fauna; and
development was found in the Edwards which made it                Zone 4: areas which do not contain endangered cave
the de facto defining unit. The eastern limit of the area         fauna.
was bounded primarily by faults that down-throw the
Edwards into the subsurface and below the water table.            Due to the absence of directly observable features on
On average about 9–13 km to the west, the opposite                the surface to define the extent of species’ underground
boundary was defined primarily where the Edwards                  habitat, these zones were based on biological and geo-
thins and is removed by erosion, although the southern            logical factors that could be used to estimate the likely
25 km are bounded by another major fault. Addition-               boundaries of species’ habitat and areas of probable
ally, an isolated 33-km long, narrow, Edwards-capped              and improbable habitat. These zones have since been
plateau known as Post Oak Ridge in western Travis                 used by USFWS in several ways, but primarily as
and eastern Burnet County was included in the study.              management zones, determining what level of action
                                                                  and research is needed in the protection and study of
George Veni and Associates (1992) plotted the distri-             species and areas within them (e.g. USFWS, 2001).
bution of the 38 troglobite species and discovered that
certain species occur in different areas. Statistically           In 2007, Veni and Martinez redrew the karst zones
analyzing the percentage of species endemic to and                boundaries digitally in Geographic Information
shared with other areas, the Austin area was divided              System (GIS) software and updated them based on an
initially into 11 Karst Fauna Regions (KFRs; Figure 1):           increase of 180 new localities for the endangered karst
                                                                  species above the 43 known in 1992. Additionally,
    1. Cedar Park                                                 they noted that the North Hays and Post Oak Ridge
    2. Central Austin                                             KFRs required no further consideration because
    3. Georgetown                                                 the additional data made it clear those KFRs do
    4. Jollyville Plateau                                         not contain the endangered karst species. Further,
    5. McNeil                                                     they clarified a finding from the George Veni and
    6. North Hays County                                          Associates (1992) study that no significant difference
    7. North Williamson County                                    was found between the McNeil and Round Rock KFRs
    8. Post Oak Ridge                                             and recommended they be combined into a single
    9. Rollingwood                                                KFR: McNeil-Round Rock. Their first and strongest
    10. Round Rock                                                recommendation was for a more robust statistical
    11. South Travis County                                       analysis of species distribution, which is the subject of
                                                                  this report.
The purpose of the KFRs was to identify major eco-
logical communities that USFWS could use for species              Of the 38 troglobite species evaluated by George
recovery. Although the statistical methods were simple,           Veni and Associates (1992) to create the KFRs, 34
considering 33 species beyond the five listed at the              belonged to only seven genera. They hypothesized that
time added statistical confidence to the results. The             multiple species evolved due to factors that isolated the
KFRs allowed USFWS to manage the species commu-                   individual populations, facilitating genetic divergence.
nities in ways that could potentially lead to delisting           Since troglobites are, by definition, obligate cave
and/or preclude the need to list other rare species as            animals that cannot survive on the surface, the absence
endangered (e.g. USFWS, 1994).                                    of cavernous rock is the primary barrier to troglobite
                                                                  distribution. Consequently, three of the 38 species
An additional aspect of the study by George Veni and              were endemic to the Post Oak Ridge KFR, which is
Associates (1992) was to delineate four endangered                separated from the other KFRs by non-cavernous rock,
species habitat and management Karst Zones that                   and none of the other 35 species from those KFRs
were hand-drawn on twenty-two 7.5’ topographic                    were found on Post Oak Ridge.
quadrangles. They were defined as:
                                                                  To explain the differences in distribution of species
Zone 1: areas known to contain endangered cave                    in the other KFRs where the limestone is contiguous,
fauna;                                                            George Veni and Associates (1992) examined troglo-
Zone 2: areas having a high probability of suitable               bite distribution relative to streams and faults. They

6        NATIONAL CAVE AND KARST RESEARCH INSTITUTE REPORT OF INVESTIGATION 10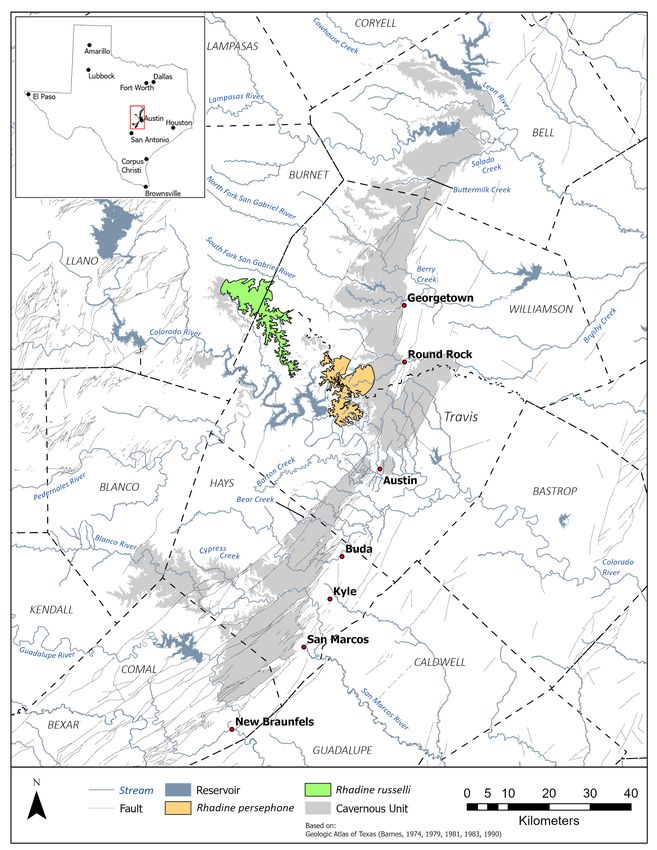
Figure 1. Study area location map with cavernous unit and 2007 karst fauna regions per Veni and Martinez (2007).

                                           NATIONAL CAVE AND KARST RESEARCH INSTITUTE REPORT OF INVESTIGATION 10   7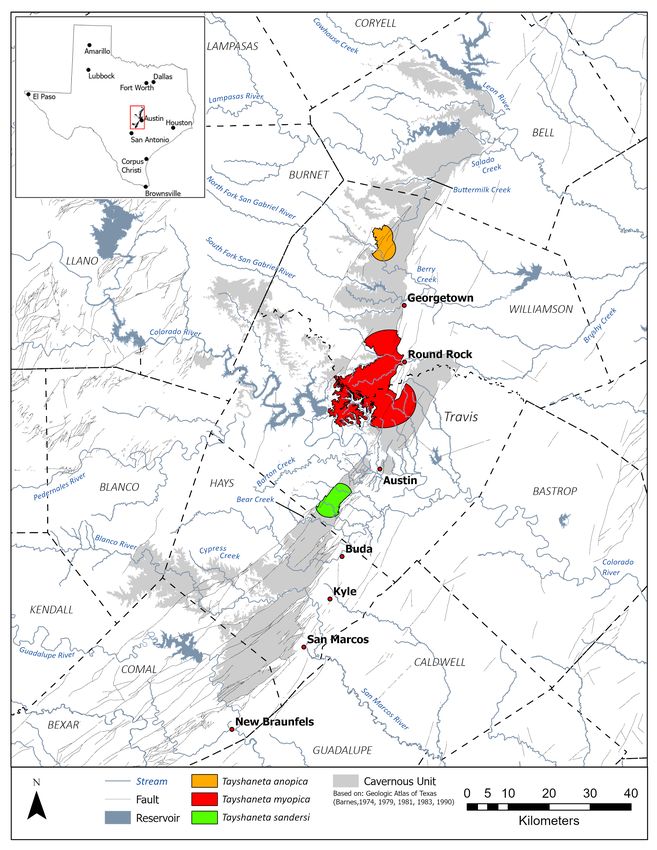
found streams were the predominant factor isolating               results to modify KFR boundaries as appropriate to the
populations because they cut through the limestone,               results. This study’s secondary purpose is to update
leaving less cavernous rock through which species                 the karst zone boundaries based on new localities and
could pass. Additionally, the limestone below streams             insights from the GIS analysis.
is perennially or periodically below the water table and
because the species are not aquatic, they cannot exist            Methodology
in or easily pass through such conditions. Also the               Rare and Endangered Species Data Collection
effects of faults on species distribution were examined           James Reddell maintains the most detailed and
and no influence was found, except where the degree               comprehensive database of species collected and
of displacement juxtaposed cavernous and non-cavern-              observed in Texas caves. He provided a list for this
ous rock. Supporting these results, they also studied             study of all confirmed and tentative localities for the
related endangered species in the San Antonio, Texas,             seven listed species, plus 32 non-listed troglobite
area about 70 km to the southwest and those data                  species known only from the study area. His list
yielded the same conclusions (Veni, 1994).                        includes species beyond but adjacent to the known
                                                                  distribution of the federally listed species in order to
These studies defined two types of boundaries to                  better define the limits of the listed species’ range.
troglobite distribution and for the KFRs: barriers                Based on this distribution of species, the study area
and restrictions. Barriers are boundaries beyond                  is defined by the cavernous geologic units (described
which troglobites cannot pass, such as areas lacking              in the following subsection) containing the 39 species
cavernous rock. Restrictions are boundaries where                 along the Balcones Fault Zone from the Guadalupe
some gene flow is possible but is limited by space and/           River in Comal County, northeast approximately
or time. Common examples are thin and/or narrow                   160 km to the Leon River in Bell and Coryell counties
areas of cavernous limestone, or along streams that               (Figure 1).
occasionally run dry, lowering the water table allowing
species to pass occasionally. Restrictions explain                The 39 species are known from a total of 479 localities,
why some troglobite communities are not completely                predominately caves but also a well and some karst fea-
endemic but share some species with other KFRs.                   tures not large enough to qualify as caves by the Texas
                                                                  Speleological Survey (2020) definition of a minimum
Zara Environmental (2010b) used similar methods to                5 m of humanly traversable passage and with no dimen-
establish KFRs in Hays County. Their study, using                 sion of the entrance exceeding the cave’s traversable
three measures of endemicity by Mainali (published                length. At least one federally listed species is known in
later in 2014), included both terrestrial and aquatic             255 localities, 36 localities have no known listed species
species with the goal of identifying areas of overall             but at least one species tentatively identified as listed,
greater karst biodiversity for protection, as opposed             and no confirmed or tentatively confirmed listed species
to the prior studies that focused on the federally listed         are known in the remaining 188 localities.
terrestrial troglobites.
                                                                  The 39 species do not include all troglobites
A few authors suggest the KFR boundaries and                      known in the study area. The ranges of troglobites
justifications require revision. For example, White               which are widely distributed across central Texas
et al. (2009) suggest relay ramps of block-faulted                provide no analytical insights to identify barriers or
limestone may play a greater role in troglobite                   restrictions to species more sensitive to speciation.
distribution than certain streams. Van Kampen-Lewis               Stygobites (aquatic troglobites) are also excluded
and White (2019) argue that the South Fork of the                 from this analysis because their habitats and the
San Gabriel River may not be a boundary between                   factors affecting their distribution are not directly
the Georgetown and North Williamson County KFRs                   comparable to the federally listed terrestrial
due to the presence of the federally listed mold beetle,          troglobites. The published status of species in
Batrisodes texanus, on each side of the river.                    certain localities, whether tentative or confirmed,
                                                                  has changed based on new data and consultation
The primary purpose of this investigation is to include           with USFWS and the biologists specializing
all the known localities of rare and endangered                   in those taxa. Those changes are noted in the
troglobites in the Austin area, along with geologic and           references in Table 1 (available online). In other
hydrologic data, into a GIS model to conduct a robust,            cases, while USFWS does not formally recognize
detailed, objective, statistical analysis of factors that         the status of some species (notably the division
might influence troglobite distribution, and use those            between Batrisodes cryptotexanus and Batrisodes

8        NATIONAL CAVE AND KARST RESEARCH INSTITUTE REPORT OF INVESTIGATION 10
texanus), they accept them for the purposes of this orientation and verification. By agreement with
investigation. USFWS, the cave names, alternate names, and
coordinates in the TSS database, and following
Reddell’s list was converted into a spreadsheet the updates to the database from this study, are
(Table 1, available online). The 479 localities are considered authoritative. While the above work
sorted by rows for each locality and columns for each is crucial to this investigation, it also resulted in
species. Additional data are added from the files of major improvements to the TSS database. To avoid
the Texas Speleological Survey (TSS), a non-profit any potential conflict of interest, Reddell and Veni
corporation organized to collect, maintain, and make conducted this work with the TSS materials as TSS
available information on caves and karst features in volunteers.
Texas. Those data primarily included the location
coordinates for each locality, recorded in latitude The detailed review of TSS and other records also
and longitude with a datum of NAD 1983, estimated updated Reddell’s initial list of species and recorded in
precision of the coordinates, and all known alternate Table 1 (available online). The locations and species
names for the localities. Four additional columns are localities were reviewed multiple times for accuracy
included in Table 1 (available online): county, KFR and completeness, including a meticulous comparison
(initial), KFR (revised) per any revisions from this where USFWS personnel reviewed the locations and
study, and references. Only the primary references for species recorded in their files.
each species at each locality are included. Where no
published reference is known, or where unpublished Karst Fauna Region Analysis
updates occurred, Reddell was listed as a personal Conceptual Approach
communication. We studied and attempted multiple methods to identify
the most accurate means of evaluating the distribution
To protect the species’ localities and the privacy of of the troglobite species. We also considered modeling
their landowners, location coordinates are excluded and tested many factors involving geology, hydrology,
from the version of Table 1 (available online) attached cave microclimates, surface climate, vegetation, and
to this report. Further, all maps in this report do not soils for their potential effects on species distribution.
show those locations. All raw and processed data Most didn’t have sufficient data, sufficiently detailed
from this study, including all specific locations, data, or the needed resolution of data. Other data
were provided to the USFWS for review prior to the varied in quality and resolution over the study area in
completion of this report. ways that might bias the results.
The TSS files are not generally open to the public. Following this extensive evaluation, the best method
TSS does provide data upon formal request to was determined as reversing the analysis. Rather than
support research and other needs. For this project, model the effects of various physical conditions on
the lead author (Veni) and Reddell had full access the species’ distribution, we determined and analyzed
to the TSS files. Both are past TSS directors and the range of distribution for each species. The clus-
current data managers, which allows them to more tering of multiple range margins is then interpreted to
rigorously review the files for information. They reflect the presence of a barrier or restriction to species
spent hundreds of hours comparing consulting distributions a posteriori. Given that the localities
reports (provided by USFWS) and other reports occur irregularly spaced across a broad area, exact
to the TSS records. Many caves and karst features range alignments are not expected. However, geologic
are recorded by multiple names and codes. contacts, faults, streams, soils, and other factors can be
Consequently, some were unknowingly listed examined carefully in areas where the range margins
multiple times. They scrutinized hundreds of cluster to determine if they may create a barrier or
reports, maps, and Google Earth images to verify restriction. Where no hydrogeological explanation is
that each locality in this study was included only found for a cluster of range margins, subsurface eco-
once and in the correct location. Several people logical conditions are assumed as the likely cause.
and organizations provided valuable primary
and supplemental information. Reddell and Veni Hydrogeologic Data
determined the location and identity of many caves George Veni and Associates (1992) described in detail
by studying and improving the coordinates of caves the hydrogeologic factors resulting in cave devel-
and karst features without species pertinent to this opment in the study area and how they relate to the
study, which were used as landmarks for geographic distribution of the endangered species. In summary,
NATIONAL CAVE AND KARST RESEARCH INSTITUTE REPORT OF INVESTIGATION 10 9the study area is in the Balcones Fault Zone at the River; and
eastern edge of the Edwards Plateau. Predominantly • Marble Falls Limestone.
Cretaceous-age carbonate rocks occur throughout the
area. These rocks dip slightly to the east where they While some portions of the undivided units above are
are downfaulted into the subsurface and buried under not cavernous, the map resolution requires their inclu-
younger and mostly clastic geologic units. sion. Most of the species and all the federally listed
karst species occur in the Edwards Limestone or equiv-
Karst aquifer development and major groundwater alent Fredericksburg Group (“Edwards Limestone” is
flow patterns are generally downdip, west to east, used in this report to generically refer to both). Except
changing to the structural strike, north and south, along for the Pennsylvanian age Marble Falls Limestone, all
the eastern edge of the karst where springs discharge rocks in the cavernous unit are Cretaceous in age.
into base level rivers; Sharp et al. (2019) provide the
most recent and comprehensive review of the Edwards In addition to the above-listed rocks, areas geologically
Aquifer, the primary aquifer of the study area. Depths mapped as alluvium or other Quaternary-age deposits,
and patterns of cave development vary throughout the but underlain by these rocks, were also included as part
study area, affecting species distribution in different of the cavernous unit since troglobite habitat extends
ways locally. While caves are present throughout the below these shallow deposits. This is demonstrated
study area, not all contain appropriate habitat for tro- by several caves and karst features with entrances that
globites if nutrients, humidity, temperature, and other extend through these deposits into cavernous habitat
conditions are not suitable. below.
The modeled analyses of karst species distribution for Similarly, Bandit Cave, Big Mouth Cave, Five Pocket
this investigation were conducted using the geographic Cave, McGlothin Sink, McNeil Quarry Cave, Rocky
information system (GIS) software ArcGIS Pro 2.6.0 Horror Pit, and Spyglass Cave plot in non-cavernous
by Environmental Systems Research, Inc. (Esri). Basic units. In each of these situations, either the Del Rio
data layers in the GIS model include cultural features Clay or the undivided Del Rio Clay and Georgetown
and boundaries and major streams. The most critical Formation thinly cover the Edwards Limestone, except
data layer is the geological map of the 1:250,000 scale at the cave entrances in areas too small to appear
Geologic Atlas of Texas, which define this study’s on the geologic map. Thus, areas where these and
geological formation boundaries and major faults. The other cave entrances and karst features are known in
portion of the Geologic Atlas within the study area mapped non-cavernous units, and where the outcrops
includes parts of the following published sheets: Austin of those units are small, thin, and surrounded by the
(Barnes, 1974), Llano (Barnes, 1981), San Antonio cavernous unit such that habitat for troglobites almost
(Barnes, 1983), Seguin (Barnes, 1979), and Waco certainly extends under the non-cavernous units and
(Barnes, 1990). might be exposed by construction on the surface, were
included as part of the cavernous unit. The largest non-
Since troglobite species are found only in caves or re- cavernous area included in this way is about 3 km long
lated underground habitat, several geologic units were by 1 km wide. Prior to this analysis, several Edwards
lumped into a single “cavernous unit” for the purposes Limestone caves were known to have entrances
of this analysis. In descending (youngest to oldest) surrounded by the otherwise non-cavernous and thin
stratigraphic order those units are the: Georgetown Formation, which is why the Georgetown
• Austin Chalk; was included initially among the cavernous units.
• Georgetown Formation;
• Edwards Limestone and equivalent Fredericksburg The general steps for the ArcPro analysis of the
Group and in Bell County the equivalent undi- data are programmed in Python and illustrated
vided Denton Clay, Fort Worth Limestone, Duck schematically in Figure 2. The model begins with two
Creek Limestone, Kiamichi Clay, and Edwards parallel data paths. In the first path, the coordinates
Limestone; of the species’ localities in Table 1 (available online)
• Walnut Formation (in the Post Oak Ridge area (“All Cave Locations” in Figure 2) are plotted (“XY
where it is cavernous and not in the Bell-Coryell Table To Point”) as points on the map (“All Cave
County area where it is not); Points”). These points (“All Cave Points”) are then
• Lower Member of the Glen Rose Limestone; selected (“Select By Attribute”) by species listed in
• undivided mapping of the Hensel Sand and Cow Table 1 (available online) as confirmed for a locality
Creek Limestone along part of the Pedernales (“Confirmed Species”). The tentative species localities
10 NATIONAL CAVE AND KARST RESEARCH INSTITUTE REPORT OF INVESTIGATION 10are not used in the model’s analysis. While the range
of confidence in tentative species identification varied,
James Reddell identified those of high confidence.
The tentative species are plotted later as an informal
validation of the model output and show that the high
confidence tentative localities are within the vicinity of
the confirmed species.
The second path prepares the GIS “cost surface” on
which the ranges were modeled. The first step of this
path is the selection of the Texas Geologic Database
rock unit polygons (“Texas Rock Units”) by the
cavernous units described above (“Cavernous Units”).
Next, the cavernous units polygons are exported
(“Polygon to Raster”) to a raster cost surface (“Cavern-
ous Units Cost Surface”).
The two paths join with the merging of the Cavernous
Units Cost Surface and the Confirmed Species. Before
the model is run further per Figure 2, and as described
in the following subsection, the Confirmed Species
localities are plotted to confirm their occurrence in the
cavernous unit.
Limits in the precision of the coordinates for five caves
(identified in Table 1 [available online], Adjusted
Locations), and/or resolution of geologic mapping, re-
quires adjusting the caves’ locations, generally within a
few tens of meters, so they will plot within the cavern-
ous unit. One adjustment extends beyond that range.
Uncertainties in the precision of Bee Creek Cave’s
location and the surrounding geology result in the
cave’s location being over 200 m from the currently
mapped boundary of the cavernous unit. Although the
cave’s location is adjusted to within the cavernous unit
for the purposes of this study, future confirmation of
the cave’s location and the extent of the cavernous unit
in this area may require adjusting the local boundaries
of the surrounding KFR and karst zone.
Species Ranges
Unlike surface species which are more easily observed
and have habitat conditions that are mapped readily,
defining the range of troglobites is based on often
random and sparse information. The purpose of
including 32 non-endangered troglobites in this study,
which depend on habitat conditions similar or identical
to the endangered species, is to provide a richer data
set for analysis than can be derived from the seven
endangered species alone.
Figure 2. Schematic workflow of ArcPro model for Most troglobites in the study area are allopatric in their
analyzing species ranges.
genera. This fact is used to define species ranges. After
many attempts and refinements with different ArcPro
NATIONAL CAVE AND KARST RESEARCH INSTITUTE REPORT OF INVESTIGATION 10 11tools and methods, the following range determination the same genus with a set maximum distance
method is applied to the allopatric species: to divide the overlap equally between adjacent
1. Areas within a 3-km travel radius are established ranges.
around all localities in the model for a given
species. The 3-km radius extends with the ArcPro Four special circumstances require manual modifica-
distance allocation tool from the coordinates of tions to the modeled Output Species Range Polygons.
each cave entrance (“Distance Allocation”); caves First, some Rhadine species are sympatric. While these
are treated as if they only have one entrance since carabid beetles may occupy the same cave, they do not
multi-entrance caves are few in the study area and occupy the same ecological niche in the cave, which
typically less than 30 m apart—less than 1% of the allows their co-existence. James Reddell (personal
radius. Based on field experience and study of the communication, 2020), based on morphology, divides
distribution of the 39 species, 3 km is determined the Rhadine genus into two groups:
as an approximate average default range for all
troglobites from a known locality. Robust:
2. These radii, or other range margins in the follow- Rhadine persephone
ing steps, do not extend beyond the limit of the Rhadine russelli
cavernous unit. In addition, by use of the distance Slender:
allocation tool, the 3-km or other range distances Rhadine new species 1
below are based on the distance of travel for the Rhadine new species 2
species within the cavernous unit rather than a Rhadine austinica
Euclidean (straight line) distance from the cave Rhadine noctivaga
entrance. Thus, they measure distance around Rhadine subterranean mitchelli
rather than extending across gaps in the unit. Rhadine subterranea subterranea
3. If a given species is known from multiple caves
further than 3 km apart, the 3-km radii are These species are then plotted mostly by the above
extended to two-thirds the distance of the cave four steps. Reddell further notes that across genera in
furthest from its nearest neighbor with that same every case of sympatry in troglobites in the region, one
species (recorded in Table 2). The two-thirds species is more cave-adapted than the other, reflecting
distance is found to produce biologically realistic different periods where ancestor species began to
ranges, as opposed to shorter distances that barely occupy or reoccupy cave habitats.
connect the ranges, while not extending the ranges
unrealistically from the known localities. Once In an opposite situation to Rhadine, the second
connected by this method, these combined ranges special circumstance is that troglobitic Batrisodes and
from all caves with a certain species defined the Texamaurops species mold beetles are closely related
range of that species (“Output Distance Allocation and allopatric, allowing them to be modeled together.
Raster” in Figure 2), which is exported (“Raster
to Polygon”) to polygon format (“Output Species The third special circumstance is where a species’
Range Polygons”). This method demonstrates range is divided by the smaller range(s) of other
that a species range has the capacity to extend species. These situations are interpreted as areas
at least that two-thirds distance from a location once occupied entirely by the species with the larger
given enough time and no physical or biological range, until extirpated from the intervening area by
impediments, but it only applies to the individual the invasion of a competitive troglobite of the same
species assessed in those caves; the distance for genus. In these cases, the maximum range distance
other species of the same genus may differ and are from a cave is based on the maximum distance within
determined separately by the same method. any of the subranges, without crossing the range
4. The range of a given species can be limited in of the intervening species. While the species may
some areas by the edge of the cavernous unit, have formerly occurred in the intervening area, its
as described in Step 2 above, but it can also distribution between caves in that area is unknown and
be limited by encountering the ranges of other unlikely to have spanned that entire distance. The same
species of the same genus. Because the species principle applies to species occurring in different KFRs
are allopatric, they cannot occupy the same area. separated by the absence of the cavernous unit. In
Where the modeled ranges of the individual those situations, the principle of this third circumstance
species will otherwise overlap, the distance remains the same, except that the populations were
allocation tool is used on all species within divided by stream down-cutting to remove the
12 NATIONAL CAVE AND KARST RESEARCH INSTITUTE REPORT OF INVESTIGATION 10Table 2. Range distances per species.
Species Range dis- Basis
tance (m)
Aphrastochthonius muchmoreum 3,000 Standard radius
Batrisodes cryptotexanus 3,000 Standard radius
Batrisodes reyesi (Georgetown KFR 3,000 Standard radius
subrange)
Batrisodes reyesi (McNeil-Round 3,000 Standard radius
Rock KFR subrange)
Batrisodes reyesi (Post Oak Ridge 8,456 Distance from Collaboration Cave to GCWA Cave
KFR subrange)
Batrisodes texanus (northern 3,000 Standard radius, constrained by Batrisodes cryptotexanus species range
subrange)
Batrisodes texanus (southern 4,330 Distance allocation model using 2/3 distance from Sunless City Cave to Temples
subrange) of Thor Cave, constrained by Batrisodes cryptotexanus species range
Cicurina bandida 3,000 Standard radius
Cicurina browni 3,000 Standard radius, constrained by Cicurina buwata species range
Cicurina buwata 4,200 Distance from Fossil Garden Cave to LakeLine Cave, constrained by Cicurina
browni and Cicurina travisae species ranges
Cicurina coryelli 3,000 Standard radius
Cicurina travisae 3,000 Standard radius for both subranges
Cicurina vibora 11,125 Distance from Chagas Cave to Rattlesnake Filled Cave
Dichoxenus n. sp. 3,000 Standard radius
Eidmannella reclusa 8,991 Distance from Near Miss Cave to Plethodon Cave
Mexichthonius exoticus 3,000 Standard radius
Rhadine austinica 3,000 Standard radius
Rhadine n. sp. 1 3,000 Standard radius for both subranges, with eastern subrange constrained by
Rhadine n. sp. 2 and Rhadine subterranea subterranea species ranges
Rhadine n. sp. 2 3,000 Standard radius, constrained by Rhadine n. sp. 1 species eastern subrange and
Rhadine subterranea subterranea species subrange
Rhadine noctivaga 6,157 Distance allocation model using 2/3 distance from Coffin Cave to Cricket Cave, con-
strained by Rhadine subterranean mitchelli species range
Rhadine persephone 4,166 Distance from Lakeline Mall Trap No. 6 to Stovepipe Cave
Rhadine russelli 6,663 Distance from GCWA Cave to Lunsford Cave
Rhadine subterranean mitchelli 3,000 Standard radius for all three subranges, with the northern subrange constrained
by Rhadine noctivaga and Rhadine subterranea subterranea species ranges, the
southeastern subrange constrained by Rhadine subterranea subterranea species
range
Rhadine subterranea subterranea 3,000 Standard radius, constrained by Rhadine n. sp. 1 species eastern subrange,
Rhadine n. sp. 2 species range, and Rhadine subterranea mitchelli northern and
southeaster species subranges
Speodesmus bicornourus (northern 6,250 Distance allocation model using 2/3 distance from Bat Well Cave to Cobb Cavern
subrange)
Speodesmus bicornourus (southern 3,427 Distance allocation model using 2/3 distance from Get Down Cave to Ireland’s
subrange) Cave
Speodesmus castellanus 3,000 Standard radius
Speodesmus n. sp. (eastern sub- 12,765 Distance allocation model using 2/3 distance from Michaelis Cave to Slaughter
range) Creek Cave
Speodesmus n. sp. (western sub- 3,000 Standard radius
range)
Tartarocreagris altimana 3,000 Standard radius, constrained by Tartarocreagris intermedia species range
Tartarocreagris attenuata 3,000 Standard radius, constrained by Tartarocreagris infernalis and Tartarocreagris
texana species ranges
Tartarocreagris infernalis (northern 5,058 Distance from Beck Ranch Cave to Lakeline Cave, constrained by Tartarocreagris
subrange) attenuata and Tartarocreagris domina species ranges
Tartarocreagris infernalis (southern 3,000 Standard radius for both southern subranges, constrained by Tartarocreagris texa-
subranges) na species range for the southwestern subrange
NATIONAL CAVE AND KARST RESEARCH INSTITUTE REPORT OF INVESTIGATION 10 13Table 2 (continued). Range distances per species.
Species Range dis- Basis
tance (m)
Tartarocreagris domina 3,000 Standard radius, constrained by Tartarocreagris infernalis species range
Tartarocreagris intermedia 3,000 Standard radius, constrained by Tartarocreagris altimana species range
Tartarocreagris proserpina 3,000 Standard radius
Tartarocreagris texana 3,000 Standard radius, constrained by Tartarocreagris attenuata species ranges and
Tartarocreagris infernalis species southwest species subrange
Texamaurops reddelli 3,000 Standard radius
Tayshaneta anopica 3,000 Standard radius
Tayshaneta myopica 9,395 Distance from Millipede Annex Cave to Tight Pit Cave
Tayshaneta sandersi 3,000 Standard radius
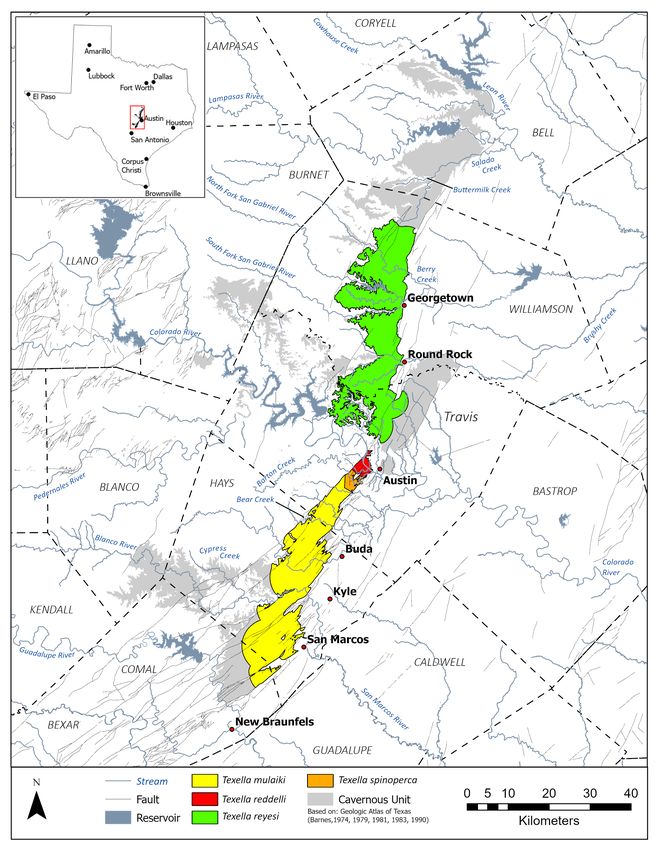
Texella mulaiki 6,666 Distance allocation model using 2/3 distance from Big Mouth Cave to Pulpit
Cave, constrained by Texella spinoperca species range
Texella reddelli 3,000 Standard radius, constrained by Texella spinoperca species range
Texella reyesi 5,133 Distance allocation model using 2/3 distance from Cotterell Cave to Hole-in-the-
Road Cave, constrained by the Colorado River and Texella reddelli species range
Texella spinoperca 3,000 Standard radius, constrained by Texella mulaiki and Texella reddelli species ranges
cavernous rock, instead of by an intervening species. natural KFR boundaries, where clustering is
expected for many species, and no additional
Where overlaps in ranges occur, they are generally consideration is given to clustering along these
divided equally, as in Step 4 above. However, where boundaries unless something unusual is discovered.
one range substantially overlaps the range of another, 2. Clusters are defined as three or more range
the range is defined based on two considerations. First, margins within an area of width no greater than
if the halfway distance between the nearest caves for the the approximate average length of the range
different species is within the smaller range, that smaller margins. The range margin length, for the purposes
range is truncated at that distance. Second, if the half- of defining clusters, is the straight-line distance
way distance is outside of the smaller range, the limit between a margin’s end points at the edges of the
of the smaller range defines the boundary. Both circum- cavernous unit where the overall trend is linear.
stances can apply to different parts of the same range. Where a margin is generally circular or oval, the
diameter of the circle or linear axis of the oval is
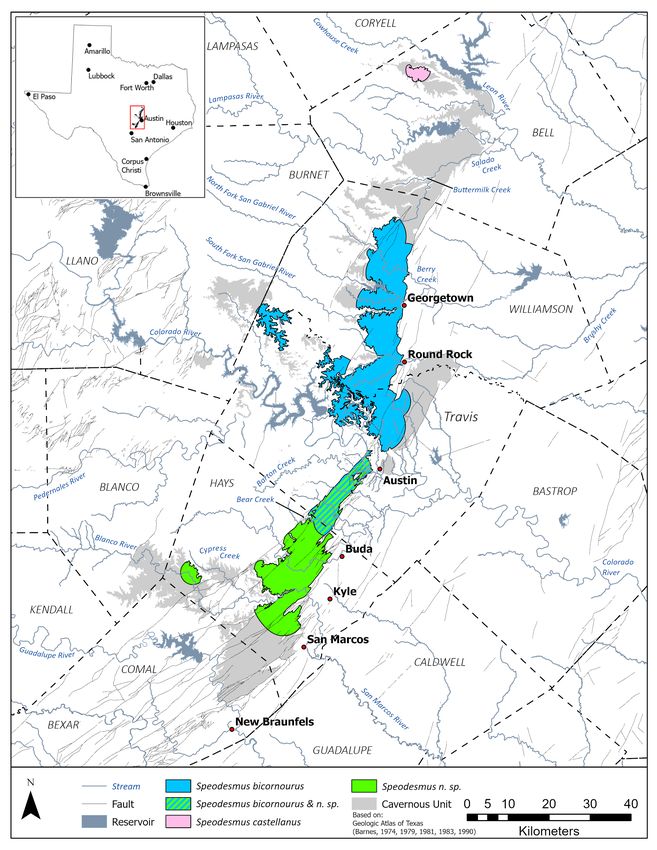
The fourth special circumstance is where sympatry the length. This definition and measure of clustering
exists, but there is insufficient information to consid- only applies to areas of contiguous cavernous rock.
er them functionally allopatric, in different niches, 3. If the species reflected by the clustered range
as with Rhadine. This only occurs in this study with margins represent at least 50% of the species
Speodesmus new species and Speodesmus bicornourus analyzed that occur in that cluster area, that
millipedes. Their ranges are plotted as overlapping, suggests a potential KFR boundary. It is important
following Steps 1–3 above but not Step 4. to reemphasize that a KFR boundary is not
necessarily a barrier to species dispersion over
Following the four special manual adjustments, the time, but it can be a restriction, allowing limited
final Output Species Range Polygons are plotted as dispersion while still promoting speciation.
Figures 3–12. 4. The individual ranges within a cluster at a
potential KFR boundary are reexamined to
Karst Fauna Region Boundary Analysis determine if any special factors, such as modeling
Figure 13 illustrates the species ranges used to eval- artifacts, need consideration in assessing their
uate the KFR boundaries. It combines all the range significance toward evaluating the presence or
margins from Figures 3–12 for examination; due to absence of a KFR boundary.
the complexity and scale of Figure 13, Figures 3–12 5. If after this scrutiny the clustered range margins
should be used to more easily identify specific species still represent at least 50% of the species analyzed
ranges. KFR boundaries are evaluated based on the that occur in that cluster area, without equivo-
clustering of species range margins as in Figure 13 cation, the cluster area is considered verified as
through the following steps and factors: indicating the presence of a barrier or restriction
1. The margins of the cavernous unit are considered to species distribution.
14 NATIONAL CAVE AND KARST RESEARCH INSTITUTE REPORT OF INVESTIGATION 10Figure 3. Ranges of Aphrastochthonius, Dichoxenus, and Mexichthonius species.
NATIONAL CAVE AND KARST RESEARCH INSTITUTE REPORT OF INVESTIGATION 10 15Figure 4. Ranges of Batrisodes and Texamaurops species. 16 NATIONAL CAVE AND KARST RESEARCH INSTITUTE REPORT OF INVESTIGATION 10
Figure 5. Ranges of Cicurina species.

                                        NATIONAL CAVE AND KARST RESEARCH INSTITUTE REPORT OF INVESTIGATION 10   17
Figure 6. Range of Eidmannella reclusa. 18 NATIONAL CAVE AND KARST RESEARCH INSTITUTE REPORT OF INVESTIGATION 10
Figure 7. Ranges of robust Rhadine species.

                                              NATIONAL CAVE AND KARST RESEARCH INSTITUTE REPORT OF INVESTIGATION 10   19
Figure 8. Ranges of slender Rhadine species. 20 NATIONAL CAVE AND KARST RESEARCH INSTITUTE REPORT OF INVESTIGATION 10
Figure 9. Ranges of Speodesmus species.

                                          NATIONAL CAVE AND KARST RESEARCH INSTITUTE REPORT OF INVESTIGATION 10   21
Figure 10. Ranges of Tartarocreagris species. 22 NATIONAL CAVE AND KARST RESEARCH INSTITUTE REPORT OF INVESTIGATION 10
Figure 11. Ranges of Tayshaneta species.

                                           NATIONAL CAVE AND KARST RESEARCH INSTITUTE REPORT OF INVESTIGATION 10   23
Figure 12. Ranges of Texella species. 24 NATIONAL CAVE AND KARST RESEARCH INSTITUTE REPORT OF INVESTIGATION 10
Figure 13. Combined ranges of all species.

                                             NATIONAL CAVE AND KARST RESEARCH INSTITUTE REPORT OF INVESTIGATION 10   25
6. The location and alignment of the cluster area, to better understanding of their ranges through this
along with the actual species localities, are com- report’s KFR boundary analyses.
pared to mapped geologic and hydrologic features
to determine if such a feature or features account Additionally, the remaining two zones are revised as
for the cluster. If so, a KFR boundary is drawn needed with two notable related changes from the
along that feature. The KFR boundary is required earlier zone maps. Previously, Zone 3 was defined
to occur within or adjacent to the cluster area. as “areas that probably do not contain endangered
7. If no known geologic or hydrologic feature cave fauna” and Zone 4 as “areas which do not
accounts for a cluster, it is assumed to result from contain endangered cave fauna.” New data and better
biological factors beyond the scope of this study understanding of management needs expands and more
to assess (e.g. nutrient and moisture variations in precisely redefines those zones as:
cave habitats, competition and displacement by • Zone 3a: areas suitable for troglobite species but
competing species, etc.), and the KFR boundary is which have a low probability of containing endan-
drawn along the axis of the cluster. gered karst species because the habitat is occupied
While the previously established KFR boundaries are by other troglobite species;
known, this evaluation is conducted without any con- • Zone 3b: areas which have a low probability of
sideration given to those boundaries. containing endangered karst species because they
are poorly suited for troglobite species;
Each range margin and cluster is examined carefully • Zone 4a: areas suitable for troglobite species but
for modeling artifacts that might result in erroneous which do not contain endangered karst species
interpretation. The primary potential modeling artifact because the habitat is occupied by other troglobite
considered in the above seven steps is that the modeled species;
species ranges can extend into areas where a given • Zone 4b: areas which do not contain troglobite
species does not occur. If the modeled range for a species species.
extends beyond a possible KFR boundary, but the
species is not present past that possible boundary, that The karst zones are revised based on the GIS karst
is considered supporting evidence for the existence of a zone files developed by Veni and Martinez (2007). Any
KFR boundary. In all cases, all available data (geologic, issues resulting from the software advance of ArcGIS
hydrologic, genetic, evolutionary, etc.) for a cluster area – ArcInfo 9.1, state-of-the-art in 2007, to the currently
and its species are considered in KFR boundary decisions. most advanced software version, ArcPro 2.6.0, are
addressed before further work is conducted.
Karst Zone Analysis
The most critical of the karst zones is Zone 1, where In general, the karst zones are delineated based on
the endangered species are known to occur. When lithology as follows:
the existing maps were first drafted in 1992, only 43 • Zones 1 and 2 occur in the cavernous unit.
caves were known to contain federally listed endan- • Zone 3a is in the cavernous unit but where KFR
gered karst species in the study area. When Veni and boundary modeling indicates the endangered karst
Martinez (2007) updated the karst zones, 249 caves species are nearby but probably not present.
were known or reported to contain listed species. That • Zone 3b is in areas of the cavernous unit covered
study, and a revision of similar karst zones in the San by poorly cavernous or non-cavernous alluvium
Antonio, Texas, area (Veni, 2003), found that wherever or rock, which includes areas of the Bee Cave
caves with habitat appropriate for the listed species Marl, Cedar Park Limestone and Comanche
were found in Zone 2, that the endangered species Peak Limestone, Georgetown Formation, and
were often found—confirming Zone 2 as an area of undivided Georgetown Formation and Del Rio
high probability for containing the federally listed Clay, where the potential for collapse into caves in
species. the underlying cavernous unit occurs; additionally
Zone 3b occurs in the Austin Chalk, because it
For this study, a total of 291 caves are known to is poorly cavernous in the study area, and in the
contain (255) or are reported as potentially containing Comanche Peak Limestone where it interfingers
(36) the endangered karst species. This increase in the with the Edwards Limestone and could contain
number of localities requires additional revision of small caves.
Zone 1 for more effective species management, study, • Zone 4a is in areas of the cavernous unit which
and protection. The need for revision is not limited to are sufficiently distant from the endangered karst
the discovery of new species localities but also due species to preclude their presence, and where a
26 NATIONAL CAVE AND KARST RESEARCH INSTITUTE REPORT OF INVESTIGATION 10You can also read