Long-Term Sand Supply to Coachella Valley Fringe-Toed Lizard (Uma inornata) Habitat in the Northern Coachella Valley, California
←
→
Page content transcription
If your browser does not render page correctly, please read the page content below
U.S. DEPARTMENT OF THE INTERIOR
U.S. GEOLOGICAL SURVEY

Prepared in cooperation with the
U.S. FISH AND WILDLIFE SERVICE

Long-Term Sand Supply to Coachella Valley
Fringe-Toed Lizard (Uma inornata) Habitat
in the Northern Coachella Valley, California

Water-Resources Investigations Report 02–4013
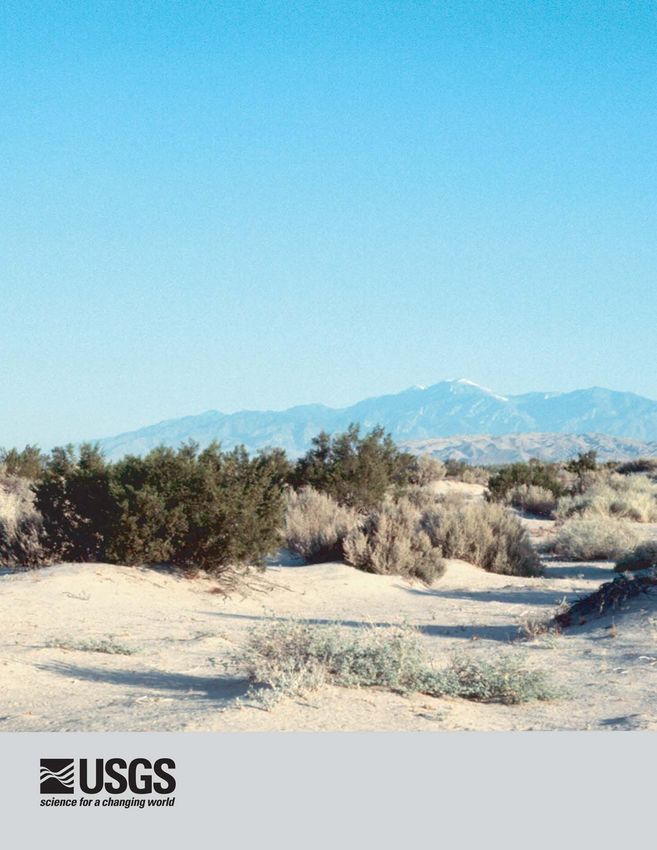
COVER PHOTOGRAPH

June 21, 1978. View of Mount San Gorgonio from the Bermuda Dunes, Coachella Valley
(photograph by Phil Medica, used with permission).
Long-term Sand Supply to Coachella Valley
Fringe-toed Lizard Habitat in the Northern
Coachella Valley, California

By Peter G. Griffiths, Robert H. Webb, Nicholas Lancaster, Charles A. Kaehler, and
Scott C. Lundstrom

U.S. GEOLOGICAL SURVEY

Water-Resources Investigations Report 02-4013

Prepared in cooperation with the

U.S. Fish and Wildlife Service

                                   Tucson, Arizona
                                        2002
U.S. DEPARTMENT OF THE INTERIOR
GALE A. NORTON, Secretary
U.S. GEOLOGICAL SURVEY
Charles G. Groat, Director
Any use of trade, product, or firm names in this publication is for descriptive purposes only and does
not imply endorsement by the U.S. Government.
For additional information write to: Copies of this report can be purchased from:
Regional Research Hydrologist U.S. Geological Survey
U.S. Geological Survey Information Services
345 Middlefield Road Building 810
Menlo Park, CA 94025 Box 25286, Federal Center
http://water.usgs.gov/nrp Denver, CO 80225-0286CONTENTS
Abstract ............................................................................................................................................................... 1
Introduction ......................................................................................................................................................... 2
Purpose and Scope ..................................................................................................................................... 2
Acknowledgments ...................................................................................................................................... 4
Background ......................................................................................................................................................... 4
Habitat Requirements of Uma inornata ..................................................................................................... 4
The Fluvial System in the Coachella Valley .............................................................................................. 5
The Eolian System in the Coachella Valley ............................................................................................... 6
Methods ............................................................................................................................................................... 8
Quaternary Geologic Mapping ................................................................................................................... 8
Climatic and Hydrologic Data ................................................................................................................... 9
Delineation of Drainage and Depositional Areas ....................................................................................... 9
Fluvial Sediment Yield .............................................................................................................................. 10
The Power-Function Approach .................................................................................................................. 11
The Flood-Frequency, Rating-Curve Technique ....................................................................................... 12
Non-Contributing Drainage Areas ............................................................................................................. 13
Particle-Size Distributions ......................................................................................................................... 14
Historical Wind Energy and Direction ....................................................................................................... 14
Sand-Transport Potential ............................................................................................................................ 16
The Dune Mobility Index ........................................................................................................................... 16
Historical Changes in Eolian Deposits ....................................................................................................... 17
A Conceptual Model of the Sand-delivery System in the Northern Coachella Valley ....................................... 17
Fluvial Sediment Transport ................................................................................................................................. 19
Quaternary Geologic Units ........................................................................................................................ 19
Fluvial Sediment Yield and Delivery ......................................................................................................... 19
Eolian Transport .................................................................................................................................................. 28
Historical Wind Speed and Direction ........................................................................................................ 28
Sand-Transport Potential ............................................................................................................................ 29
Spatial Variations in Sand-transport Potential ........................................................................................... 30
Dune Mobility ............................................................................................................................................ 32
Actual Sand Transport ................................................................................................................................ 32
Historical Changes in Area of Sand Dunes ................................................................................................ 32
Linkages Between the Fluvial and Eolian Transport Systems ............................................................................ 38
Rates of Eolian Transport ........................................................................................................................... 38
Mission Creek – Morongo Wash Depositional Area ................................................................................. 39
Conclusions ......................................................................................................................................................... 40
Abbreviated Answers to Questions Posed by the U.S. Fish and Wildlife Service .................................... 41
References Cited ................................................................................................................................................. 43
Appendix 1. Descriptions of Quaternary Geologic Map Units ........................................................................... 48
Alluvial Units ............................................................................................................................................. 48
Colluvial and Eolian Deposits .................................................................................................................... 49
Appendix 2. Available Daily Stream-flow Data for the Northern Coachella Valley Through 2001 .................. 50
Contents iFIGURES
Figure 1. Map of the northern Coachella Valley .............................................................................................. 3
Figure 2. Map showing drainage areas for principle watersheds contributing fluvial sediment to the
northern Coachella Valley ................................................................................................................ 10
Figure 3. Shaded relief map of the northern Coachella Valley showing general paths of eolian transport
from areas of fluvial deposition to the Whitewater Floodplain and Willow Hole Reserves ............ 15
Figure 4. Map showing Quaternary geomorphic surfaces and deposits in the northern Coachella Valley ..... 20
Figure 5. Graph showing sediment-rating curve for the Whitewater River near Whitewater, California ....... 21
Figure 6. Shaded relief map showing the location of historic and current areas of fluvial deposition
for the San Gorgonio – Whitewater River, Mission Creek – Morongo Wash, and
Long Canyon drainages .................................................................................................................... 24
Figure 7. Ternary diagram showing sediment particle-size distributions for samples collected from
washes in the northern Coachella Valley .......................................................................................... 26
Figure 8. Graph showing climate, precipitation, and flood-frequency data for the northern
Coachella Valley ............................................................................................................................... 27
Figure 9. Rose diagram showing annual directional frequency of winds at selected sites
in the Coachella Valley ..................................................................................................................... 30
Figure 10. Graph showing variation in monthly wind speeds at Palm Springs International Airport ............... 31
Figure 12. Graph showing variation in monthly values of Drift Potential (DP) calculated from
wind data at Palm Springs International Airport .............................................................................. 31
Figure 13. Graph showing Dune Mobility Index calculated for the northern Coachella Valley ....................... 33
Figure 14. Aerial photographs showing historical changes in sedimentary deposits in the Whitewater
depositional area ............................................................................................................................... 35
Figure 15. Map showing the percent probability that any sand-transporting wind (>14.3 mi/hr)
headed directly toward the center of the Willow Hole Reserve will cross a given 10° sector
of the Mission – Morongo depositional area .................................................................................... 40
ii FiguresTABLES
Table 1. Sediment source areas for the northern Coachella Valley ................................................................ 12
Table 2. Regression equations for streamflow flood-frequency in Region 10 ............................................... 13
Table 3. List of aerial photography of the Whitewater and Willow Hole Reserves used to analyze
historical changes in eolian deposits ................................................................................................. 17
Table 4. Mean and range in annual precipitation at selected long-term stations in or near the
Coachella Valley, California ............................................................................................................. 18
Table 5. Quaternary geologic units of the Desert Hot Springs and Seven Palms Canyon 7.5’
quadrangles, California ..................................................................................................................... 19
Table 6. Estimates of sediment yield from drainages entering the northern Coachella Valley for
historic (predevelopment) and modern periods ................................................................................ 22
Table 7. Slope classes of sediment source areas and alluvial fans in the northern Coachella Valley ............ 23
Table 8. Change in depositional areas upwind of reserves in the Northern Coachella Valley ....................... 23
Table 9. Estimates of total sediment delivered to zones of deposition in the northern Coachella Valley ...... 25
Table 10. Percent of total fluvial sediment yield composed of sand sizes preferred by Uma inornata ........... 26
Table 11. Percentage frequency of winds at Palm Springs International Airport (1998-2000) ........................ 29
Table 12. Comparison of winds at Palm Springs Airport and Edom Hill ........................................................ 29
Table 13. Eolian sand transport rates in the Whitewater River floodplain ....................................................... 32
Table 14. Historical changes in the eolian environment of the Whitewater depositional area detected
in aerial photographs, 1939-1996 ..................................................................................................... 34
Table 15. Historical changes in the eolian environment of the Willow Hole area detected in aerial
photographs, 1939-1996 ................................................................................................................... 34
Table 16. Eolian depletion rates of fluvial sediment deposited in depositional areas upwind of the
Coachella Valley reserves ................................................................................................................. 39
Table 17. Percent probability that a sand-transporting wind headed toward Willow Hole will cross
each sector of the Mission Creek-Morongo Wash depositional area ............................................... 40
Tables iiiCONVERSION FACTORS AND DATUMS
CONVERSION FACTORS
Multiply By To obtain
inch (in) 25.41 millimeter
foot (ft) 0.3048 meter
yard (yd) 0.9144 meter
mile (mi) 1.609 kilometer
miles per hour (mi/hr) 1.609 kilometer per hour
knots 1.852 kilometer per hour
acre 0.4047 hectare
square foot (ft2) 0.09290 square meter
square mile (mi2) 2.590 square kilometer
cubic foot (ft3) 0.02832 cubic meter
cubic foot per second (ft3/s) 0.02832 cubic meter per second
pound, avoirdupois (lb) 0.4536 kilogram
ton, short (2,000 lb) 0.9072 megagram
ton per year (ton/yr) 0.9072 megagram per year
ton per year (ton/yr) 0.9072 metric ton per year
pound per cubic foot (lb/ft3) 16.02 kilogram per cubic meter
VERTICAL DATUM
Vertical coordinate information is referenced to the National Geodetic Vertical Datum of 1929
(NGVD 29).
HORIZONTAL DATUM
Horizontal coordinate information is referenced to the North American Datum of 1983 (NAD 83),
unless otherwise noted.
iv Conversion Factors and DatumsLong-Term Sand Supply to Coachella Valley Fringe-Toed
Lizard (Uma inornata) Habitat in the Northern Coachella
Valley, California
By Peter G. Griffiths, Robert H. Webb, Nicholas Lancaster, Charles A. Kaehler, and Scott C.
Lundstrom
ABSTRACT fluvial sediment reaching the depositional areas
upwind of Uma habitat. Also, the presence of
The Coachella Valley fringe-toed lizard roadways, railroads, and housing developments
(Uma inornata) is a federally listed threatened was thought to disrupt or redirect eolian sand
species that inhabits active sand dunes in the movement. Most of the sediment yield to the
vicinity of Palm Springs, California. The fluvial system is generated in higher elevation
Whitewater Floodplain and Willow Hole Reserves areas with little or no development, and sediment
provide some of the primary remaining habitat for yield is affected primarily by climatic fluctuations
this species. The sediment-delivery system that and rural land use, particularly livestock grazing
creates these active sand dunes consists of fluvial and wildfire. Channelization benefits sediment
depositional areas fed episodically by ephemeral delivery to the depositional plains upwind of the
streams. Finer fluvial sediments (typically sand reserves by minimizing in-channel sediment
size and finer) are mobilized in a largely storage on the alluvial fans.
unidirectional wind field associated with strong The post-development annual sediment
westerly winds through San Gorgonio Pass. The yield to the Whitewater and Mission Creek –
fluvial depositional areas are primarily associated Morongo Wash depositional areas are 3.5 and 1.5
with floodplains of the Whitewater – San million ft3/yr, respectively, covering each
Gorgonio Rivers and Mission Creek – Morongo depositional area to a depth of 0.2 to 0.4 in. Given
Wash; other small drainages also contribute fluvial existing sand-transport rates, this material could
sediment to the eolian system. The eolian dunes be depleted by eolian processes in 8 to 16 months,
are transitory as a result of unidirectional sand a rate consistent with the presence of persistent
movement from the depositional areas, which are sand dunes. However, these depletion times are
recharged with fine-grained sediment only during likely minimum estimates, as some eolian sand is
episodic floods that typically occur during El Niño seen to persist in the immediate vicinity of
years. Eolian sand moves primarily from west to depositional areas for longer time periods.
east through the study area; the period of Transport rates may be reduced by the presence of
maximum eolian activity is April through June. vegetation and other windbreaks.
Wind speed varies diurnally, with maximum Because they are perpendicular to prevailing
velocities typically occurring during the afternoon. winds, the infiltration galleries on Whitewater
Development of alluvial fans, alteration of River trap fluvial and eolian sediment, reducing
stream channels by channelization, in-stream sediment availability. Also, the presence of the
gravel mining, and construction of infiltration railroad and Interstate 10 redirect eolian sand
galleries were thought to reduce the amount of movement to the southeast along their corridors,
Abstract 1potentially eliminating the Whitewater system. This study addresses specific questions of
depositional area as a sand source for the Willow fluvial supply of fine-grained sediments to fetch areas
Hole Reserve. Using directional wind data, we upwind of two reserves in the northern Coachella
discuss the potential for eolian sand transport from Valley and eolian transport of these sediments to the
the Mission Creek – Morongo Wash depositional reserves.
area to Willow Hole.
Purpose and Scope
INTRODUCTION The objective of this project is to describe the
sand-delivery system and to quantify the sand budget
The Coachella Valley fringe-toed lizard (Uma for Coachella Valley fringe-toed lizard (Uma inornata)
inornata) is a federally listed threatened species that habitat in the northern Coachella Valley. This project
inhabits active sand dunes and their margins in the will focus on the Whitewater Floodplain Reserve and
vicinity of Palm Springs, California (fig. 1). As part of the western half of the Willow Hole – Edom Hill
the Habitat Conservation Plan for this species (Nature Reserve – referred to in this study as the Willow Hole
Conservancy, 1985), a series of reserves has been Reserve – and their sand sources, both before and after
established to benefit this species and other species that major development in the Coachella Valley. In
are restricted to active dunes and their margins. Two of particular, this study addresses the interrelations
these reserves, the Whitewater Floodplain and Willow between fluvial and eolian processes that create the
Hole – Edom Hill Reserves, are in the northern unique sand-delivery system to Uma habitat in the
Coachella Valley between the towns of Palm Springs, northern Coachella Valley and attempts to quantify
Thousand Palms, and Desert Hot Springs (fig. 1). sand transport rates.
The U.S. Fish and Wildlife Service is concerned In addition, this report addresses major questions
that flood-control and water-management structures on asked of the U.S. Geological Survey by the U.S. Fish
Whitewater River and other smaller desert washes are and Wildlife Service. These questions are:
reducing the sand supply to these reserves, potentially
• For both reserves, is the sand supply sufficient to
stabilizing the dunes and thereby degrading Uma
maintain Uma habitat in the Willow Hole and
habitat. Development of alluvial fans, alteration of
Whitewater Floodplain Reserves?
stream channels by channelization, in-stream gravel
mining, and construction of infiltration galleries were • How would channelization of Mission and
thought to reduce the amount of fluvial sediment Morongo Creeks and urban development on their
reaching the depositional areas upwind of Uma habitat. adjacent floodplains affect sand supply to both
Also, the presence of roadways, railroads, and housing reserves?
developments was thought to disrupt or redirect eolian • Do the infiltration galleries and associated
sand movement. Most of the sediment yield to the retention dikes along the Whitewater River affect
fluvial system is generated in higher elevation areas sand supply to the Whitewater Floodplain
with little or no development, and sediment yield is Reserve, and by how much? Could the design of
affected primarily by climatic fluctuations and rural the recharge ponds be modified to increase the
land use, particularly livestock grazing and wildfire. sand supply to the reserve?
Channelization benefits sediment delivery to the
depositional plains upwind of the reserves by • How much of the floodplain of the washes
minimizing in-channel sediment storage on the alluvial supplying sand upwind of the reserves has to be
fans. preserved to ensure a perpetual sand supply? What
Previous studies of sediment supply to Uma areas are essential to preserve to maintain an
habitat have generally been non-quantitative and, to a adequate sand supply and sand-transport corridor
lesser extent, divergent in their conclusions as to the for these two reserves?
long-term sand budget in the northern Coachella
Valley and how it might change given modifications to
the major watercourses that provide sand to the eolian
2 Long-Term Sand Supply to Coachella Valley Fringe-Toed Lizard Habitat in the Northern Coachella Valley, CaliforniaFigure 1. Map of the northern Coachella Valley. Inset shows details of the area including the Whitewater River and Willow Hole Reserves.
Introduction 3Acknowledgments Uma inornata was once relatively common in
the Coachella Valley, and its original range was about
The authors thank Jessica Young of the U.S. 324 mi2. By 1976, the eolian habitat available to this
Geological Survey for her contributions to the species had decreased by 27 percent to 236 mi2, and the
geographical information system (GIS) analysis of the most-suitable habitat was estimated to be only 120 mi2
drainages contributing sand to the Coachella Valley. (England and Nelson, 1976). The 1985 Habitat
Mimi Murov of the U.S. Geological Survey helped Conservation Plan (Nature Conservancy, 1985) created
considerably with the field work on this project. Daniel the Willow Hole – Edom Hill Reserve of 3.8 mi2 (2.2
Farris of the Coachella Valley Water District supplied mi2 of suitable habitat) and the Whitewater Floodplain
key wind and dredging data. Kurt Cupp of the Desert Reserve of 1.9 mi2, all of which is considered suitable
Research Institute collected and scanned the air habitat. A larger Coachella Valley Reserve (also
photographs and Ed Corbett of the Desert Research known as the Thousand Palms Reserve) was also
Institute helped with image and wind-data analysis. We created east of the study area.
thank R.R. Shroba and J.C. Matti of the U.S. The numbers of Uma inornata began decreasing
Geological Survey for helpful discussions during because of habitat destruction for a variety of human
Quaternary geologic mapping of the area. Mark Fisher uses, including agriculture, development of
of the Boyd Deep Canyon Desert Research Center subdivisions, and construction of railroads and
provided precipitation data for his facility. Van highways. The active sand dunes that are required for
Williams, also of the U.S. Geological Survey, provided Uma appear to have decreased in area, in part owing to
invaluable GIS support for the geologic mapping. The road construction, the erection of windbreaks using
manuscript was critically reviewed by Fisher, Allan non-native Tamarix trees, and modifications to stream
Muth, and Cameron Barrows, collectively known as channels; the operation of power-generating windmills
the Science Advisory Committee of the Coachella upwind may possibly have contributed to the decline
Valley Multiple Species Habitat Conservation Plan; (Turner and others, 1984). Because its habitat, which
Bill Havert of the Coachella Valley Mountain was never very large, was reduced by at least two
Conservancy; and Pete Sorensen and Ken Corey of the thirds, Uma inornata was listed as a threatened species
U.S. Fish and Wildlife Service. by the U.S. Fish and Wildlife Service in 1980. The
habitat conservation plan developed to protect this
lizard (Nature Conservancy, 1985) is often cited as a
BACKGROUND model for species preservation under the Endangered
Species Act (Barrows, 1996).
Uma inornata habitat consists of active or
Habitat Requirements of Uma inornata minimally stabilized dunes of late Holocene age or
active eolian surfaces on dunes of greater antiquity.
The Coachella Valley fringe-toed lizard (Uma The lizards may use active, relatively large barchanoid
inornata) is a sand-dwelling species that is narrowly dunes, or their habitat may consist of relatively large
endemic on active dunes and their stabilized margins in coppice mounds around mesquite (Prosopis
the northern Coachella Valley. One of its closest glandulosa), creosote bush (Larrea tridentata), or
relatives is the Mojave fringe-toed lizard (Uma other shrubs. Uma requires loose sand to create
scoparia), which is a species of special concern in burrows, and the range in b-axis diameter of sand must
California (Trepanier and Murphy, 2001). Uma fall between 0.1 and 1.0 mm with a mean of about 0.2
scoparia is endemic to eolian sand habitats in the to 0.4 mm, as reported by Turner and others (1984), or
Mojave Desert in California and western Arizona, 0.180 to 0.355 mm as reported by Barrows (1997).
particularly within eolian systems associated with the Turner and others (1984) conclude that Uma inornata
Mojave and Amargosa Rivers (Hollingsworth and may be very sensitive to minor variations in eolian
Beaman, 1999). The remaining habitat for Uma sand size. Therefore, small alterations of sand supply
scoparia is substantially larger than that of Uma may have significant effects on this species.
inornata, and Uma scoparia is not a federally listed These lizards prefer the leeward side of dunes
threatened species. and hummocks and seldom use the windward (or more
stabilized) side. However, Turner and others (1984)
4 Long-Term Sand Supply to Coachella Valley Fringe-Toed Lizard Habitat in the Northern Coachella Valley, Californiafound positive correlations with the amount of surface Coachella Valley and particularly in the surrounding
crusting on the windward sides of dunes, indicating mountainous terrain (Sharp and Nobles, 1953).
that some stabilization of dunes may be a desirable Hyperconcentrated flow, as originally defined by
attribute of Uma habitat; they note that Uma may use Beverage and Culbertson (1964) and modified by
the windward sides at night. Barrows (1997) found that Pierson and Costa (1987), contains 40 to 70 percent
sand compaction, as defined by a standardized sediment by weight. Debris flows are slurries of clay-
penetration depth, was consistently the most important to boulder-sized sediment with volumetric water
determinant of appropriate habitat for Uma; this concentration ranges from about 10 to 30 percent
species requires the deep, loose sand that generally (Pierson and Costa, 1987; Major and Pierson, 1992)
occurs only in active sand dunes as protection from and are an important sediment-transport process in a
predators and summer heat. variety of geomorphic settings throughout the world
Uma require some proximity to vegetation for (Costa, 1984).
their food supply, which suggests that the dune systems A variety of classifications has been proposed
they occupy must be relatively small or have a thin for distinguishing streamflow, “hyperconcentrated
cover of loose sand over more stable substrates flows,” and debris flows, with the most recent work
anchored by vegetation. Barrows (1997) found that focused on rheological properties (Pierson and Costa,
Uma preferred the presence of such native plant 1987) and the interactions of fluid and solid forces
species as Dicoria canescens and Atriplex canescens as (Iverson, 1997). Hyperconcentrated-flow deposits are
well as the non-native Salsola tragus. Dicoria is an differentiated from those of streamflow and debris flow
important food source, particularly in late summer by sedimentological criteria based on differences in
(Barrows, 1997). Another factor noted by Barrows particle-size distribution, sedimentary structures such
(1996) is ground-water overdraft, which may be killing as slight laminar bedding, and an overall coarse-sand,
mature Prosopis and thereby facilitating degradation of upward-coarsening texture commonly containing
coppice mounds that provide dune anchorage as well as erratic cobbles and boulders (Pierson and Costa, 1987).
negatively affecting food supplies. In this study, hyperconcentrated flow is grouped with
streamflow in calculating sediment transport in the
Coachella Valley, and the sediment contribution of
The Fluvial System in the Coachella Valley debris flows is not calculated owing to lack of
information on their occurrence.
The fluvial system in the Coachella Valley Fluvial sediment is mostly generated in the
consists of stream channels that are ephemeral headwaters areas of drainage basins within the
downslope from the mountain front and that pass mountains that surround the western and northern parts
through large, coalescing alluvial fans called bajadas. of the Coachella Valley. During infrequent floods,
These ephemeral streams, also known as washes, sediment is entrained from hillslopes and channels in
deliver sediment in flash floods that occur infrequently. the headwaters and is transported downstream into
These floods occur during large winter storms that drop channels that pass through the bajadas. Some sediment
most of their precipitation in the mountains west and is stored within channels in small terraces; during
north of the Coachella Valley (larger drainages), or larger floods, sediment is stored on the bajada surface
during intense summer thunderstorms (smaller as floodplain deposits. Sediment transported through
drainages). The last large flood on the Whitewater the bajada in the channelized washes is deposited over
River was in 1938, and most floods that occur at a broad, low-angle depositional plains, referred to in this
frequency of every 2 years or more often are relatively report as depositional areas. The largest of these areas
small and transport only small amounts of fine-grained is the Whitewater depositional area, most of which
sediments in comparison with the larger events. historically was west of Indian Avenue and south of
Streamflow is the most common sediment- Interstate 10 (fig. 1).
transport process that occurs in the washes entering the The particle-size distribution of sediments
Coachella Valley. Streamflow typically has a sediment transported by these ephemeral streams varies
concentration of less than 40 percent by weight depending on the transport process. Debris flows,
(Pierson and Costa, 1987). In addition to streamflow, which occur infrequently, transport particles ranging
“hyperconcentrated flow” and debris flows occur in the from clay to boulders; abundant debris-flow deposits
Background 5appear along the channel of Whitewater River dikes impounding the infiltration galleries trap fluvial upstream from Interstate 10 and on alluvial fans sand moving down the corridor of the Whitewater emanating from the San Jacinto Mountains. No River and prevent eolian sand from escaping. historical debris flows have been reported, however. Most sediment transported by streamflow ranges in size from sand to small gravel, with a relatively small The Eolian System in the Coachella Valley (
Lancaster (1997) used the dune mobility index to show      large part by regional and local climate and vegetation
that dunes in the Coachella Valley migrated on a           cover. Sediment supply is the presence of suitable
temporal pattern that was predicted by the index.          sediment that serves as a source of material for the
       As previously discussed, the sand supply for the    eolian transport system. It may be affected by
eolian system comes from ephemeral washes, most of         variations in flood magnitude and frequency, fluvial
which have headwaters in either the San Bernardino or      sediment-transport rates, and rates of bedrock
Little San Bernardino Mountains. Wasklewicz and            weathering at sediment source areas. Climatic changes
Meek (1995) used geochemical analyses to attempt to        impact sediment availability (the susceptibility of a
quantify the sources of sands for the Uma reserves.        sediment surface to entrainment of material by wind)
These sources are predominantly the major                  and mobility (transport rates) via vegetation cover, soil
watercourses, particularly the Whitewater River for the    moisture, and changes in the magnitude and frequency
Whitewater Floodplain Reserve and Mission Creek and        of winds capable of transporting sediment.
Morongo Wash for the Willow Hole Reserve. Floods                  Rates of eolian transport and deposition are
down these watercourses occur infrequently, leading to     affected by a number of factors. Wind fetch, or the
episodic addition of fine-grained fluvial sediments to     length of unobstructed area exposed parallel to the
the channels and alluvial fans upwind of the reserves.     wind, is the primary factor. Because the natural
       Westerly winds through San Gorgonio Pass (fig.      surfaces along the floor of the arid northern Coachella
1), which shift to northwesterly winds with distance       Valley are mostly flat with sparse perennial vegetation,
into the Coachella Valley, provide the dominant force      fetch is generally not a restriction unless anthropogenic
for moving fine-grained fluvial sediments deposited by     obstacles are present. Other factors influencing eolian
major watercourses on the valley floor into eolian         transport include wind speed and duration, availability
deposits that become Uma habitat (Lancaster and            and size fractions of sand in channel bottoms, the
others, 1993). Winds can shift to other directions         presence and dimensions of natural or artificial
during occasional thunderstorms, but these events are      windbreaks, and the density and size of natural
sporadic and very localized. Wind energy is not a          vegetation in channels and among sand dunes.
limiting factor to wind transport in this region           Lancaster and others (1993) add the factor of channel
(Lancaster, 1997). Because of the episodic nature of       entrenchment and (or) change, which decreases eolian
fluvial sediment input into the system and the high        entrainment of particles and transport out of channels.
energy of the wind regime, depletion of upwind sand        Some of these factors – particularly wind speed,
sources as well as ephemeral eolian landforms are          availability of appropriately sized sediment, channel
expected. With increasing time after fluvial deposition,   stability, and natural vegetation – are affected by
wind can erode fine sediments from both the channel        regional climatic variability on a decadal or longer time
margins and the downwind habitat, thereby depleting        scale. Other factors – particularly wind fetch – are
the source for eolian sand as well as Uma habitat.         directly affected by development and modification of
       Accumulation of eolian deposits requires: (1) a     river channels and the landscape.
source of available sediment, (2) sufficient wind                 Eolian processes transport a relatively narrow
energy to transport that sediment, and (3) conditions      range of sand sizes. In the mid-1960s, Beheiry (1967)
that promote accumulation in the depositional zone. A      found that the median diameter (D50) of eolian sand at
key principle in the understanding of eolian sand          sixteen sites in the Coachella Valley ranged from 0.09
deposits is the recognition that they occur as part of     to 0.44 mm with an average of 0.28 mm. The particle-
recognizable sediment transport systems in which sand      size distributions he measured had a bimodal
is moved from source areas (e.g., distal fluvial           component, suggesting that several sand sources were
deposits) and transported along distinct transport         being mixed in transport. The range of eolian sand
corridors to depositional sinks (Lancaster, 1995).         preferred by Uma inornata is 0.180 to 0.355 mm
       The dynamics of eolian sediment transport           (Barrows, 1997), indicating that these lizards have a
systems on any time scale are determined by the            more narrow habitat preference than what is available
relations between the supply, availability, and mobility   throughout the eolian dune fields.
of sediment of a size suitable for transport by wind              Accumulation of sand is the product of spatial
(Kocurek and Lancaster, 1999). In turn, sediment           changes in transport rates and temporal changes in
supply, availability, and mobility are determined in       sediment concentration such that:

                                                                                                        Background   7
dq dC concern, determine the domains of erosion, bypass, and
= – s +
dh
dx dt accumulation of sand. These concepts can be used to
dt (1) assess the nature of changes that may occur through
time. For example, assuming that the basic wind
where regime characteristics of an area do not vary with time,
h is the elevation of the deposition surface, changes in sediment availability from source zones and
t is time, thus the saturation level of the input will determine the
qs is the spatially averaged bulk volume behavior of the system.
sediment-transport rate, Sand depletion is considered an on-going
x is the distance along the transport problem in the northwestern part of the Coachella
pathway, and Valley because wind velocities and therefore sand-
transport rates are highest in this area and the
C is the concentration of sediment in
watercourses that supply sediment have been subjected
transport.
to considerable modification. Lancaster and others
In this model, the transport rate (qs) consists of two (1993) concluded that the northern Coachella Valley
components, a first owing to bedform migration has been strongly affected by changes in sand supply
(bedform transport, qb) and a second that is through- and transport rates through the 20th century. They note
going (qt) as a result of saltation or bedload transport. that eolian transport rates were relatively high between
The sediment concentration (C) is a measure of the 1948 and 1974, which is generally regarded as a period
total amount of sediment in transport, and can be of prolonged drought, and lower thereafter, a period
approximated by the average height of the dunes or that is relatively wet but with highly variable
other eolian bedforms (Havholm and Kocurek, 1994). conditions. Lancaster (1997) concluded that variations
Although sediment-transport rates over sandy in precipitation and perennial vegetation on dunes
surfaces are almost always at the capacity of the wind control the eolian systems in the California Deserts.
to transport sediment (sediment saturated), those over Although the extreme flood events needed to supply
other desert surfaces such as bedrock, alluvial fans, or large amounts of fine-grained fluvial sediments to
playas are frequently below transport capacity, or alluvial fans are extremely episodic, higher frequency
undersaturated or metasaturated (Wilson, 1971) variations in annual precipitation and particularly
because the sediment supply is limited. Thus actual prolonged periods of climatic shifts – to either wetter
sand transport rates (qa) may be less than potential rates or drier conditions – may strongly affect the stability of
(qp) in proportion to the ratio qa/qp, which ranges Uma habitat. In addition, development increased
between zero for completely undersaturated flows to 1 dramatically after the mid-1970s and human effects on
for fully saturated conditions. The wind is potentially trapping sand through windbreaks and altering the sand
erosional until its transport capacity is reached, supply cannot be ignored.
regardless of whether the wind is accelerating, steady,
or decelerating. Deposition occurs wherever there are
local decreases in transport capacity (e.g., deceleration METHODS
in the lee of obstacles or change in surface roughness).
The wind may still be transporting sand, as deposition
only occurs until the transport rate is in equilibrium Quaternary Geologic Mapping
with changed conditions.
Following principles of sediment-mass Geologic units of Quaternary age (last 2 million
conservation, if transport rates decrease in the direction years) were mapped for the Desert Hot Springs and
of flow, deposition will occur. If, however, sediment- Seven Palms Valley quadrangles (scale 1:24,000) as
transport rates increase, then sediment will be eroded. part of ongoing studies under the Southern California
If there is no spatial change in transport rates, then net Areal Mapping Project (SCAMP) of the U.S.
sediment bypassing will occur (Havholm and Kocurek, Geological Survey (Lundstrom and others, 2001; and
1994). The change in transport capacity in both time unpublished mapping of Lundstrom, R. Shroba and J.
and space, defined as the ratio between the potential Matti). The geology of the study area previously was
transport rate upwind and downwind of the area of mapped at a scale of 1:250,000 as compiled by Rodgers
8 Long-Term Sand Supply to Coachella Valley Fringe-Toed Lizard Habitat in the Northern Coachella Valley, California(1966), but he had little differentiation of Quaternary in Appendix 2. Streamflow data is relatively sparse in
surficial geologic units. Similarly, Proctor (1968) this region, and most records are only 10-20 years in
provided a map of the Desert Hot Springs area at a length. In addition, many of the stations on major
scale of 1:62,500 and differentiated Pleistocene units watercourses have been moved, in some cases
from Holocene but provided no subdivisions within repeatedly. The Southern Oscillation Index (SOI), the
these eras. most commonly used indicator of El Niño conditions in
Our mapping improves upon that of Proctor and the equatorial Pacific Ocean, is regularly updated on
Rodgers by using a larger scale map base as well as various web sites; for more information on this index,
differentiating the ages of geomorphic surfaces within see Webb and Betancourt (1992) and Cayan and Webb
the Pleistocene and Holocene eras and by (1992).
distinguishing the deposits by the geomorphic
processes that resulted in their deposition. Mapping
was based mostly on National Aerial Photography Delineation of Drainage and Depositional Areas
Project (NAPP) false-color infrared imagery (nominal
scale of 1:40,000) from August 18, 1989, Drainage areas of principal washes that
supplemented by National Historical Aerial contribute sediment to depositional areas upwind of the
Photography (NHAP) black-and-white imagery (scale Coachella Valley reserves were hand drawn on 7.5-
of 1:80,000) from 1984. For the Indio Hills mapping, minute topographic maps and digitized (fig. 2).
we used natural color aerial photography (scale of Drainage areas were calculated within a GIS and are
1:24,000) flown on April 9, 1999. The descriptions of given in table 1. Topographic information associated
mapping units appears in Appendix 1; readers are with the drainage areas was obtained from U.S.
referred to Birkeland (1974), McFadden (1982), and Geological Survey 30-m digital-elevation models.
Cooke and others (1993) for more information on the Predevelopment, or historic, depositional areas
use of soils geomorphology for age discrimination of were identified as late Holocene surfaces on the
geomorphic surfaces. Quaternary geologic map. Active channels and current,
or modern, depositional areas were determined by a
combination of digitization of SPOT imagery provided
Climatic and Hydrologic Data by C.W. Barrows (written commun., 2001) and field
evaluation. The Mission Creek – Morongo Wash
We analyzed existing precipitation and depositional area in particular was determined as the
hydrologic data concerning the Coachella Valley and entire area between the west splay of Mission Creek
its watercourses to evaluate the hypothesis that climatic and the east splay of Morongo Creek north of Interstate
change affects Uma habitat in three ways: (1) by 10 and south of the Banning (San Andreas) Fault (figs.
altering flood frequency, and thereby affecting 1 and 2). In March 2001, after a small flow on Mission
sediment supply; (2) by increasing landscape Creek, sediment appeared to be recently deposited
roughness by increasing the amount and size of throughout this area, indicating reasonably active
perennial native vegetation; and (3) by increasing the deposition even during modest floods. Because of these
perennial vegetation in the vicinity of dunes, leading to observations, we could not quantitatively evaluate
increased stabilization. Monthly precipitation data whether some parts of the Mission Creek – Morongo
were obtained from the Western Region Climatic Wash depositional area were more active than other
Center in Reno, Nevada (www.wrcc.edu), and the parts. In both the predevelopment and modern eras, the
University of California Philip L. Boyd Deep Canyon boundaries of the Willow Hole depositional areas are
Desert Research Center (Mark Fisher, written difficult to map at a landscape scale and we chose not
commun., 2001). Discussions of standardization to formally delineate them.
techniques for monthly and seasonal precipitation
appear in Hereford and Webb (1992).
Streamflow gaging data from the U.S.
Geological Survey were obtained from the California
District of the Water Resources Division; gaging data
availability for the northern Coachella Valley appears
Methods 9Figure 2. A. Drainage areas for principle watersheds contributing fluvial sediment to the northern Coachella Valley.
Fluvial Sediment Yield Likewise, the CREAMs and WEPP models were
developed for relatively low-slope agricultural and
Fluvial sediment yield (sediment moved by rangeland and require considerable watershed data for
rivers) was analyzed using indirect techniques because proper application. The PSIAC method involves rating
little sediment-transport data has been collected in the a watershed on the basis of nine factors related to
study area (Appendix 2). We rejected standard erosion (surface geology, soil, climate, runoff,
approaches such as the Universal Soil Loss Equation topography, land use, upland erosion, and channel
(USLE; Wischmeier and Smith, 1978; Peterson and erosion/sediment transport) to produce an estimate of
Swan, 1979), the CREAMS and WEPP models of the sediment yield. This method can be applied to large
Agricultural Research Service (Knisel, 1980; Gilley areas using pre-calculated PSIAC sediment-yield
and others, 1988), and the procedure outlined by the ratings mapped by the Soil Conservation Service (Soil
PSIAC (Pacific Southwest Inter-Agency Committee, Conservation Service, 1975). It generally produces
1968). The USLE was developed strictly for low-slope high sediment-yield estimates in arid regions of high
agricultural land and is not appropriate for the steep relief (Webb and others, 2000).
terrain of drainages entering the Coachella Valley.
10 Long-Term Sand Supply to Coachella Valley Fringe-Toed Lizard Habitat in the Northern Coachella Valley, CaliforniaFigure 2. Continued.
B. The shaded relief map is based on a 30-m digital-elevation model of the northern Coachella Valley and the San Bernardino, Little San
Bernardino, and San Jacinto Mountains. White lines indicate drainage boundaries.
The Power-Function Approach where
Qs is sediment yield in short tons per year
The power-function method of estimating fluvial (t/yr), and
sediment yield is purely empirical and uses power A is drainage area (mi2).
functions fit to empirical data (e.g., Renard, 1972).
Some approaches include more-intensive statistical
modeling (e.g., Flaxman, 1972) and deterministic In relations of this type, sediment yield typically is a
sediment-yield models that are data intensive (e.g., function of drainage area to a power close to 1.0, a
Gilley and others, 1988). In places like the Coachella nearly linear relation.
Valley, where little sediment data have been collected In the Coachella Valley, we elected to use the
(Appendix 2), the best technique is to apply an Renard (1972) equation, which, converted from units
empirical function from a similar region. For example, of volume to weight by assuming a sediment density of
from the Colorado Plateau, one estimator based on 0.0375 tons per cubic foot (t/ft3), is
regional data is of the form:
Qs = 895 . A0.88, (3)
Qs = 493 . A1.04 (2)
Methods 11Table 1. Sediment source areas for the northern Coachella Valley.
Area Mean elevation
Tributary Depositional area1
(mi2) (ft)
San Gorgonio River2 153.5 3612 San Gorgonio/Whitewater
Little Morongo Creek3 67.7 3725 Mission/Morongo
Whitewater River 59.6 5540 San Gorgonio/Whitewater
Mission Creek 38.4 5488 Mission/Morongo
Big Morongo Creek3 31.0 3988 Mission/Morongo
Long Canyon 26.3 3100 Willow Hole
Snow Canyon 19.3 5231 San Gorgonio/Whitewater
Dry Morongo Creek 10.7 3126 Mission/Morongo
Stubbes Canyon 8.4 3500 San Gorgonio/Whitewater
Cottonwood Canyon 7.5 2889 San Gorgonio/Whitewater
Garnet Wash 6.0 1407 San Gorgonio/Whitewater
Blaisdell Canyon2 6.0 3101 San Gorgonio/Whitewater
“Indio Hills”4 5.9 1132 Willow Hole
“San Bernardino 1”4 5.8 2493 n.a.
“San Bernardino 2”4 3.8 1748 n.a.
Blind Canyon 3.4 1835 Mission/Morongo
“San Jacinto 2”4 3.4 2825 San Gorgonio/Whitewater
“San Jacinto 1”4 2.4 2552 San Gorgonio/Whitewater
West Wide Canyon 1.9 2059 n.a.
1na, not applicable; sediment does not reach deposition zones.
2Upper San Gorgonio River and Blaisdell Canyon do not supply sediment in the modern setting.
3Sediment from Upper Little Morongo and Upper Big Morongo Creeks does not reach deposition zones.
4Tributary has no official name.
where Pemberton (1982). This technique requires numerous
Qs is sediment yield in short tons per year assumptions, one of the most important of which is that
(t/yr), and the decadal streamflow sediment yield in a tributary
A is drainage area (mi2). can be estimated by summing the sediment delivered
by several floods of recurrence intervals described by
Sediment yield (and therefore the sediment regional flood-frequency relations (table 6; Thomas
contribution) is estimated from the contributing and others, 1997). Accordingly, we assumed that
drainage area alone. Other factors, such as variation in sediment yield can be calculated using:
slope angle within the drainage area as well as
elevational gradients in precipitation, are very
important to sediment yield but are not considered in Qs = Σ[(m/n) . Θ(Qn)] / m, (4)
this approach because of lack of data. The Renard
equation is based on watershed data collected in the where
southwestern United States and has been successfully Θ(Qn) is the sediment yield of a nth year flood,
applied to other arid landscapes of high relief in the m is the rarest flood return period (years) in
southwest (Webb and others, 2000). the summation, and
n are the more frequent flood return
periods (years) ranging irregularly from
The Flood-Frequency, Rating-Curve Technique 2 to m.
We developed a flood-frequency, rating-curve We assumed that sediment yield could be
technique to estimate streamflow sediment yield based calculated from an expected value for the number of
loosely on the work of Strand (1975) and Strand and floods to occur in a decade. This expected value
12 Long-Term Sand Supply to Coachella Valley Fringe-Toed Lizard Habitat in the Northern Coachella Valley, Californiacontains five 2-yr floods, two 5-yr floods, and one 10- Table 2. Regression equations for streamflow flood-frequency in Region
yr flood which are thought to deliver most of the 10 (Thomas and others, 1997).
sediment in an arid region such as the Coachella
Recurrence interval Flood-frquency relation1
Valley. We assume that the annual flood does not
contribute significant sediment. Considering the 2-year flood Qp = 12A0.58
intermittent-flow regime of these tributaries, which 5-year flood Qp = 85A0.59
probably have flow less than one percent of the time, 10-year flood Qp = 200A0.62
this is likely not an egregious assumption. Also, 1Q
p = peak discharge for flood (ft3/s); A = drainage area (mi2).
regional flood-frequency relations do not produce
annual floods, so we have no means of determining the 26 floods (52 percent) peaking at 126 ft3/s (the
effect of neglecting the smallest events on ungaged maximum flood in the sediment record). Total
tributaries, and we chose not to include the influence of sediment yield for each flood event was calculated as
long recurrence-interval floods in the analysis. The the sum of all daily sediment yields for the duration of
regional-regression equations reported by Thomas and the flood. We then calculated the regression relation
others (1997) for the 2-year, 5-year, and 10-year floods between peak discharge and total event sediment yield
in Region 10 (the Southern Great Basin Region, which for each flood, resulting in an equation of the form:
includes the Coachella Valley) are listed in table 2.
In order to calculate sediment yield for an n-year
Q(Qp) = Qpa . 10b, (6)
flood, we derived two relations based on daily
sediment data collected on the Whitewater River near where
Whitewater, California (10256000). Sediment- Q(Qp) is the total sediment yield for the flood
concentration data was collected daily from October 1, in tons,
1970, to September 30, 1972, with daily streamflow
Qp is peak daily flood discharge in ft3/s, and
discharge ranging from 0.2 to 126 ft3/s (Appendix 2).
The first relation was a sediment rating curve for that a, b are coefficients determined empirically
gaging station. Owing to evidence of channel change in using regression techniques.
the sediment data, data collected prior to December 21, We used this final relation of peak discharge to total
1971, was not used to calculate the rating curve. In flood sediment yield to in the calculation of expected
addition, data for very low discharges (< 1.8 ft3/s) was annual sediment yield from each tributary as expressed
clearly non-linear with a high degree of scatter and was in (4).
also not used in the calculation of the rating curve
relation. The rating curve relation took the form of:
Non-Contributing Drainage Areas
Qd = Qa . 10b, (5)
In estimating fluvial sediment yield, it became
apparent that some drainage areas, although having the
where
potential to produce sediment, do not deliver sediment
Qd is sediment yield in short tons per year
to the main depositional areas on a regular basis. In the
(t/yr),
case of upper Little Morongo and upper Big Morongo
Q is daily discharge in ft3/s, and Washes this is a factor of topography: sediment from
a, b are coefficients determined using linear these basins is mostly trapped in the low-gradient
regression. Morongo Valley and does not reach Coachella Valley
We next calculated the relation between total (fig. 2). Other drainage areas – San Bernardino 1, Blind
event sediment yield and peak daily discharge for each Canyon, and San Bernardino 2 – are too small to
of the 50 largest floods recorded at the Whitewater generate streamflow sufficient to move sediment
stream gage. The streamflow record is much longer across the alluvial fans. This is evident from the
than the sediment record, extending from October 1, absence of significant channels or areas of Late
1948, to September 30, 1979 (Appendix 2). The 50 Holocene sediment at the mouths of these tributaries.
largest floods range between 59 and 4,970 ft3/s, with In the modern era, man-made impediments prevent the
delivery of sediment from both the upper San Gorgonio
Methods 13River, which feeds into a gravel pit near the town of representative of wind on the two reserves – Palm
Banning, and Blaisdell Canyon, which is cut off from Springs is south of the study area and is slightly south
the Whitewater depositional area by California of the main wind jet from San Gorgonio Pass, and
Highway 111 (figs. 1 and 2). Similarly, flood control Thermal is 25 miles southeast of Edom Hill and about
projects at the mountain front of the Little San 25 miles east southeast of Palm Springs International
Bernardino Mountains eliminate West Wide Canyon as Airport – but these are the only available records of
a sediment source, although whether it was ever a suitable length. Wind data collected at Palm Springs
significant source of sediment is unknown. These and Thermal from 1992 to May 2001 were analyzed.
tributaries and sub-tributaries were deemed non- These data are available from the Western Region
contributing and were not included in sediment-yield Climate Center. The Edom Hill data are of limited
estimates. extent, with only the data collected in 2001 sufficiently
complete (90 percent). Data from Edom Hill were
collected by SeaWest on the western slopes of Edom
Particle-Size Distributions Hill just east of Varner Road. These data are very well
situated for directional analysis with regard to the
To evaluate the fraction of streamflow sediment Mission Creek – Morongo Wash depositional area, but
yield that is of the appropriate particle size for use by are not applicable to any other depositional area.
Uma, we collected samples of streamflow sediment Before 1998, observations at Palm Springs were
from most of the prominent stream channels in the made only 18 hours a day (6 am-12 am) and data
study area (fig. 3). Most of these channels consisted of availability averages about 67 percent. Starting in
left and right overbank areas, which are typically February 1998, observations were made on a 24-hr
inundated during most floods, as well as the center of basis and data availability increases to about 95
the channel. In most cases, we collected samples from percent. One result of this change in instrumentation is
the left and right overbank areas as well as the center of that the magnitude of the sand drift potential changes
the channel. For sediment particle sizes, we use the significantly after February 1998 and is reduced by a
standard unit φ, defined as factor of 3.6, apparently because the new system
appears to provide generally lower hourly average wind
φ = log2 (D), (7) speeds. The other impact of this change is that there are
differences in recorded wind directions, so that the
where D is the diameter, in millimeters, of the vector direction of the sand-transport potential changes
intermediate axis, also known as the b-axis (Folk, by approximately 30°. Because of these uncertainties,
1974). After sieving and analysis, the samples were we have concentrated our analysis on the more recent
composited into one sample for each channel cross continuously recorded data that began in 1998.
section sampled. Wind directions at Palm Springs International
The samples were oven dried and sieved Airport and Edom Hill were summarized by calculating
following standard techniques (Kellerhals and Bray, the percentage of observations that fall within each of
1971; Folk, 1974) using brass sieves at 1 φ intervals the sixteen standard compass directions, such as “west”
and a rotational shaker. Particles retained on each or “west southwest.” This results a division of the
screen were weighed and the percent of the subsample compass into sixteen intervals, or sectors, of 22.5°
in each φ class determined and combined to yield a each. Frequency values were calculated for all winds
channel-averaged particle-size distribution. measured as well as for only sand-transporting winds.
Sand-transporting winds are defined as those winds
that exceed the minimum velocity necessary to
Historical Wind Energy and Direction transport sand at a given location. This threshold
velocity varies between Palm Springs and Willow Hole
The primary source of wind data used for this
owing to differences in the height at which winds are
report was the weather station at Palm Springs
measured.
International Airport; additional data were obtained for
Thermal, California and Edom Hill (fig. 1). Neither the
Palm Springs nor the Thermal stations are truly
14 Long-Term Sand Supply to Coachella Valley Fringe-Toed Lizard Habitat in the Northern Coachella Valley, CaliforniaYou can also read