Decarbonizing the Galapagos Islands: Techno-Economic Perspectives for the Hybrid Renewable Mini-Grid Baltra-Santa Cruz
←
→
Page content transcription
If your browser does not render page correctly, please read the page content below
sustainability

Article
Decarbonizing the Galapagos Islands:
Techno-Economic Perspectives for the Hybrid
Renewable Mini-Grid Baltra–Santa Cruz
Andrea A. Eras-Almeida 1, * , Miguel A. Egido-Aguilera 1 , Philipp Blechinger 2 ,
Sarah Berendes 2 , Estefanía Caamaño 1 and Enrique García-Alcalde 3
 1    Instituto de Energía Solar, ETSI Telecomunicación, Universidad Politécnica de Madrid, Av. Complutense 30,
      28040 Madrid, Spain; egido@ies-def.upm.es (M.A.E.-A.); estefan@ies-def.upm.es (E.C.)
 2    Reiner Lemoine Institut, Rudower Chaussee 12, 12489 Berlin, Germany;
      Philipp.Blechinger@rl-institut.de (P.B.); Sarah.Berendes@rl-institut.de (S.B.)
 3    Evopro Systems Engineering AG, Im Gewerbepark A52, 93059 Regensburg, Germany;
      enrique.garcia@evopro-ag.de
 *    Correspondence: andrea.eras@ies.upm.es; Tel.: +34-910672643

 Received: 15 February 2020; Accepted: 12 March 2020; Published: 14 March 2020

 Abstract: The fragile ecosystem of the Galapagos Islands is being affected by population growth,
 intensive tourism, the exploitation of local resources and the high consumption of imported fossil
 fuels. This unsustainable development model makes the provision of services such as electricity
 a challenge. This research investigates the hybrid renewable mini-grid Baltra–Santa Cruz, which
 represents 62% of the electricity generation mix of the archipelago. This study aims to support the
 Galapagos Zero Fossil Fuel Initiative and the Sustainable Development Goal 7 through the reduction
 in diesel consumption and electricity generation costs. To do so, HOMER Pro, a specialized hybrid
 renewable mini-grid planning tool, is used to perform several techno-economic assessments, focusing
 on different electricity demand scenarios. Therefore, multiple pathways are compared to identify the
 most reliable alternatives towards the progressive decarbonization of this hybrid system. The results
 indicate that installing 18.25 MWp of photovoltaic and 20.68 MWh of battery capacity could reduce
 the Levelized Cost of Electricity (LCOE) from 32.06 to 18.95 USc/kWh, increasing the renewable energy
 (RE) share from 18% to 39%. Additionally, the successful application of energy efficiency measures
 would even reduce the LCOE to 17.10 USc/kWh. What is more, distributed energy is considered
 the most attractive way to involve islanders in the energy transition process. Finally, this paper
 offers a comprehensive business model proposal to achieve a resilient energy supply, based on a
 combination of auctions and energy community models, which demands high political will, reliable
 and innovative regulations and social awareness about energy use.

 Keywords: Galapagos Islands; decarbonization; hybrid renewable mini-grid; renewable energy;
 techno-economic analysis; HOMER Pro; business models; auctions; energy community model

1. Introduction
     Achieving Sustainable Development Goal number 7 (SDG7), namely to ensure access to affordable,
reliable, sustainable and modern energy, is a global challenge which should be encouraged in order to
decarbonize the electricity supply, particularly in countries with high levels of electricity demand [1].
For islands, this is more worrying, since their size and remoteness increase electricity prices because of
the high cost of imported fuels, which limits their economic development [2,3]. Furthermore, most
islands worldwide have non-interconnected power systems based on diesel power plants [3,4], which
affects the reliability and stability of the power supply, especially under extreme weather conditions [3].

Sustainability 2020, 12, 2282; doi:10.3390/su12062282                        www.mdpi.com/journal/sustainability
Sustainability 2020, 12, 2282                                                                       2 of 47

In those contexts, the interconnection with the mainland is commonly unprofitable due to high initial
investment of submarine cable connections [2,3]. Indeed, investments in submarine connections are
higher than renewable energy (RE) implementation [5]. Despite these factors, non-interconnected
islands have a promising potential to become low-carbon economies because of their abundant RE
resources. In small islands in the Pacific, which have the highest electricity generation cost at the
regional level because of their remote location from the mainland, hybridizing diesel gensets (DGs)
is possible thanks to 3 MWp of solar photovoltaic (PV) and 5 MW of wind potential. This capacity,
combined with battery storage systems, could reduce the Levelized Cost of Electricity (LCOE) from
45.1 to 35.9 USc/kWh [6].
      Two decades ago, islands started the transition from only diesel power plants to hybrid renewable
mini-grids to meet ambitious RE targets [7]. Regarding the current prices of RE technologies, hybrid
systems are the most cost-effective solution for these territories [8]. Nevertheless, only a few islands
have achieved self-sufficiency through hybrid power systems, e.g., El Hierro and Graciosa islands,
where 100% of electricity is generated by RE resources. In these developed islands, this positive
outcome is the result of suitable policies, investment capacity, mechanisms and business models
to implement RE projects, local human resources and collective awareness about the use of energy,
keeping low growth rates of electricity demand [8]. For instance, in the Canary archipelago and in the
Graciosa island, the annual growth rate of electricity demand is 1.35% [9] and 3.9% [10], respectively.
There are others such as the Tokelau Islands with 70% of RE penetration because of their very low
electricity consumption (480 kWh/capita/year) [8]. Here, social, institutional and financial barriers
remain a concern for the implementation of RE projects [11]. On the other hand, in Martinique and
Reunion islands, RE introduction is limited to 30% due to stability issues [12,13]. In Reunion Island,
more than 60% of electricity generation comes from coal-fired and oil power plants and the electricity
consumption increases by 2.5% per year [14]. Here, technical conditions have a considerable influence
on political choices. For the least-developed islands, such as the Pacific Islands, political willingness,
the lack of funding and local capacities are major barriers for RE introduction [8]. For islands, it has
been possible to achieve high RE shares; however, more research and more specific case studies based
on techno-economic perspectives remain needed.
      The present research focuses on the hybrid renewable mini-grid of Baltra–Santa Cruz (two
interconnected islands), located in the Galapagos archipelago, 1000 km from the Ecuadorian coast
in the Pacific Ocean. Here, 82% of electricity (29 GWh) is generated by a diesel power plant, which
represents 7.9 million liters of diesel consumption [15]. The RE share is only 18% and the annual
growth rate of electricity demand is, on average, 7% (2007–2018) [16]. This value is higher than the
growth rates of the aforementioned islands, which have achieved high RE shares. In Galapagos, the
power sector is a monopoly and energy costs are highly subsidized, which affects the competitiveness
of RE technologies. For instance, the subsidized electricity generation cost is 24.31 USc/kWh, which has
not been audited to clarify the real cost [17]. Furthermore, Ecuador ranks third in terms of fossil fuel
subsidies in Latin America [18]. This represents 5.4% of the Ecuadorian Gross Domestic Product (GDP)
and 14% of the government revenues [19]. The lack of refining capacity forces Ecuador to import
diesel to generate electricity [20]. Contrary to that, flexible support mechanisms at different levels of
the energy supply chain can replace subsidies to ensure gaps in funding and the implementation of
hybrid power systems [21]. This highlights that the Galapagos Islands should diversify their energy
mix, including the exploitation of more RE resources [22] and adequate mechanisms for business [8].
Therefore, supporting the 2030 Agenda for Sustainable Development and, specifically, the achievement
of the SDG7, requires great effort and the implementation of reliable strategies. This means that
realistic techno-economic proposals and the definition of powerful partnerships are needed. Thus, the
following research questions arise in this study:

•     What is the techno-economic RE potential to support the Agenda for Sustainable Development?
•     To what extent can energy efficiency support the Agenda for Sustainable Development?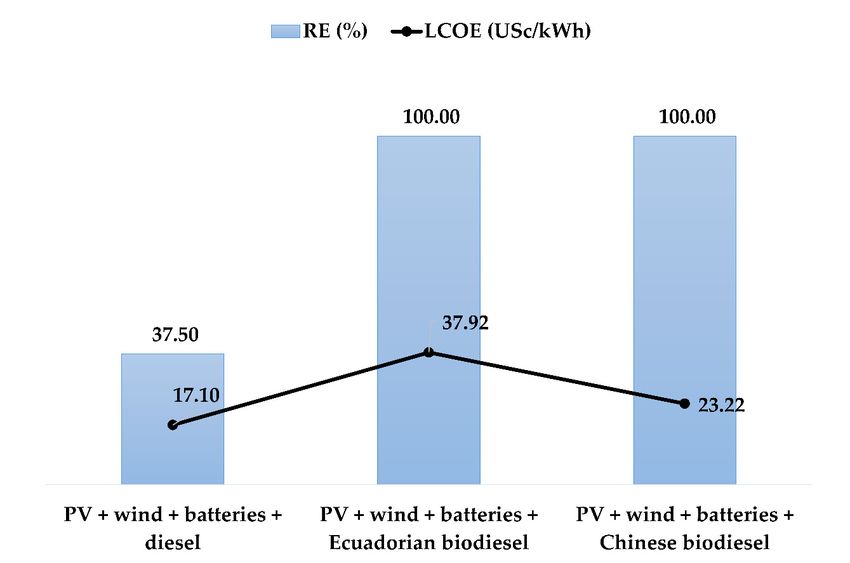
Sustainability 2020, 12, 2282                                                                          3 of 47

•     Which business models are needed to support the implementation of new RE capacities and
      energy efficiency?
     To address these issues, this research applies several techno-economic assessments to optimize
the hybridization of the Baltra–Santa Cruz power system. Likewise, the applicability of distributed
generation is evaluated in sectors with high electricity consumption. HOMER Pro, the specialized
mini-grid planning tool, is used to identify the optimal designs. HOMER is the widest simulation
and optimization tool for realistic applications [23–25], especially in far-flung areas [25]. This research
considers technical, socio-economic, environmental and political conditions of Baltra and Santa Cruz
Islands as drivers or inhibitors for RE implementation. This study contributes with a proposal to
decarbonize the hybrid system of Baltra–Santa Cruz and the identification of distributed generation
potential, increasing the RE capacity to guarantee the electricity requirements of islanders and
considering the natural and ecological conditions of the context. Furthermore, a business model is
presented to facilitate the implementation of RE power and energy efficiency means. This paper is
structured as follows: Section 2 gives an overview of the case study; Section 3 describes the data and
methodology applied. Results and discussion are presented in Section 4. Section 5 shows the business
model proposal. Finally, Section 6 presents the conclusions and policy implications.

2. Galapagos Islands Framework
      The Galapagos archipelago, formed by 19 volcanic islands and 200 islets, was recognized as a World
Heritage Site by the United Nations Educational, Scientific and Cultural Organization (UNESCO) in
1978 [26,27]. Here, 93% of the total area is protected, while the remaining is inhabited [26,28]. In 2018, the
Galapagos registered 32,000 inhabitants [29] and 276,000 tourists [30]. The average annual population
growth rate is 7% [29] and it is expected that there will be a tourism growth rate of 8% to 2030 [31].
Tourism is the most important economic activity in these islands [32], which is generating a conflict
between resource conservation and economic development [33]. This activity threatens the islands’
resilience through its effects on the economy, population growth, resource consumption, invasive species
arrival and lifestyle of residents [34]. While the Ecuadorian government, via the Government Council
for the Galapagos Special Regime (CGREG), has tried to control the demographic growth [35], the future
population growth will be linked to the tourism sector [33,35]. The main economic activities related
to tourism—accommodation, food services and commerce [26]—account for 25% of the Galapagos’
GDP ($242.7 million US) [36]. The current economic growth model based on tourism has become
unsustainable [34], which makes the provision of services, such as electricity, more challenging when
combating climate change. Only in Santa Cruz Island, the electricity consumption is approximately
1633 kWh/capita/year [16,37]. In fact, the Galapagos province presents the second-highest electricity
consumption per capita in Ecuador [38].

2.1. Energy Policies Status in the Galapagos Islands
     To preserve the fragile ecosystem of the Galapagos archipelago and to promote its sustainable
development, the Ecuadorian government launched the Zero Fossil Fuel Initiative in 2008. In the
electric power sector, this policy focuses on the replacement of fossil fuels by RE resources [39]. Thus,
the Ministry of Energy and Non-Renewable Natural Resources (MERNNR), in cooperation with donor
governments, has developed RE projects to reduce fossil fuel consumption and CO2 emissions and to
avoid fuel spill risk by maritime transportation [40]. However, this initiative lacks a clear guide for RE
implementation and environmental conservation.
     In the Galapagos Islands, the vertically integrated power sector has limited private participation by
the Electrical Sector Regime Law (1996, modified in 2010) [41] and the Organic Law of Public Electricity
Service (LOSPEE) (2015) [42]. The LOSPEE only allowed RE projects to be funded by the General
National Budget. Nevertheless, in 2019, the General Regulation of the LOSPEE [43] was published to
enable new ways of partnership for the RE sector. Thanks to this, mixed and private companies, foreign
public entities and solidarity and popular economy enterprises can receive concessions to manage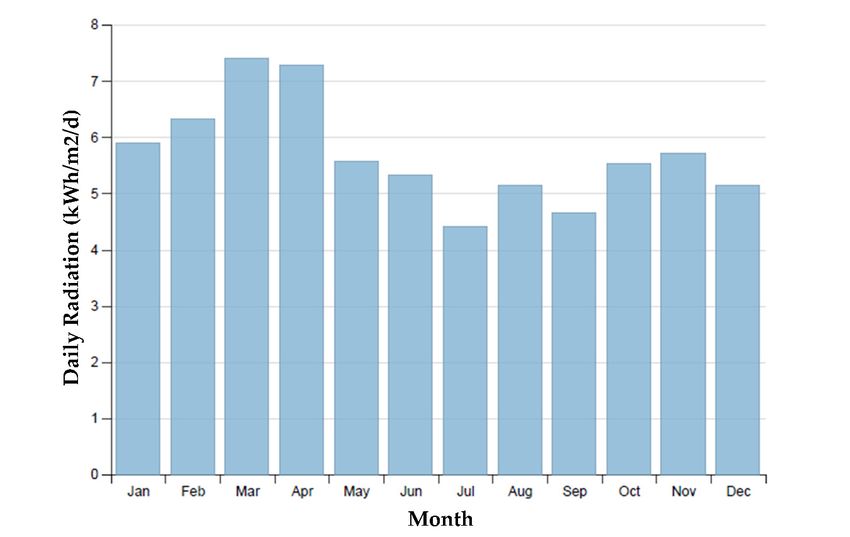
Sustainability 2020, 12, 2282                                                                        4 of 47

and implement RE projects. In addition, the Ecuadorian Electricity Master Plan (PME) 2016–2025 [44]
contains the list of priority projects to increase renewable electricity generation. Moreover, those
possible new partners can propose additional RE initiatives thanks to the General Regulation of the
LOSPEE. This regulation [43] is based on the targets of the National Plan of Development 2017–2021 [45]
which prioritize RE resources exploitation to reduce the dependency of fossil fuels. What is more, new
companies interested in developing RE projects can receive an income-tax-exemption for five years [46].
      As regards distributed generation, the photovoltaic microgeneration to electricity self-sufficiency
for final consumers of electricity regulation [47] and its amendment [48] promote the installation of PV
systems up to 300 kWp per user in the residential sector and below 1000 kWp per user in the commercial
and industrial sectors. This regulation is not limited to rooftop PV systems. A net-metering scheme
is applied to compensate electricity costs. Thanks to this mechanism, consumers are billed for their
“net” electricity use and the associated costs become credits for the following months if the electricity
balance is positive for users. [47]. The National Rate Schedule for Electricity Companies establishes
the tariff applied in the different sectors [49]. For instance, to sell electricity or purchase it from the
grid, the average tariffs applied are 9.8 and 10.30 USc/kWh in the residential and commercial sectors,
respectively [49]. The PV generator’s capacity corresponds to the annual electricity needs of users [47].
      Additionally, diverse energy efficiency measures have been adopted to reduce electricity
consumption, such as the replacement of street-lights, light-bulbs and refrigerators in the residential
sector [50]. Currently, the National Plan for Energy Efficiency [51] leads the following actions:
The adoption of the Ecuadorian Building Standard (NEC) in the residential, commercial and public
sectors; the replacement of energy-inefficient electrical appliances based on labeling schemes; and the
implementation of Energy Management Systems based on the standard ISO 50001 in public institutions
and commercial sector. These measures should help to reduce the consumption of 0.78 million barrels
of oil equivalent (MBOE) in 2035. Moreover, the Organic Law of Energy Efficiency fosters the creation
of financing incentives to channel external funds from cooperation agencies [52].
      Despite these efforts, according to the First Intended Nationally Determined Contribution (INDC)
of the Ecuadorian government to the Paris Agreement under the United Nations Framework on
Climate Change, the Galapagos Islands are becoming much more vulnerable due to negative effects
of climate change. In fact, the average temperature has increased by 1.4 ◦ C and it could be higher
than 2 ◦ C, which is the expected temperature in the mainland [53]. The Ecuadorian Ministry of
Environment (MAE) has stated the islands as a priority area to implement adaptation and mitigation
plans. Here, environmental sustainability, biodiversity conservation and appropriate management of
natural resources are key factors [54]. As in other Pacific islands [55,56], the Galapagos should redirect
their plans to develop more RE projects and attain energy identity, reflecting their own needs and
reducing fossil fuel dependency and electricity demand. Hence, energy transition must be accelerated
to reduce environmental risks on these islands.

2.2. The Electricity Generation Matrix of the Galapagos Islands
      In the Galapagos Islands, the Electricity Corporation of Ecuador (CELEC EP) manages diesel
generation and electricity transmission and the Electricity Company Galapagos ELECGALAPAGOS
manages the renewable generation and electricity distribution. Both public companies combine
electricity generation tasks through an official agreement, which allows ELECGALAPAGOS to reduce
its economic deficit, setting its operation and maintenance (O&M) costs of generation in the National
Interconnected System (SNI) [57]. In the mainland, the average cost of electricity generation is
4 USc/kWh [58]. This very low price is explained by the hydroelectricity contribution to the national
electricity mix. The hydro penetration was 90% in November 2019 [59].
      In the inhabited islands of the Galapagos, there are four isolated power systems: San Cristobal,
Baltra and Santa Cruz (two interconnected islands), Isabela and Floreana [40]. In 2018, the total
electricity supply was 57 GWh, of which 16% was produced by renewable power plants. The electricity
demand was 51 GWh and the diesel consumption was 13 million liters [15]. The difference between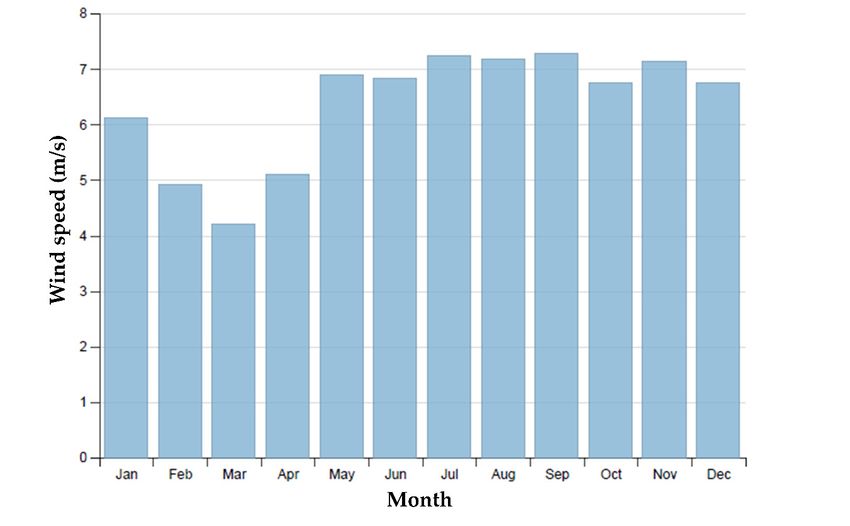
Sustainability 2020, 12, 2282                                                                            5 of 47

supply and demand corresponds to 10% of energy losses in the distribution system and 1% of the
electricity consumption of auxiliary equipment [15]. Table 1 [60] shows the power capacity installed by
technology on each island.

                        Table 1. Hybrid power system configuration of the Galapagos Islands.

                                Diesel   Wind        PV        Diesel      Biodiesel     Batteries    Total
            Island
                                (MW)     (MW)      (MWp)       (MW)         (MW)          (MWh)      (MW)
       San Cristobal             8.99     2.4                                                        11.39
     Santa Cruz-Baltra           13.9     2.25      1.57                                    4.3      17.72
          Isabela                2.63               0.95                                   0.33       3.58
         Floreana                                   0.21        0.15          0.15         0.38      0.51

      The most vulnerable Pacific islands have been depending mainly on donor countries [61]. In fact,
in the Galapagos Islands, RE investment has been covered by the national government with the support
of donor countries and international cooperation agencies. Private participation has been extremely
limited because of protectionist policies. The San Cristobal Wind Farm (2007) was supported by the
Global Sustainable Electricity Partnership (GSEP), the United Nations Foundation (UNF) and the
United Nation Development Program (UNDP). In Floreana, RE initiatives (2011) were funded by the
UNDP; the German Federal Ministry for the Environment, Nature Conservation, Building and Nuclear
Safety (BMU); the Germany International Cooperation Agency (GIZ); and the Inter-American Institute
for Cooperation on Agriculture (IICA). In Santa Cruz, the Korea International Cooperation Agency
(KOICA) co-financed the PV system of 1.5 MWp (2015). In Baltra, 67 kWp (2016) were covered by the
Japan International Cooperation Agency (JICA) and the wind farm (2014) was co-funded by the Global
Environment Facility (GEF), UNF, UNDP and GIZ. In Isabela, the hybrid renewable mini-grid is being
co-funded by the German government through the KfW Development Bank [8]. In this island, the
project aims to hybridize the thermal power generation (diesel and biodiesel). However, the biodiesel
availability, which is mainly produced in Ecuador to satisfy the fuel needs of the hybrid system Floreana,
is a big limitation because of the low production of jatropha [15].

2.3. Hybrid Renewable Mini-Grid Baltra–Santa Cruz
     In Santa Cruz, which is the island that experiences the most tourism, 61% of the population in the
archipelago resides there [30,37]. Here, implementing sustainable strategies would lead to a positive
impact on the electricity mix of the Galapagos Islands. The present research focuses on the Baltra–Santa
Cruz hybrid power system. Baltra and Santa Cruz Islands are interconnected by a transmission line of
34.5 kV and 51.4 km of cable. This interconnection consists of different segments: 20 km of overhead
cable, 21.5 km of underground cable, 900 m of submarine cable (crossing the Itabaca channel) and 9 km
of aluminum cable set up over metal poles [39]. The interconnection line connects 14 MW from Baltra
to Santa Cruz, while Baltra substation has 10 MW of capacity [62]. This infrastructure has cost $14.2
million US ($1014 US/kW installed) [39].
     Figure 1 shows the configuration of the Baltra–Santa Cruz power system. Santa Cruz has a PV
system of 1.5 MWp and a diesel power plant of 13.9 MW composed of 11 DGs. Baltra has a PV system
of 67 kWp, a wind farm of 2.5 MW (three wind turbines, each one of 750 kW) and a battery storage
system of 4.3 MWh [40]. The battery bank is hybrid, the lead-acid batteries (4.03 MWh) store the
energy surplus generated by RE systems and the lithium-ion batteries (0.268 MWh) regulate the energy
fluctuations of the wind farm [39]. This is an experimental and innovative configuration to strike
a balance between performance, size, lifetime and storage device costs [63,64]. In 2018, electricity
consumption was 32 GWh [15] and the peak demand was 7.26 MW [65]. In those islands, according to
the PME 2016–2025 [44], 9.75 MW of wind and 5.34 MWp of PV are planned to be installed by 2023,
but the projects lack financing.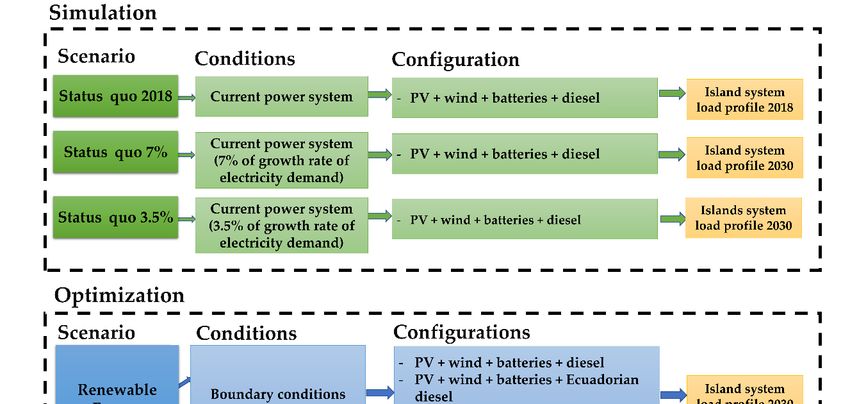
Sustainability 2020, 12, x FOR PEER REVIEW 6 of 44
Sustainability 2020, 12, 2282 6 of 47
Figure 1. Configuration of the Baltra–Santa Cruz Island system (own elaboration).
In 2018,Figure 1. Configuration
this system generatedof 35
theGWh
Baltra–Santa
and theCruz Island was
RE share system (own
only 18% elaboration).
[15]. The RE generation
represents a saving of approximately 2.6 million liters/year and a reduction of 5150 tons of CO2
In 2018,[51].
emissions this In
system generated 35
the Galapagos, GWh and
according to the
the RE share wasAgency
Ecuadorian only 18%for[15]. The RE and
Regulation generation
Control
represents a saving of approximately 2.6 million liters/year and a reduction of
of Electricity (ARCONEL), the electricity service cost is 38.84 USc/kWh, which includes the cost 5150 tons of COof2
emissions [51]. In the Galapagos, according to the Ecuadorian Agency for Regulation
electricity generation (24.31 USc/kWh) and the cost of electricity distribution (14.53 USc/kWh) [17]. and Control of
Electricity
However,(ARCONEL), the electricity
in this year alone, servicedeficit
the operational cost isof 38.84 USc/kWh,
generation, whichwhich includes
is covered the National
by the cost of
electricity generation
Interconnected System, (24.31 USc/kWh)
reached and the
$7.2 million UScost
[58].ofFurthermore,
electricity distribution (14.53
the electricity USc/kWh)
tariff [17].
is, on average,
However, in this year alone, the operational deficit of generation, which is covered
9.8 USc/kWh for residential users and 10.30 USc/kWh for commercial users [49]. The Baltra–Santa Cruz by the National
Interconnected
power system System,
is highlyreached $7.2in
subsidized million
everyUS [58].
stage of Furthermore,
the electricitythe electricity
service chain.tariff is, on average,
9.8 USc/kWh for residential users and 10.30 USc/kWh for commercial users [49]. The Baltra–Santa
Cruz power system
3. Materials is highly subsidized in every stage of the electricity service chain.
and Methods
The techno-economic analysis of the Baltra–Santa Cruz hybrid renewable mini-grid was done using
3. Materials and Methods
HOMER (Hybrid Optimization of Multiple Electric Renewables) Pro 3.13.1. This specialized mini-grid
The techno-economic
program was developed by analysis of the Renewable
the National Baltra–Santa Cruz hybrid
Energy Laboratoryrenewable
(NREL)mini-grid was done
and transferred to a
using
privateHOMER
company. (Hybrid Optimization
The software allows of oneMultiple
to design Electric
the main Renewables)
components Pro 3.13.1.
from This specialized
an energy system and
mini-grid
to simulateprogram was for
the dispatch developed
one reference by the
yearNational Renewable based
(hourly increments) Energy Laboratory
on detailed input(NREL) andas
data such
transferred to atechnology
load profiles, private company.
generation Theoptions,
software O&M allows one to design
schedules, componentthe main
costscomponents
and RE resourcesfrom [66].
an
energy system and to simulate the dispatch for one reference year (hourly
Simulation, optimization and sensitivity analysis are the tasks of this software [67]. The simulation increments) based on
detailed
analyzesinput data operation
the current such as load profiles,
of a hybrid technology
system, generation
the optimization options,
leads O&M schedules,
to the least-costly system
component
configuration costs
andandtheRE resources
sensitivity [66]. Simulation,
analysis allows one to optimization
analyze the and impactsensitivity analysis
of sensitivity are the
variables on
tasks of this software
the energy system [66]. [67]. The simulation analyzes the current operation of a hybrid system, the
optimization leadswidely
Researchers to the least-costly
use HOMERsystem configuration
to analyze and optimize and hybrid
the sensitivity analysisthat
power systems allows one to
incorporate
analyze the impactof
high introduction ofRE
sensitivity variables
technologies on theFor
in islands. energy system
instance, [66].
Demiroren and Yilmaz [68] estimated the
Researchers widely use HOMER to analyze and optimize
reduction in the LCOE using RE in Gökceada Island, Turkey. As a result, introducing hybrid power grid-connected
systems that
incorporate
wind turbines highisintroduction of RE technologies
the cost-optimized solution for in islands. For instance,
this location. PadrónDemiroren
et al. [67] and Yilmaz
assessed [68]
hybrid
estimated the reduction in the LCOE using RE in Gӧkceada Island, Turkey.
power systems for supplying electricity to Autonomous Desalination Systems (ADS) in Lanzarote As a result, introducing
grid-connected
and Fuerteventura windIslands
turbinesin is
thethe cost-optimized
Canary Archipelago. solution for this observed
The authors location. that
Padrón et al. [67]
a PV/wind/DG
assessed hybrid
combination power
is the mostsystems for supplying viable
techno-economically electricity to Autonomous
application. Kalinci [69]Desalination
concludedSystems
that the
(ADS) in Lanzarote and Fuerteventura Islands in the Canary Archipelago.
grid/wind (grid-connected) and the PV/wind/fuel cell (isolated system) are the optimum options The authors observed thatto
aprovide
PV/wind/DG combination is the most techno-economically viable
electricity to Bozcaada Island, Turkey. Ali, Shafiullah and Urmee [70] determined that application. Kalinci [69]a
concluded that the hybrid
PV/diesel/battery grid/wind (grid-connected)
system and the PV/wind/fuel
is the most economical cell (isolated
and environmentally system)
friendly are the
solution for
optimum options to provide electricity to Bozcaada Island, Turkey. Ali,
the Hulhumalé Island. What is more, regarding specific evaluations of the Galapagos Islands, in Shafiullah and Urmee [70]
determined thatthe
reference [71], a PV/diesel/battery
optimization of thehybrid system Cruz
Baltra–Santa is thepower
most system
economical and environmentally
was investigated, including
friendly solution for the Hulhumalé Island. What is more, regarding specific
induction stoves and electrical vehicles as new loads. The findings show that PV is the most feasible evaluations of the
Galapagos Islands, in reference [71], the optimization of the Baltra–Santa
alternative to satisfy an additional demand and reduce the LCOE. In reference [50], implementing Cruz power system was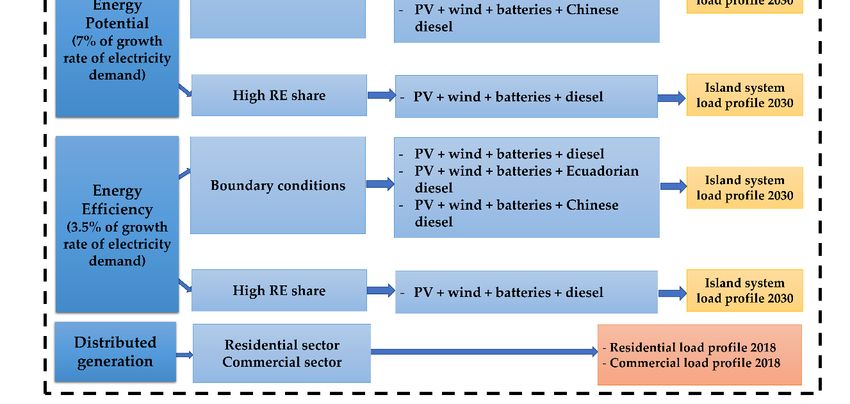
Sustainability 2020, 12, x FOR PEER REVIEW 7 of 44
investigated, including induction stoves and electrical vehicles as new loads. The findings show that
Sustainability 2020, 12, 2282 7 of 47
PV is the most feasible alternative to satisfy an additional demand and reduce the LCOE. In
reference [50], implementing a hybrid solar/biogas system was shown to be the recommendable
aconfiguration to reduce
hybrid solar/biogas fossilwas
system fuelshown
consumption
to be thein recommendable
the inhabited islands. However,
configuration to most
reduce offossil
these
studies
fuel used limited
consumption data
in the and, above
inhabited all, none
islands. of these
However, studies
most considered
of these studies local
usedconditions
limited data to and,
limit
the techno-economic assessments. Rosso-Cerón et al. [72] noted that energy
above all, none of these studies considered local conditions to limit the techno-economic assessments.planning is a classic
problem of optimization
Rosso-Cerón et al. [72] noted with
thatconstraints of investment
energy planning is a classic capacity,
problemdemand or resources.
of optimization Moreover,
with constraints
reference
of [8] identified
investment capacity, that technical,
demand socio-economic,
or resources. Moreover,environmental
reference and political limitations
[8] identified must
that technical,
be considered as
socio-economic, constraints inand
environmental energy planning.
political For instance,
limitations must be in the Galapagos
considered Islands, in
as constraints there
energyis a
conflict between
planning. protected
For instance, in theareas and the
Galapagos use of
Islands, land
there is afor RE implementation.
conflict between protected This research
areas and theis
distinguished
use of land for RE from the aforementioned
implementation. studies isbecause
This research of the from
distinguished consideration of the real studies
the aforementioned electric
power system
because constraints and
of the consideration environmental
of the conditions
real electric power system in constraints
the planning andprocess. The use conditions
environmental of the local
and
in the reliable
planninginformation
process. Theprovided
use of theby ELECGALAPAGOS
local and reliable informationguarantees
providedthebyquality of this study.
ELECGALAPAGOS
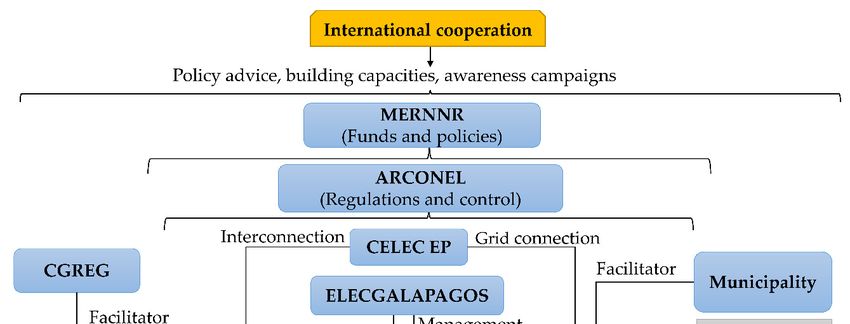
Figure 2 shows
guarantees the workflow
the quality of the
of this study. methodology
Figure 2 shows the applied
workflow based on methodology
of the the HOMER applied
tool. This section
based on
describes
the HOMERthe input
tool. Thisparameters, the energy
section describes the inputsystem model,the
parameters, the scenarios
energy systemapplied
model,and the main
the scenarios
outcomes
applied andofthe
thismain
research.
outcomes of this research.
Figure 2. The conceptual flow of the HOMER tool.
Figure 2. The conceptual flow of the HOMER tool.
3.1. Techno-Economic Information
3.1. Techno-Economic
3.1.1. Information
Renewable Energy Resources
3.1.1.InRenewable
the Galapagos Islands,
Energy solar and wind resources are complementary and negatively correlated.
Resources
This helps to overcome the most common drawbacks of hybrid energy systems: Weather, climate
change In and
thetheir
Galapagos Islands,nature
unpredictable solar[73].
andAwindrecentresources are complementary
study showed these islands as oneandofnegatively
the most
correlated.
suitable This
areas helps to
to install PVovercome
projects inthe most common
Ecuador drawbacks
[74]. Here, of hybrid
the maximum dailyenergy
Globalsystems:
HorizontalWeather,
solar
climate change and their unpredictable
2 nature [73]. A recent study showed these
Irradiation (GHI) is 7.40 kWh/m , which usually takes place in March during the dry season, while the islands as one of
the most suitable areas to install PV
2 projects in Ecuador [74]. Here, the
minimum daily GHI is 4.40 kWh/m and occurs in July [75]. On the other hand, the maximum and maximum daily Global
Horizontal
minimum solarspeed
wind Irradiation (GHI)
registered are is 7.40
7.28 kWh/m
m/s
2, which usually takes place in March during the
(cold season) and 4.20 m/s (dry season), respectively, at
adry season,
height while
of 50 m onthe minimum
Baltra Island.daily
TableGHI is 4.40 detailed
2 shows and occurs
kWh/m2 data on RE in July [75].inOn
resources thethe other hand,
territory [76].
the maximum and minimum wind speed registered are 7.28 m/s (cold
Solar and wind data were measured by ELECGALAPAGOS from 2015 to 2016 in Santa Cruz and season) and 4.20 m/sfrom
(dry
season),
2009 respectively,
to 2018 at a height Figures
in Baltra, respectively. of 50 m3 andon Baltra
4 showIsland. Tablemeteorological
the average 2 shows detaileddata data on RE
introduced
resources
in HOMER. in the territory [76]. Solar and wind data were measured by ELECGALAPAGOS from 2015
to 2016 in Santa Cruz and from 2009 to 2018 in Baltra, respectively. Figures 3 and 4 show the average
meteorological data introduced in Table
HOMER.2. Renewable energy resource.
Resource Average Min Max
Table 2. Renewable energy resource.
Daily irradiation
(kWh/m2 /day) Resource5.70 4.40
Average Min Max 7.40
Wind speed
Daily(m/s) 6.36 2/day)
irradiation (kWh/m 4.20
5.70 4.40 7.407.28
Wind speed (m/s) 6.36 4.20 7.28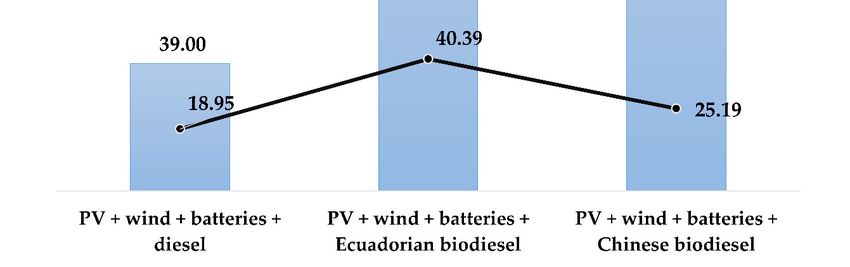
Sustainability 2020, 12, x FOR PEER REVIEW                                                                       8 of 44

 Sustainability
Sustainability  2020,
               2020, 12,12, x FOR PEER REVIEW
                         2282                                                                                    88ofof4744

                  Figure 3. Average monthly data: Global Horizontal solar Irradiation (kWh/m2/day).
               Figure 3. Average monthly data: Global Horizontal solar Irradiation (kWh/m2 /day).
                Figure 3. Average monthly data: Global Horizontal solar Irradiation (kWh/m2/day).

                                Figure 4. Average monthly data: Wind speed (m/s).
                                   Figure 4. Average monthly data: Wind speed (m/s).
3.1.2. Load Data                   Figure 4. Average monthly data: Wind speed (m/s).
    3.1.2. Load Data
      In 2018, the electricity consumption was 32 GWh in Baltra and Santa Cruz (61% of the total electricity
  3.1.2. Load
demand          Data
          Inof2018,
               the   the electricity
                    archipelago)       consumption
                                    [15].  In the samewas    32the
                                                          year,   GWh    in Baltra
                                                                     registered     anddemand
                                                                                  peak   Santa Cruz
                                                                                                  was (61%   of the
                                                                                                        7.26 MW       total
                                                                                                                   [65].
    electricity
There   are  7500demand
                   users:    of the archipelago)
                           Residential    (5905),   [15]. In
                                                  commercial the   same
                                                                 (1093,  year,  the
                                                                        including   registered
                                                                                    tourist     peak
                                                                                            sector),
       In 2018, the electricity consumption was 32 GWh in Baltra and Santa Cruz (61% of the total      demand
                                                                                                     industrial, was
                                                                                                                 street7.26
    MW and
lighting   [65].
  electricity     There (other
                 others
               demand     arethe
                          of    7500  users:include
                                  services
                                  archipelago) Residential
                                                  [15].water (5905),
                                                                same commercial
                                                             pumping,
                                                        In the             water
                                                                       year,          (1093, for
                                                                             the pumping
                                                                                  registered including
                                                                                                 rural
                                                                                              peak        tourist
                                                                                                              wassector),
                                                                                                        communities,
                                                                                                     demand         7.26
  MW [65]. There are 7500 users: Residential (5905), commercial (1093, including tourist sector),for
    industrial,
special  clients, street
                  electriclighting
                            vehicles,and   others
                                      social       (other
                                             services,     services
                                                        public        include
                                                                services, rural  water  pumping,
                                                                                 communities   and   water
                                                                                                     housingpumping
                                                                                                             religious
 industrial, street lighting and others (other services include water pumping, water pumping for
Sustainability 2020, 12, x FOR PEER REVIEW 9 of 44
rural communities, special clients, electric vehicles, social services, public services, rural
communities and housing religious groups). The residential and commercial users represent 41%
rural communities, special clients, electric vehicles, social services, public services, rural
and 42% of the electricity consumption, respectively. The industrial sector consumes 1% of the total
communities and housing religious groups). The residential and commercial users represent 41%
electricity and the 12,
Sustainability remaining
2282 portion (16%) corresponds to street lighting and other services [77].of 47
and 42% of2020,the electricity consumption, respectively. The industrial sector consumes 1% of the 9total
Figure 5 (monthly load profile) shows that the period of higher electricity consumption is from
electricity and the remaining portion (16%) corresponds to street lighting and other services [77].
December to May during the tourist season [65]. This corresponds to the dry season, which is
Figure
groups). 5 The
(monthly load and
profile) shows that the period 41%of higher electricity consumption is from
characterized byresidential
higher temperaturescommercial
and users represent
sporadic heavy rains and[54].
42% of theopposite
The electricity
is consumption,
observed
December
respectively. to May
The during
industrial Inthe tourist
sector season [65]. This corresponds to the dry season, which is
between June and November. the consumes
daily load 1% of the
profile total
(see electricity
Figure 6), theand the remaining
higher demand takesportion (16%)
place
characterized
corresponds toby higher temperatures
street other and sporadic heavy 5rains [54]. load
The profile)
opposite is observed
between 19:00 and 22:00lighting andsimulation
[65]. For services [77]. Figure
scenarios, the hourly(monthly
load profile fromshows
2018 that
was the
between June and November. In the daily load profile (see Figure 6), the higher demand takes place
introduced in HOMER. These data present a random variability of 9.68% day-to-day and 6.76%This
period of higher electricity consumption is from December to May during the tourist season [65].
between
corresponds 19:00to and 22:00
the dry [65]. For
season, simulation
which scenarios,
is characterized the hourly
by higher load profile
temperatures and from 2018heavy
sporadic was
timestep.
introduced
rains in HOMER.
[54]. The opposite These data
is observed present
betweengrowth a random
June andrate variability
November. of 9.68% day-to-day
In the dailydemand,
load profile and 6.76%
Additionally, to determine the annual of the electricity the(see Figure 6),
monthly
timestep.
the higher demand takes place between 19:00 and 22:00 [65]. For simulation scenarios, the hourly
statistical data on electricity demand from 2007 to 2018 were analyzed. Then, the result is an annual
Additionally,
load rate
profile from to determine the annual growth rate of the electricity
2018 was introduced in HOMER. These data present a random variability of 9.68% demand, the monthly
growth of 7% [16].
statistical
day-to-day data
andon electricity
6.76% demand from 2007 to 2018 were analyzed. Then, the result is an annual
timestep.
growth rate of 7% [16].
Figure 5. Monthly
Figure loadload
5. Monthly profile of Baltra–Santa
profile Cruz
of Baltra–Santa (kW)
Cruz for 2018.
(kW) for 2018.
Figure 5. Monthly load profile of Baltra–Santa Cruz (kW) for 2018.
Figure 6. Daily load profile of Baltra–Santa Cruz (kW) for 2018.
Figure 6. Daily load profile of Baltra–Santa Cruz (kW) for 2018.
Additionally, to determine the annual growth rate of the electricity demand, the monthly statistical
Figure 6. Daily load profile of Baltra–Santa Cruz (kW) for 2018.
Foron
data theelectricity
purpose of this paper,
demand from the
2007demand
to 2018 was
werealso analyzed
analyzed. as follows:
Then, the result is an annual growth rate
ofFirst,
7%For as the growth rates of population and tourism are expected to increase by 2030 (see
[16].
the purpose of this paper, the demand was also analyzed as follows:
Section 2), itthe
was assumed that paper,
the growth rate of was
electricityanalyzed
demandas would keep increasing by 7%
First, aspurpose
For of this
the growth rates of the demand
population and also follows:
tourism are expected to increase by 2030 (see
over 10 years.
First, Therefore, the hourly load profile from 2018are[65] was applied as a by
baseline(see
profile to 2),
Section 2), as the growth
it was assumedrates of population
that the growthandratetourism expected
of electricity demand to would
increase
keep2030 Section
increasing by 7%
it was assumed that the growth rate of electricity demand would keep increasing by 7%
over 10 years. Therefore, the hourly load profile from 2018 [65] was applied as a baseline profile to over 10 years.
Therefore, the hourly load profile from 2018 [65] was applied as a baseline profile to simulate the
demand to 2030, regarding the current annual growth rate of electricity demand (7%). As a result, the
electricity consumption and the peak demand would be 73.7 GWh and 16.35 MW, respectively, in 2030.Sustainability 2020, 12, 2282 10 of 47
Second, considering that the application of the National Plan for Energy Efficiency [51] would
provide successful results, a significant reduction in the annual growth rate of electricity demand
would be obtained. The estimated hypothetical value of this reduction is 3.5% (half of the current
value), which is close to growth rates from other islands, such as El Hierro and Graciosa, where
tourism plays also a crucial role in development [8]. Therefore, an hourly load profile was simulated to
2030, using a growth rate of 3.5%. Then, 49.45 GWh and 10.97 MW of electricity and peak demand,
respectively, would be supplied in 2030.
Third, as the residential and commercial sectors are major consumers in Santa and Baltra
Islands [77], the feasibility of distributed generation was analyzed, using as baseline their load profiles
from 2018. In this year, the annual electricity consumption of one residential user was, on average,
2320 kWh [78] and the commercial user consumed, on average, 12,575 kWh [79]. Both profiles present
the same characteristics as the total load profile previously described [65].
3.1.3. Existing System
Photovoltaic and Battery Systems
In Baltra, the PV system of 67 kWp, whose tilt angle is 11◦ , is composed of 252 Mitsubishi
monocrystalline silicon modules (14 series × 18 parallel), each one having 265 Wp [40]. There is a
Three-phase inverter of 100 kW. The Fuji Electric battery bank works at 448 V. There are 1344 (224 × 6)
stationary lead-acid batteries and their cell capacity is 1500 Ah at 2 V each. Likewise, there are 161
(23 × 7) lithium batteries and their cell capacity is 75 Ah at 22.2 V each. ELECGALAPAGOS controls the
state of charge (SOC) of the lead-acid batteries (4.03 MWh) between 40% and 100% to store the energy
surplus, whereas the SOC of the lithium batteries (268 kWh) is controlled between 40% and 60% to
regulated energy fluctuations [80]. The batteries have a downtime of 144 hours per year according to the
maintenance plan of ELECGALAPAGOS [81]. This PV system generates approximately 136 MWh/year,
avoiding the emission of 3600 tons of CO2 [51].
In Santa Cruz, the Puerto Ayora PV system (1.5 MWp) consists of 6006 BJ-power monocrystalline
silicon panels of 250 Wp each. The generator’s tilt angle is 6.5◦ and the performance ratio (PR) is 0.793.
There are 91 SMA Sunny Tripower Three-phase inverters (17 kW each) and each string has 22 PV
modules connected [40]. This PV system produces 2.4 GWh/year that means 1500 tons of CO2 /year are
not emitted to the environment [51].
Wind Turbine System
The Baltra wind farm (2.25 MW) consists of three UNISON U57 turbines of 750 kW each and its
Hub height is 50 m [39]. Thanks to the ELECGALAPAGOS data, the wind power curve [82] has also
been characterized in HOMER. This project generates 5.8 GWh/year, avoiding the consumption of
1.8 million liters of diesel [51].
Gensets and Fuel Consumption
In off-grid systems, gensets are expected to operate as a backup, but in the Baltra–Santa Cruz
hybrid renewable mini-grid, these components constitute the main generation system. There are four
Caterpillar DGs of 650 kW each that have a remaining life of 43,800 hours. One Caterpillar genset of
1.1 MW has a remaining life of 90,000 hours. The remaining life of six Hyundai DGs (each one of 1.7 MW)
is 90,000 hours [60]. The installation cost of a DG is approximately $340 US/kW [83]. ELECGALAPAGOS
sets the minimal loading of DGs at 25% [84,85], the value recommended by the manufactures. Following
the Maintenance Plan of ELECGALAPAGOS in 2018, one Caterpillar and every Hyundai DG are in
maintenance between 120 and 240 hours. The O&M costs of DGs are $2.5 US/hour, $4.23 US/hour,
$6.55 US/hour for 650 kW, 1.1 MW and 1.7 MW, respectively [81].
In 2018, the Baltra–Santa Cruz hybrid system consumed 7.9 million liters of diesel, equating to $1.8
million US. In the mainland, the subsidized diesel price is 24 USc/liter (including taxes) [86]. ShippingSustainability 2020, 12, 2282 11 of 47
this fuel to Baltra Island costs 12 USc/liter. Thus, the final cost of diesel is 36 USc/liter [83]. This is a low
price compared to the international market, where the fuel price is 56 USc/liter (2018) [87]. Then, the
real fuel price would be 80 USc/liter, adding taxes and shipping costs [83,88].
Biodiesel
Biodiesel (jatropha oil) was included in this study to analyze another option to optimize the
Baltra–Santa Cruz generation system. Jatropha is cultivated in Manabí, in the coastal region of
Ecuador [89]. The Ecuadorian government has tried to promote the local production of biodiesel to
reduce the dependency on diesel imports and support the homeland economy. However, the low levels
and high costs of biofuel production make it difficult to achieve this target. The amount of jatropha
available depends on the harvest and this, in turn, depends on climatic, logistical and social factors [90].
For Floreana Island, the smallest of the inhabited islands, 648 liters of biodiesel were supplied in 2018,
which represent only 1% of the total fuel consumption [15]. The biodiesel cost is $2.31 US/liter [91].
In January 2019, a minimum production of 21,900 liters of biodiesel was expected to cover less than
20% of the fuel required by the hybrid system located on Floreana island [15,92]. Despite this low
production, the national government has planned to use biodiesel to run DGs in another hybrid system
located on Isabela Island. To cover the deficit of the Ecuadorian biodiesel market, the Ministry of
Energy and ELECGALAPAGOS have started to analyze the option of importing biodiesel from China,
whose cost is $1.22 US/liter (including taxes and transport costs) [88] to replace diesel consumption.
In this research, both diesel and biodiesel (from Ecuador and China) are considered to perform
optimization assessments (see Section 3.3). The purpose is to analyze their techno-economic feasibility
to fuel gensets.
Operating Reserve
Regarding stability issues, based on the Ecuadorian Dispatch and Operation Regulation 006/00
(2000) [93], there is an operating reserve of 15% to regulate frequency and to cover system failures: 5%
of the reserve is intended to regulate the primary and secondary frequency, guaranteeing the reliability
and stability of the power system, while the remaining 10% is designed to cover large deviations in the
system, e.g., systems failures, the power output of a genset and load or renewable resource fluctuations.
In reference [2], the authors asserted that small islands should operate with a rule n-1 diesel unit to
increase the reliability of the power system. This configuration allows the system to meet the peak
load without the largest unit in operation. This statement matches with the Ecuadorian regulation [93]
and practices in terms of generation systems stability [94].
It should be emphasized that the old 006/00 stability regulation is only based on DGs. In Ecuador,
there is no specific regulation for hybrid systems that include batteries and DGs. In HOMER, 15%
of the operating reserve includes both DGs and battery storage systems [66]. Generally, the size of
a diesel power plant needs to be capable to serve the peak demand during a year [95]. However,
several studies [96–99] have demonstrated that battery energy storage systems can support black starts,
voltage and frequency regulation and supply the peak load demand. In fact, batteries can ensure that
dispatchable power is available during periods of peak demand and low RE generation [96]. What
is more, there are real-life applications on Graciosa, Lanai and Japan’s Oki islands, where battery
storage systems are used to ensure stability and integration of variable renewables [100]. This is a very
important factor for the applied scenarios, since the Ecuadorian Zero Fossil Fuel Initiative inhibits
increasing diesel-power capacity.
3.1.4. Costs
Table 3 shows the investment, replacement and O&M costs of components. In the simulation
analyses, investment prices and O&M costs of DGs and RE technologies correspond to registered costs
by ELECGALAPAGOS [81,83,101]. First, the capital costs of previous installations were included in
the simulation analysis and these were set at $0 US in the optimization process. New RE investmentSustainability 2020, 12, 2282 12 of 47
includes every cost associated with the installation such as equipment and control systems, wiring,
mounting hardware, power connection and civil work. For optimizing the island system of Baltra–Santa
Cruz, RE investment costs have been well-researched. In the international market, RE costs are much
lower than registered investment costs by ELECGALAPAGOS [81,83,101]. Indeed, there is a cost
reduction tendency for the coming years. The current PV and wind investment costs were taken from
reference [102] and batteries costs from reference [103]. Second, a recent study [104] presents the future
evolution of RE and batteries costs in Latin America. According to this study, the investment costs
of PV, wind and battery systems would be reduced by 20% in the medium term. Third, according to
the ELECGALAPAGOS expenditures, the O&M costs of RE technologies represent 1.25%/year of the
initial investment [81,83]. Thus, for the simulation and optimization processes, the replacement and
O&M costs represent 80% and 1.25%/year of the initial investment [102,103], respectively. Based on the
information provided by ELECGALAPAGOS, PV replacement cost is 40% of the capital cost alone,
discounting civil work (37%) and metal structures (3%) [105] and DG replacement cost is the same as
the capital cost [105].
Table 3. Economic values for simulation and optimization analyses.
Component Parameter Unit Simulation Optimization
Capital USD/kW 340 0
Diesel Replacement USD/kW 340 340
O&M USD/kW/hour 2.5–6.55 2.5–6.55
Capital USD/kWp 10,600 1 1210
PV Replacement USD/kWp 484 484
O&M USD/kWp/year 15 15
Capital USD/kW 4485 1500
Wind Replacement USD/kW 1200 1200
O&M USD/kW/year 19 19
Capital USD/kWh 856 300
Battery Replacement USD/kWh 240 240
O&M USD/kWh/year 3.75 3.75
Fuel Diesel USD/liter 0.8 0.8
Ecuador-biodiesel USD/liter - 2.31
China-biodiesel USD/liter - 1.22
Interconnection
Others USD/kW - 1014
Baltra–Santa Cruz
Capital USD/kW - 1432
Distributed
Replacement USD/kW - 215
generation
O&M USD/kW/year - 18
1 This investment cost has been registered and reported by ELECGALAPAGOS [101].
Table 3 also shows interconnection costs [39] and distributed energy costs [102,106] which are
applied in the scenarios described in Section 3.3.
Finally, in the simulation and optimization analyses, diesel cost was set 80 USc/liter. In the biodiesel
optimization scenarios, the cost was $2.31 US/liter or $1.22 US/liter. The project’s horizon was set
as 20 years. The discount rate was 12% [107] and the inflation rate was 0.27% [108]. The lifetime of
PV generators, wind turbines and storage systems was set as 25, 20 and 15 years, respectively. The
technologies described in Section 3.1.3 were used to perform both simulation and optimization analyses.
3.2. Energy System Model
HOMER simulated and optimized several configurations of the hybrid power system sorted
by Net Present Cost [23,67]. To do that, this software performed hundreds or thousands of hourlySustainability 2020, 12, 2282 13 of 47
simulations/optimizations, matching supply and demand, to get the optimal system [109,110] and
the least-costly option, using a proprietary derivate-free algorithm [66]. This analysis focused on
comparing a wide range of equipment (previously described), including different constraints and
sensitivities [110]. Firstly, the hybrid system was simulated to identify the real LCOE. Then, depending
on the optimization scenario, this research applied the Advanced HOMER Optimizer or the HOMER
Optimizer. The first one compares a range of capacities between upper and lower bounds, while the
second one does not involve capacity limits [66]. The main indicators are defined as follows:
3.2.1. Net Present Cost (NPC)
The NPC, which is determined in Equation (1), is defined as the present value. The total NPC of a
system is the present cost of the entire system over its lifetime, subtracting revenues. That includes
capital, replacement, O&M and fuel costs [66,111].
Cann
NPC = (1)
CRF(i, N )
where Cann is the total annualized cost (USD/year) and CRF is the capital recovery factor, given by
Equation (2).
i (1 + i)N
CRF (i, N ) = (2)
(1 + i)N − 1
where i is the annual discount rate (%) and N is the project lifetime [66].
3.2.2. Levelized Cost of Electricity (LCOE)
LCOE is the average cost per kWh of useful electrical energy produced by the system. HOMER
divides the Cann by the total electrical load served [66].
Cann
LCOE = (3)
Eserved,ACprim
where Equation (3), Eserved,ACprim is the ac primary load.
The RE potential of the hybrid system of the Galapagos Islands depends on the techno-economic
feasibility of RE technologies and DG configurations and the demand. Furthermore, CO2 emissions
result from the electricity produced by diesel generators. For the purpose of this paper, making
decisions about different scenarios focused on the LCOE, taking care of the environmental conditions
of these islands. Finally, it is worth mentioning that this paper considered a simplification on the
batteries systems due to the fact that HOMER is not able to simulate two batteries simultaneously.
The only simulated battery system considered the technical characteristics of lead-acid batteries (for
optimization analyses, the maximum depth discharge was set at 70%).
3.3. Description of Scenarios
This research performed multiple scenarios to provide reliable answers to the aforementioned
research questions. First, the Baltra–Santa Cruz hybrid system was simulated to identify the real
cost of electricity supply in 2018. Moreover, two additional simulations were performed to cover the
projected load to 2030 with a growth rate of 7% and 3.5%, respectively. Second, the power system was
optimized to cover the demand in 2030. To do so, “Renewable Energy Potential” (annual growth rate
of electricity demand 7%) and “Energy Efficiency” (annual growth rate of electricity demand 3.5%)
scenarios were applied. Furthermore, diesel capacity is not allowed to increase, according to the Zero
Fossil Fuel Initiative. Third, “Distributed Energy” scenarios were applied to offer an alternative to
the Zero Fossil Fuel Initiative due to the land use limitation and the necessity of this resource from
large-scale generation systems. Figure 7 shows the different scenarios studied. Then, to guarantee the
reliability of the optimal solutions, sensitivities analyses were carried out.Sustainability 2020, 12, x FOR PEER REVIEW 14 of 44
offer an alternative to the Zero Fossil Fuel Initiative due to the land use limitation and the necessity
Sustainability 2020, 12, 2282 14 of 47
of this resource from large-scale generation systems. Figure 7 shows the different scenarios studied.
Then, to guarantee the reliability of the optimal solutions, sensitivities analyses were carried out.
Figure 7. Simulation, optimization and distributed generation scenarios.
Figure 7. Simulation, optimization and distributed generation scenarios.
3.3.1. Status quo Scenarios
3.3.1. Status quo Scenarios
The “Status quo 2018” Scenario analyzes the Baltra–Santa Cruz Island system to estimate the
real cost“Status
The of the quo 2018” Scenario
electricity supply. Toanalyzes
do that,therenewable
Baltra–Santa Cruzresources,
energy Island system to estimate
the hourly the
demand
real cost of the electricity supply. To do that, renewable energy resources, the hourly
profile, characteristics of the current power system and economic information previously described in demand
profile,
Sectioncharacteristics of the current
3.1.3 are introduced power
in HOMER. Insystem and
2018, the economicconsumption
electricity information and
previously
the peak described
demand
inwere
Section 3.1.3. are introduced in HOMER. In 2018, the electricity consumption
32 GWh and 7.26 MW, respectively. Table 2 shows the simulation costs applied in this scenario. and the peak
demand were
In the 32 GWh
“Status quoand7%”7.26 MW, respectively.
Scenario, the electricityTable 2 shows
demand and the
the simulation
peak demand costs
areapplied
73.7 GWh in this
and
scenario.
16.35 MW, respectively. The feasibility of this scenario needs 5% of capacity shortage for simulation [112].
In “Status
In the the “Status
quoquo
3.5%”7%” Scenario,
Scenario, thethe electricity
electricity demand
demand is and
49.45the peak
GWh demand
and aredemand
the peak 73.7 GWh and
is 10.97
16.35
MW,MW, respectively.
considering The feasibility
the successful of this scenario
implementation of theneeds
National5% Plan
of capacity shortage
for Energy for simulation
Efficiency [51].
[112]. In the “Status quo 3.5%” Scenario, the electricity demand is 49.45 GWh and the peak demand
is3.3.2.
10.97Renewable Energy Potential
MW, considering Scenarios
the successful implementation of the National Plan for Energy Efficiency
[51].
Renewable Energy Potential: Boundary Conditions
Mahesh and Sandhu [73] showed that constraints are a crucial part to determine the most suitable
solution in optimization processes. However, in most cases, constraints are related to technical aspects,
e.g., installation capacity, leaving aside environmental or political concerns. On the other hand, a recentYou can also read