Blended Finance in Clean Energy: Experiences and Opportunities - Bella Tonkonogy Jessica Brown Valerio Micale Xueying Wang Alex Clark January 2018 ...
←
→
Page content transcription
If your browser does not render page correctly, please read the page content below
Blended Finance in Clean Energy:
Experiences and Opportunities

Bella Tonkonogy
Jessica Brown
Valerio Micale
Xueying Wang
Alex Clark

January 2018

A Report for the Business & Sustainable Development
Commission and the Blended Finance Taskforce
January 2018                                                                Blended Finance in Clean Energy: Experiences and Opportunities

      This working paper was commissioned by the Blended Finance Taskforce and contributes to its consul-
      tation paper “Better Finance, Better World”. The Taskforce was launched as an initiative of the Business
      & Sustainable Development Commission in 2017 to look at blended finance from a private sector per-
      spective and to see how blended finance can make the SDGs more “investable” for commercial players.
      The Taskforce is developing an action plan to rapidly scale the blended finance market in order to mobil-
      ise more private capital for the SDGs, particularly for sustainable infrastructure in emerging markets and
      would welcome your feedback.
       The Taskforce commissioned a series of working papers on blended finance (including this one) to
      contribute to this action plan. “Mobilising Institutional Capital at Scale for the Global Goals Through Blended
      Finance” was prepared by Convergence (and Tideline in an advising role) and catalogues investment
      motivations, requirements, and constraints of institutional investors in taking advantage of blended
      finance mechanisms. “Blended Finance in Clean Energy” was prepared by the Climate Policy Initiative and
      analyses opportunities where blended finance can mobilise large scale private capital for clean energy.
      “Financing Sustainable Land Use” was prepared by KOIS Invest and explores how to unlock business
      opportunities in sustainable land use with blended finance.
      All reports available at http://businesscommission.org/

      Descriptors
      Sector               Clean Energy
      Region               Developing Economies
      Keywords             Blended finance
      Contact              Bella Tonkonogy               Bella.Tonkonogy@cpiclimatefinance.org
                           Valerio Micale                Valerio.Micale@cpiclimatefinance.org

A Report for the Business & Sustainable Development Commission and the Blended Finance Taskforce                                        2
January 2018 Blended Finance in Clean Energy: Experiences and Opportunities
Acknowledgements
The authors of this report would like to acknowledge the following individuals for their valuable insights:
Abyd Karmali (Bank of America Merrill Lynch); Anouj Mehta, Frédéric Asseline and Lotte Schou-Zibell
(Asian Development Bank); Astrid Manroth (African Development Bank); Aaron Wolf and Peter David-
son (Aligned Intermediary); David Rodgers (Global Environment Facility); John Balbach (MacArthur
Foundation); Jonathan First (Development Bank of South Africa); Kruskaia Sierra-Escalante and Pranab
Ghosh (International Finance Corporation); Michael Eckhart (Citigroup); Peter Sweatman (Climate
Strategy); and Shilpa Patel (ClimateWorks).
The authors would further like to acknowledge Convergence for granting access to their database on
blended finance initiatives.
The authors also thank their colleagues Barbara Buchner, Gireesh Shrimali, Elysha Davila, Caroline
Dreyer, and Tim Varga for guidance, review, and design.
About CPI
With deep expertise in policy and finance, CPI works to improve the most important energy and land use
practices around the world. Our mission is to help governments, businesses, and financial institutions
drive growth while addressing climate risk. CPI works in places that provide the most potential for policy
impact including Brazil, Europe, India, Indonesia, and the United States.
Copyright © 2018 Climate Policy Initiative www.climatepolicyinitiative.org
All rights reserved. CPI welcomes the use of its material for noncommercial purposes, such as policy dis-
cussions or educational activities, under a Creative Commons Attribution-NonCommercial-ShareAlike 3.0
Unported License. For commercial use, please contact admin@cpisf.org.
A Report for the Business & Sustainable Development Commission and the Blended Finance Taskforce 3January 2018 Blended Finance in Clean Energy: Experiences and Opportunities
Executive Summary
The combined challenges of energy access and climate Many developing economies already offer strong envi-
change present major needs for clean energy invest- ronments for investment. Countries including Mexico,
ment. The Paris Agreement and United Nations’ Chile, Thailand, Peru, Malaysia, and China, among
Sustainable Development Goals, negotiated in 2015, others, offer strong institutions and favorable policy
represented an inflection point for moving from talk environments, which are reflected in high sovereign
to action in order to address two of the world’s most investment-grade ratings.
important challenges. The objective is clear: mobilize
investment to meet the goal of limiting global warming This report looks at what is needed to unlock invest-
to, at most, 2 degrees Celsius while also bringing elec- ment opportunities in developing economies that are
tricity to the more than 1 billion people globally who do still catching up. We evaluated, by geography and
not yet have access to it. clean energy sector, the most significant opportunities
for impact on both climate change and energy access
Within developing economies, there are significant per dollar invested; the risks and barriers that prevent
opportunities to increase investment in clean energy: investment; and how blended finance could be deployed
by 2030, non-OECD countries are projected to increase to address investor needs.
demand for electricity by 63 percent from 2014 levels
(OECD, 2017a). This nearly 7,000 terawatt hours (TWh) We find that the greatest opportunities for blended
of additional demand represents 85% of the expected finance in clean energy are in Sub-Saharan Africa and
global demand increase for that same time period (IEA, South and East Asia, with a subset of eight countries
2016). alone offering more than USD 360bn in investment
potential in clean energy by 2030 (see following bubble
chart).
High-Impact Opportunities
India
Higher
Private
Sector South Africa
Score Mongolia
Cambodia
Mozambique
Rwanda
Kenya
Uganda
Capacity targeted
250,000 MW
25,000 MW
2,500 MW
Higher Combined Energy Access and Climate Score
A Report for the Business & Sustainable Development Commission and the Blended Finance Taskforce 4January 2018 Blended Finance in Clean Energy: Experiences and Opportunities
Private investors, in particular, should note the invest- Blended finance is essential to increase private invest-
ment potential in the following: ment in critical markets, but changes to how it is
deployed would increase its success in supporting
1. Large, relatively mature geographies, such as India
global goals and mobilizing private investment. In par-
and South Africa, which offer strong renewable
ticular, we recommend to blended finance practitioners
energy policy environments and a wide variety of
that:
investment opportunities;
1. Blended finance efforts focus on the highest impact
2. Smaller countries in which grid-connected projects
opportunities. Our analysis identifies markets in
in hydro, wind, solar, and geothermal can be diversi-
Southeast Asia, Sub-Saharan Africa, and South
fied via global and regional investment vehicles; and
Asia that have high relevance for climate change
3. The nascent, yet quickly growing, distributed mitigation and energy access and broadly conducive
generation market, particularly in countries with environments for private sector investment, yet
large populations still without access to energy, ongoing needs for blended finance;
through corporate finance and securitized assets.
2. Developers of blended finance initiatives target the
Even though clean energy costs have come down signifi- most commonly cited risks to private investors; and
cantly in recent years, risks and barriers remain in these 3. Achieving scale will require, among others:
countries and are preventing investment. The top risks supporting initiatives that are ripe for expansion,
identified in our research are off-taker risk, currency as risks can remain even after a successful pilot;
risk, policy risk, and liquidity and scale risks. In addition, building sustainability through technical advisory
many early stage projects and clean energy companies services and supporting networks that generate
face barriers in accessing financing. new ideas and partnerships; and improving
We looked at 75 blended finance initiatives in clean efficiency by streamlining approval processes.
energy, diving in depth into a subset of them, to under- Many innovators are already taking these lessons and
stand how barriers are currently being addressed and building the next generation of blended finance initia-
remaining gaps. We found, among others, that: tives. Promising approaches are highlighted throughout
1. The experience to date of blended finance in the report.
clean energy offers ample successes and room for
improvement going forward;
2. As clean energy closes the “viability gap” with fossil
fuels, there is a gap between the investment risks
and barriers addressed by earlier blended finance
initiatives and those cited by investors as most
important to address going forward, with liquidity,
off-taker, and currency risks less frequently
addressed to date;
3. There is a gap between the types of instruments
most needed and those offered: risk mitigation
instruments, such as guarantees and insurance, are
less frequently offered than direct investment; there
are also major gaps in local currency financing, early
stage risk financing, and vehicles that aggregate
projects, especially small ones; and
4. The limited scale of blended finance initiatives –
both through direct investment vehicles as well as
indirect blended finance via risk mitigation – likely
limits the participation of many investors.
A Report for the Business & Sustainable Development Commission and the Blended Finance Taskforce 5January 2018 Blended Finance in Clean Energy: Experiences and Opportunities
Contents
1. Introduction 7
2. Understanding the Clean Energy Opportunity: investors and their constraints 9
2.1 Background on clean energy investing 9
2.2 Investors and their investment characteristics 10
2.3 Investor constraints: institutional Investors 10
2.4 Investor constraints: commercial banks 12
2.5 Investment risks and barriers in developing economies 12
2.6 Key takeaways from the clean energy investment landscape 14
3. High-impact Investment Opportunities and Barriers 15
3.1 Identification of high-impact opportunities 15
3.2 Analysis of key barriers and risks in the high-impact countries 17
3.3 Profiles of high-impact opportunities 18
3.4 Key takeaways from Sections 2 and 3 22
4. Mapping the Blended Finance Landscape 23
4.1 Blended Finance Rationale & Framework 23
4.2 Trends in Blended Finance for Clean Energy to Date 24
4.3 Blended Finance in the High-impact Regions and Countries 30
5. Recommendations for Scaling Up the Impact of Blended Finance in Clean Energy 31
5.1 Opportunities for investment 31
5.2 Instruments to Prioritize 31
5.3 Achieving Scale 33
6. References 35
A Report for the Business & Sustainable Development Commission and the Blended Finance Taskforce 6January 2018 Blended Finance in Clean Energy: Experiences and Opportunities
1. Introduction
The combined challenges of energy access and Blended finance instruments that address these
climate change present major needs for clean energy barriers and risks are a promising solution to increase
investment. The Paris Agreement and United Nations’ investment in clean energy.1 Blended finance is defined
Sustainable Development Goals, negotiated in 2015, in this report as “the use of public/philanthropic funds
represented an inflection point for moving from talk to mobilize multiples of additional private capital.”2
to action in order to address two of the world’s most In particular, the focus is on the use of “concessional”
pressing challenges: mobilizing investment to meet the capital—that is, capital that is extended at below market
goal of limiting global warming to, at most, 2 degrees terms—both directly within the financing structure of
Celsius, while also bringing electricity to the more than 1 an investment (or, the “capital stack”) and indirectly by
billion people globally who do not yet have access to it. using concessional capital to catalyze investment (e.g.,
through the use of a guarantee or a grant for project
While the objectives set by both agreements are preparation).3 To narrow the scope, this report does not
ambitious, falling clean energy costs bring the achieve- consider support through policy and other generalized
ment of these targets within reach. Technology costs public subsidies, such as tax credits and feed-in tariffs,
decreased by an average of 10% between 2015 and 2016, as blended finance.
with particular decreases in solar (Buchner et al, 2017).
In 2016, capacity additions in PV solar surpassed the There is already a lengthy track record of blended
growth of coal. These trends have led the International finance in clean energy. Public and philanthropic institu-
Energy Agency to revise up its forecasts of solar PV tions, including multilateral development banks such as
capacity growth by over one third from its report issued the World Bank Group, multilateral climate funds such
just last year (IEA, 2017b). The market for off-grid solar, as the Global Environment Facility, bilateral develop-
which is key to addressing lack of energy access, is also ment finance institutions such as the Netherlands’ FMO,
accelerating, though still small (SE4All, 2017). and bilateral aid agencies such as the UK’s Department
for International Development, have long experimented
However, despite both the need and the opportunity, with different approaches to mitigating or transferring
barriers remain for the main investor groups to invest risk to leverage private investment for clean energy. This
in developing economies. While institutional investors report draws lessons learned from these experiences
and commercial banks are the largest asset managers and outlines a path forward for the next generation of
globally (PPIAF, 2013), they face significant constraints blended finance in clean energy.
in investing in clean energy, and particularly in devel-
oping economies. Investors regularly express concerns
over the volatility of developing economy currencies;
the risks of policy and political change; the reliability
of renewable energy buyers, whether utilities or indi-
viduals, to pay for the services; and the lack of scale of
investments, among others (see, e.g., Frisari et al, 2013).
1 This report adopts the definition of clean energy to be consistent with the Business & Sustainable Development Commission (BSDC)’s report on Better
Business, Better World. The BSDC created the Blended Finance Taskforce, which commissioned this report. The BSDC’s clean energy definition includes
renewable energy generation, energy transmission, distribution, and storage, and carbon capture and storage. Other critical focal areas for energy-related
emissions reductions, including energy efficiency, are separate categories in the Commission’s report, and their exclusion in the present report does not imply
any difference in importance.
2 This report adopts this definition of blended finance to be consistent with the Blended Finance Taskforce, which commissioned this report.
3 This report considers public concessional investors as government grant making agencies such as bilateral aid agencies and multilateral trust funds (such as the
Green Climate Fund and Global Environment Facility). While from a private investor perspective development finance institutions (DFIs) (including multilateral
development banks, bilateral development finance institutions, and national development banks) often offer rates lower than what can be obtained in local
commercial markets – primarily due to their global/regional diversification and sovereign backing – they are not typically considered sources of “concessional”
finance as they are profit-making and self-sustaining. They require additional sources of concessional capital to deploy “blended finance”. For example, some
of them have windows, such as the World Bank Group’s International Development Association, that focus on lower income economies and are considered
concessional as they need periodic replenishment. Many also access concessional capital via the Green Climate Fund, Global Environment Facility, and
previously, the Climate Investment Funds.
A Report for the Business & Sustainable Development Commission and the Blended Finance Taskforce 7January 2018 Blended Finance in Clean Energy: Experiences and Opportunities
This report attempts to: approach in unpublished consulting work. Since
then, CPI’s Climate Finance team has strength-
1. understand the clean energy investment opportu-
ened and expanded its analytical capabilities
nity by evaluating the investors, countries, and
on risk analysis, in relation to both the tracking
technologies that are best suited to play a role in
and characterization of risks, as well as in the
mobilizing greater investment in clean energy, and
assessment of financial and non-financial
by looking at what is stopping this from happening
impacts of risks (and their mitigation) on return
(Sections 2 and 3);
metrics for different sets of public and private
2. map the blended finance landscape: the trends, stakeholders, through modeling analysis at the
lessons learned, and gaps in blended finance project and fund level;
offerings to date (Section 4); and
•• a country-level scoring system measuring the
3. recommend how blended finance can be attractiveness of potential target countries on
better deployed to meet the opportunities private sector attractiveness, and their energy
identified (Section 5). access and climate change priorities, relying on
a database with more than 23 raw data sources
The report draws heavily on:
•• current and prospective deployment data
•• previous CPI research on renewable energy on installed capacity, based on data from
policy and finance, and case study analysis Bloomberg, Platts, and REN21 country-level
(SGG case studies”);4 targets;
•• CPI learnings as Secretariat of the Global •• a database of blended finance initiatives
Innovation Lab for Climate Finance and its sister developed by CPI, and supplemented with
programs (The Lab);5 the clean energy blended finance initiatives
•• previous CPI work on Risk (Frisari et al,, 2013; catalogued by Convergence; and
Micale et al. 2013; Frisari and Micale, 2015), •• a series of investor interviews conducted for this
and subsequent expansions of the analytical project.
4 https://climatepolicyinitiative.org/sgg/publications/
5 https://www.climatefinancelab.org/
A Report for the Business & Sustainable Development Commission and the Blended Finance Taskforce 8January 2018 Blended Finance in Clean Energy: Experiences and Opportunities
2. Understanding the Clean Energy Opportunity: investors and their
constraints
This chapter summarizes the different types, char- Grid-Connected Electricity: The clean energy project
acteristics, and behavior of private investors in order lifecycle typically includes three stages: the develop-
to identify which are best suited, and thus should be ment stage, the construction stage, and the opera-
targeted, for clean energy investing, and also which tional stage, with decreasing risk as the project moves
constraints and barriers need to be overcome to unlock towards operation. Projects are typically financed either
capital. First, the chapter provides a brief background on through the balance sheets of corporate sponsors (such
different models for clean energy investing; second, the as utility companies) or through the establishment of
chapter describes the characteristics and constraints non-recourse Special Purpose Vehicles that align multi-
of different investor types regardless of geography; and ple investors(BNEF, 2016). Because of the changing risk
finally, the chapter describes and categorizes invest- and return profiles throughout the clean energy lifecy-
ment risks and barriers most prevalent in developing cle, different types of equity and debt investors are often
economies. The chapter closes with key takeaways active in different stages of the project through vehicles
and a comparison of blended finance needs for large that match their risk appetite. Figure 1 illustrates the
grid-connected electricity projects and distributed characteristics and typical participants at each stage of
generation. the clean energy project lifecycle (EMPEA, 2015).
2.1 Background on clean energy investing Distributed Generation: Distributed generation has dif-
ferent financing needs to large-scale renewable energy
Under the Sustainable Development Goals and Paris projects. Rather than a single, large source of power
Agreement, two separate, but related, objectives were with one off-taker, distributed generation more typi-
established: 1) to achieve universal energy access by cally involves multiple small-scale off-grid or mini-grid
2030 and 2) to keep global warming below 2°C (“de-car- setups serving a larger number of customers on discrete
bonization”). These twin objectives have important contracts, or a small community on a single contract
differences that affect investment and the need for through a local off-grid utility. Distributed generation
blended finance instruments. This section provides a is generally more effective in increasing households’
brief background and identifies several sources of more energy access in rural areas where grid extensions are
in-depth information. uneconomical and time-consuming (SE4All, 2017). The
relevant financing structures for dis-
Figure 1: Risk return requirements at each renewable energy project stage tributed generation are more often
Higher
based on a corporate finance model
in which the service provider seeks
Risk Capital capital to expand its operations,
Risk and
Expected rather than project financing (Expert
Return Long-term Interviews, 2017).
Profile
Yield
Lower
Project Lifecycle and Investor Point of Entry
Development stage Construction stage Operational stage
Equity Corporate investors Corporate investors Corporate investors
investor
Governments Some institutional Some institutional
Some institutional investors investors
investors (rare) Some asset managers Other asset managers
Some asset managers
Debt N/A Commercial banks Commercial banks
investor
Other investors through
bond instruments
A Report for the Business & Sustainable Development Commission and the Blended Finance Taskforce 9January 2018 Blended Finance in Clean Energy: Experiences and Opportunities
2.2 Investors and their investment Commercial banks are most suited at the construction
and operational phase, as they have a preference for
characteristics
shorter-term investments, and have only moderate
liquidity needs. Life insurance companies are most
suited at the operational phase, as they require less
The investors that are, in theory, the best fit liquidity and have a long investment horizon driven by
long-term obligations. Life insurance companies, in
to support clean energy investments include particular, are, among the various types of institutional
commercial banks, life insurance companies, investors, the best suited and most capable investors in
and defined benefit pension funds; however, renewable energy projects, and many are active partici-
each faces constraints to investing in clean pants in the project finance market. (3) Defined benefit
energy. pension plans may also be a strong fit as they are also
driven by long-term obligations and seek steady, stable
returns, but the fit for clean energy depends on the
liquidity needs of the particular pension plan. Defined
Global financial assets are held by different types of benefit plan liquidity needs are affected by the number
investors. Broadly speaking, private investors can be of retirees (who require the financial payouts) in the
classified into the following categories: institutional plan, relative to the amount of the sponsor’s contribu-
investors (pension funds, insurance companies, both life tion to the plan. Therefore, if contributions are high,
and property/casualty, endowments and foundations, relative to the retirees who seek payments, then liquid-
sovereign wealth funds), commercial banks, and other ity needs are relatively low, and such plans could be a
asset managers.6,7 Based on total assets under manage- strong fit for investing in clean energy projects or funds.
ment alone, institutional investors – specifically, insur-
ers and pensions funds – and banks from developed 2.3 Investor constraints: institutional
countries have the largest potential to unlock finance to Investors
clean energy (PPIAF, 2013). There are key constraints preventing institutional invest-
Table 1 provides a summary of the different investor ment, such as from life insurers, pension funds, and
groups and their investment profile and characteris- foundations and endowments, from flowing to clean
tics, including the total market value of assets that an energy. These constraints include:
investment company or financial institution manages on •• A mismatch in investor requirements related
behalf of investors (Asset under Management, or AUM) to liquidity, risk, and the profile of an energy
and average annual inflows. The total global AUM rep- project. The majority of institutional investors,
resents the “stock” of funds received over the years by and pension funds in particular (often a focus of
these investors (e.g., funds that have already been spent advocacy for clean energy investment), invest
on existing assets). The annual inflows figure represents primarily in traditional, typically liquid assets,
the cash inflows these investors can spend on new such as cash, bonds, publicly traded stocks,
assets each year, plus appreciation of existing assets and asset backed securities. In 2014, only 15%
under management, and are likely the most appropriate of the overall allocation went to illiquid assets
target for new clean energy investment (Reicher, Brown such as real estate, mortgages, private equity,
and Fedor, 2017).8 hedge funds, and infrastructure, according to a
study by OECD assessing the asset allocation
To narrow the universe, it is helpful to identify the
of pension funds in 34 countries (OECD, 2015).
investor groups that are “best suited” for clean energy
Even less is allocated to clean energy, which
investing, by matching the clean energy investment
typically falls within the infrastructure asset
profile with the profile and characteristics of the dif-
class.
ferent investor groups, as laid out in the table above.
6 Households are also technically a category of private investor, but are not included in the analysis here as a potential target investor group. Similarly, corporate
project developers who design, commission, operate, and maintain clean energy projects, and who invest in clean energy projects from their own balance
sheets, are not included here as this is not a targeted investor group, though such actors play a critical role in financing clean energy investments. Other
corporates, e.g., Google, who invest money into clean energy assets are included in the “other investors” category.
7 For further detail on different types of institutional investors, see Nelson and Pierpoint, 2013.
8 Note that because appreciation of existing AUM is included, the figures are likely to overstate the annual new amounts of money available.
A Report for the Business & Sustainable Development Commission and the Blended Finance Taskforce 10Table 1: Investor groups and their investment characteristics
Blended Finance in Clean Energy: Experiences and Opportunities
11
INVESTOR GLOBAL AUM AVG ANNUAL DRIVEN BY LIQUIDITY RETURN
(USD TN) (’16 INFLOW (USD HORIZON LONG-TERM REQUIRE- REQUIREMENTS / ASSET ALLOCATION THEORETICAL FIT FOR INVESTMENT IN RE
CATEGORY OR 17) TN) (‘10-15)a OBLIGATIONS MENTS RISK TOLERANCE
Insurance Dominated by fixed Active participants in RE project finance markets, given
8.7b Long Yes Low Low-Mid
– life income low liquidity/long horizon
0.2
Insurance Short to Dominated by fixed
10.1c No Mid to high Mid Back short-term policies, requiring liquidity
– property mid income
In most defined contribution plans, beneficiaries can
Mid, depen-
Allocation tilted switch in and out of investment options, generating a
Pension Funds 36.4d 1.0 Long Yes dent upon Low to mid
towards equities need for liquidity. Defined benefit funds are better suited
plan
to RE projects.e
A Report for the Business & Sustainable Development Commission and the Blended Finance Taskforce
Foundations & Tilted towards Smaller size means largely reliant on external managers;
1.1 – 1.3f n/a Long Yes Low Mid to high
endowments equities may have interest from “mission-driven” organizations
Sovereign Context Tilted towards
7.5g 0.5 Long Yes Context dependent Would need to develop expertise in RE in order to invest
wealth funds dependent equities
Can invest in shorter term, moderate liquid investments,
Commercial and
Commercial Short to and tend to be a good fit for construction phase RE
85.3h n/a No Mid to high Low consumer loans,
banks mid financing. Engaged in both corporate finance and project
gov’t securities, cash
finance, depending on the bank
Other inves- HNWI: 0.4 Context
Asset manag- Mix reflects market Funds require high liquidity to allow for investment
tors/asset Mutual funds: depen- No High Context dependent
ers: 69.2j demands switching. Liquidity needs likely preclude investment in RE
managersi 1.3 dent
a These numbers have been taken from Derisking Decarbonization: Making Green Energy Investments Blue Chip, Stanford Steyer-Taylor Center for Energy Policy and Finance. Retrieved from: https://energy.stanford.edu/
sites/default/files/stanfordcleanenergyfinanceframingdoc10-31_final.pdf. Note that these numbers are slightly outdated and come from a different source than global AUM data presented in the first column.
b Estimated based on World’s Largest Insurance Companies, GFM Asset Management (2017). Retrieved from: https://gfmasset.com/2017/10/worlds-largest-insurance-companies-top-146-listed-insurers-assets/. Note that
data includes Top 146 listed insurers by assets.
c Ibid.
d Global Pension Assets Study, Willies Towers Watson (2017). Retrieved from: https://www.willistowerswatson.com/en/insights/2017/01/global-pensions-asset-study-2017. Note that the value includes pension fund
assets in 22 major markets.
e A defined benefit plan is a retirement account in which the employer/sponsor commits to pay out at a set amount at retirement, and all investment risk is on the sponsor’s investment decisions. The strategy and
risk tolerance of the sponsor determines investment choices. A defined contribution plan, like a 401(k), requires the individual member (employee) to put in his/her own money, and investment decisions lie with the
individual rather than the plan or sponsor, but with investment options set by external investment managers and mutual funds. The performance of the investments determines how large a pension the member receives.
f Estimated by Systemiq and Convergence (personal communications).
g Largest Sovereign Wealth Funds, Sovereign Wealth Fund Institution (2017). Retrieved from: https://www.ipe.com/reports/special-reports/top-400-asset-managers/top-400-asset-managers-2016-global-assets-now-
563trn/10013542.fullarticle
h The world’s 100 largest banks, S&P Global Market Intelligence (2017). Retrieved from: https://marketintelligence.spglobal.com/our-thinking/ideas/ranking-the-world-s-100-largest-banks. Bank assets include assets of
January 2018
asset/wealth management units within banks.
i We exclude some investors that can be considered both asset managers as well as asset classes such as private equity investors, venture capital, and infrastructure funds as there would be double counting with
institutional investors. Instead these are treated as potential investment opportunities.
j The top 400 asset managers, IPE (2016). Retrieved from: https://hub.ipe.com/top-400/total-global-aum-table-2017/10007066.article. Note that there is likely some double-counting within this category, for example
pension assets can potentially be invested in mutual funds under other investors/asset managers category.January 2018 Blended Finance in Clean Energy: Experiences and Opportunities
•• A mismatch between institutional investor liquid, longer term assets require more stable
capacity and the project investment profile. funding to be available. As a result, banks must
Most institutional investors do not have the secure longer-term, higher-cost sources of
capacity to invest directly in unlisted energy funding in order to invest in long-term, illiquid
assets. Outside some of the largest institutions, assets (like energy/infrastructure projects), and
there are many factors that limit ability to invest thus creating an incentive for banks to avoid
directly, including high transaction costs, large such assets altogether. While the NSFR doesn’t
minimum ticket sizes,9 as well as the cost of come into force until 2018, banks are already
maintaining requisite deal teams. adjusting their funding profiles to meet these
requirements (Ma, 2016).
Previous CPI research indicates that the potential direct
investment in renewable energy project debt and equity •• This is reflected in shorter tenors being offered
is 1% of total assets under management of institutional for project finance loans: largely as a conse-
investors globally,10 or an estimated USD 305bn, once quence of Basel III’s NSFR, banks are increas-
accounting for short-term liquidity requirements and ingly unwilling to finance project finance with
narrow investment mandates, removing funds of insuf- long-maturity loans. The marketplace for tenors
ficient size to employ direct investing, considering strict greater than seven to ten years is shrinking,
limits on illiquid investment potential, and applying a and loan tenors above 15 years are minimal
limit on clean energy as a share of illiquid investments (Ma, 2016). This means that renewable energy
(Huxham et al, 2017). projects need to be re-financed at the end of the
original loan, introducing interest rate risk.
•• Regardless of these regulatory changes, many
commercial banks in developing countries
In order to unlock more capital, there is a are already dominated by short-term lending
need to increase investor capacity to invest outlooks. It is estimated that from 2010 to 2012,
directly in illiquid assets11 and/or repackage 49% of bank loans had a tenor of less than
one year, and only 19% of loans in developing
clean energy opportunities into standardized,
countries are over five years in duration (World
publicly tradable assets. Bank, 2015).
2.5 Investment risks and barriers in
developing economies
2.4 Investor constraints: commercial
In addition to the investor-specific constraints described
banks
above, there are additional risks and barriers that come
While commercial banks are critical investors in into play when considering investing in energy infra-
all stages of the project lifecycle, there exist some structure that are frequently amplified in developing
notable constraints that may be hindering clean energy economies, and are restricting investment. Expanding
investments: upon previous CPI work, these risks and barriers are
•• Basel III regulatory requirements for greater explored in Table 2, detailing where clean energy
liquidity and lower leverage to reduce risk have increases these risks, and at what stage in the project
unintended consequences, limiting long term lifecycle the risks are most relevant. These risks and
investment by international commercial banks. barriers can be categorized into the following four
Basel III’s “Net Stable Funding Ratio (NSFR)” macro categories: political, technical risks, commercial
effectively mandates that banks exposed to less barriers and market risks, and other investor barriers
that are not manageable or apparent at the project level.
9 To contextualize this, the average range of pension fund and insurance company investment into private equity (as a proxy for direct investment) is $13-$53
million. SWF range from $46-118 million (see WEF, 2013).
10 Note that the methodology used to derive this number is based on 2013 OECD institutional investment data, which is different (and older) data from what is
presented in Table 1. Basing the methodology off the data presented in Table 1 would likely increase the total “investable” universe.
11 Through e.g., building up clean energy deal teams, or working through intermediaries such as the Aligned Intermediary.
A Report for the Business & Sustainable Development Commission and the Blended Finance Taskforce 12Table 2: Investment risks and barriers in developing economies
RELEVANT AT WHAT
RISK CATEGORY CLEAN ENERGY RISK “ADD-ON” STAGE IN PROJECT CYCLE
DEV’T CONST’N OPER’N
POLITICAL RISKS
Projects often need to be developed
Corruption and governance risks (including repeal of in cooperation with the public sector
contracts), legal and ownership rights infringements Social resistance tends to be high for
Political and social risks X X X
risks (risk of property expropriation; ownership claims); large hydro projects
and social risks (social opposition/violence) Corruption risks are considered lower
for clean energy
Some RE technologies (wind, hydro,
Administrative risks Permitting delays, denial or repeal; Forced relocation Concentrated Solar) are highly X X
site-specific
Less mature RE technologies often
Policy / Regulatory risks Change of support to tariffs or level of subsidization X X X
rely on public support
TECHNICAL RISKS
Construction delays and Relate to uncertainty over the timing of construction and Increased risk due to novelty of some
X
risks sub-standard construction. technologies
Upstream risks such as the availability of material and
Upstream resources-re-
workforce, uncertainty over the effective availability of Increased for geothermal exploration X X
lated risks
natural resource on the specific site.
Risks related to technical operations in the plant,
Operation risks and other Increased risk due to novelty of some
catastrophe risks impacting on project, and environmen-
downstream output-re- technologies, natural variability of X
tal risks resulting from project activities (e.g., potential
lated risks outputs
clean up liabilities)
COMMERCIAL BARRIERS
Potentially higher if market/technol-
Access to Capital (bank- All relate to risks for the project developer to access ogy is unfamiliar to capital provider;
X X X
ability of investment)a capital and cost of capital for financing /re-financing increased due to long investment
horizon typical of RE projects
Market-specific con- Relate to uncertainties in project-related investment,
Increased risk due to novelty of some
struction, financial, and financial and operation costs related to the particular X X
technologies
operation costs increase technology
Related to unfavorable currency fluctuations occurring
when projects are financed with loans in foreign cur-
Currency Risk rency but have revenues in local currency. Can also relate No additional risk X X
to the availability in a country of foreign currency to pay
back investors
Refers to the inability of counterparties to honor con-
Counterparty / Offtaker / Potentially higher due to lack of
tracted obligations due to lack of enforceable collateral X
Credit Risk established investment networks
or unreliable counterparties
Revenues Attractiveness Low attractiveness and uncertainty on realized output High risk due to long horizon of
X
and Volatility price; excessive market volatility, lack of demand investments
OTHER INVESTOR BARRIERS (NON-MANAGEABLE AT PROJECT LEVEL)
Refers to uncertainties about the realized value when High, as investments in clean energy
Investment Horizon/
monetizing the investment before end of asset’s lifecycle tend to have long time horizons and X
liquidity
(for equity sponsors), or maturity of loans (for lenders) there has been little securitization
Size of investment needs to be appropriate to match Clean energy projects often not large
Scale of investment X X X
investor profiles enough
High, as specialized knowledge is
Lack of capacity at local Lack of capacity and resources at local level can limit the
involved, local understanding likely to X X
level ability to identify a suitable pipeline of projects
be low
See Frisari et al, 2013 and Micale et al, 2013 for an earlier version
a Whiie access to capital is a major barrier to project developers, there is a corresponding barrier on the side of the investor, who may not be able to identify a bankable
pupeline of projects that matched their investment requirements (e.g. size of the project, investment horizon). See next section on (non-developer) constraints for more
information.January 2018 Blended Finance in Clean Energy: Experiences and Opportunities
likely to remain limited. However, securitization and
other liquidity solutions, alone, will not address several
The most prominent risks and barriers pre- other relevant risks that require attention and mitiga-
venting scaling up of private investment in tion. Thus, liquidity solutions aside, blended finance is
critical to address the multitude of risks and barriers
clean energy in developing economies are
that are currently preventing clean energy investment
off-taker risk, currency risk, policy risk, the through any channel.
attractiveness of revenues, liquidity risk, and
size/scale mismatches.12 Table 3 summarizes the investment profiles and blended
finance needs of grid-connected electricity and distrib-
uted generation products.
The lack of access to early stage risk Table 3: Understanding investment opportunities in grid-connected electricity vs distributed
financing, for both grid-connected generation
projects and distributed generation FEATURE GRID-CONNECTED ELECTRICITY DISTRIBUTED GENERATION
companies, has also been highlighted
repeatedly. These risks and barriers Primarily off-grid or mini-grid
are helpful to inform what is needed in clean energy helping to bring
De-carbonization: helping to
terms of blended finance instruments. electricity access to new cus-
Primary impact reduce existing or planned car-
tomers without generating new
bon-intensive generation
2.6 Key takeaways from the GHG emissions; can also include
clean energy investment grid-connected electricity
landscape Medium (10-50MW)
Project size Small (50MW)
While clean energy appears to be a
suitable match for a number of inves- Onshore wind Solar home systems
tors, in particular life insurance com- Offshore wind Rooftop solar
panies, defined benefit pension plans, Solar PV Bioenergy generators
and commercial banks, uptake is limited Concentrated solar Clean cookstoves
given constraints related to limitations Relevant
Hydro Solar lanterns
inherent to investor asset allocation technologies
Geothermal Mini-grids
processes, and their preference for more
Carbon capture and storage Mobile payment
liquid, low risk investments.
Energy storage Small hydro
In the near term, blended finance tools Rooftop solar Energy storage
can focus on reducing risk in devel-
Commercial Banks
oping economies to attract existing
Venture Capital/Private Equity
institutional investor allocations for less Institutional investors
liquid, non-tradeable assets, as well as Target private Households
Asset managers
to increase the flow from commercial sector investors Corporations
Commercial Banks
banks, particularly local banks. In the Other asset managers (for securi-
longer term, a shift towards the devel- tized products)
opment of investment-grade tradable Project finance Corporate finance – equity and
instruments will be critical to reach a Financing
Corporate finance (e.g., via project debt, often to small and medi-
broader pool of institutional investors, structure
sponsors) um-sized enterprises (SMEs)
as the availability of institutional invest-
ment in non-standard asset classes is Currency risk
Upfront costs
Political risk
Lack of risk assessment capacity
Regulatory/policy risk
Access to finance (especially early
Primary invest- Off-taker risk
stage)
ment barriers Construction risk
Payment risk (individual)
Access to finance (especially early
12 Based on previous CPI work, interviews conducted, Technology risk
and literature reviewed. stage)
Liquidity
Liquidity
A Report for the Business & Sustainable Development Commission and the Blended Finance Taskforce 14January 2018 Blended Finance in Clean Energy: Experiences and Opportunities
3. High-impact Investment Opportunities and Barriers
In this section, we look at which geographies and tech- •• the minimum level of attractiveness for the
nologies are most promising from both an investment private sector was set to 0.5 of the private
and impact perspective, and are most likely to benefit sector score (within a 0-1 range),18 while the
from blended finance support. We then consider the aggregate final impact of investment was
risks and barriers investors face in investing in these estimated by combining climate relevance19 and
geographies and technologies. energy access relevance20 scores.
We identified potential markets for high-impact invest- Finally, we calculated the investment opportunity for
ment opportunities requiring blended finance support the countries identified by applying regional or country
by examining 140 developing economies. As a starting specific capital costs of technologies to the planned and
point, we looked at those countries that are not classi- targeted capacity in megawatts (MW).
fied as investment grade, as achieving investment grade
is indicative of strong enough institutional environments Please see our detailed methodology in Annex 1 for
in which blended finance should not be required, except specifics on the raw data and sub-indicators used, and
in very specific circumstances.13 From the sub-set of how they were weighted and rescaled when aggregating
non-investment grade countries, we selected countries them into a score, as well as on the country-specific
that scored well in terms of being the most attractive for assumptions used for calculating investment estimates.
private sector investment, and reached at least 500 MW
in projected planned and targeted capacity for renew-
3.1 Identification of high-impact
able energy sectors. opportunities
We then ranked the 46 countries that met the above-
mentioned criteria by their energy access and climate
change relevance scores, indicative of the marginal Sub-Saharan Africa, South Asia, and East
impact that a dollar invested in such countries in clean Asia & Pacific are the three regions that pres-
technologies would have in increasing the quality of ent the most significant investment oppor-
energy access and addressing climate change.
tunities in both energy access and climate
More specifically: change mitigation.
•• investment grade countries were considered
as those scoring 60 or more on the Trading
Economics index14
Our analysis shows that Sub-Saharan African coun-
•• projected untapped capacity was estimated tries and East Asia & Pacific countries in lower-middle
considering current deployment vis-à-vis income groups have higher potential in terms of energy
planned deployment and country targets access improvements. In terms of climate change
by 2030 (BNEF,15 PLATTS World Electric impact, East Europe & Central Asia, Middle East &
Power Plant Database,16 REN2117 and IRENA). North Africa, and South Asia in the low to lower-middle
Renewable energy sectors considered included income range, as well as Sub-Saharan Africa and East
Solar, Wind, Hydro, Geothermal, Biomass, and Asia & Pacific countries in the upper/middle income
Tidal energy group show high potential. These results are consistent
13 This assumption was supported in stakeholder interviews for this project. We exclude from the analysis investment grade countries with significant relevance
to meeting global goals, such as China, because in our view these should not be priorities for blended finance.
14 Trading Economics Index – Credit Rating. Accessed October 2017. https://tradingeconomics.com/country-list/rating
15 Bloomberg New Energy Finance Database. Accessed October 2017. https://www.bnef.com/core/market-size?tab=Capacity
16 S&P Global Platts World Electric Power Plants Database, June 2017, Accessed October 2017. https://www.platts.com/products/world-electric-power-plants-
database
17 REN21. 2017. “Renewables 2017: Global Status Report.” http://www.ren21.net/wp-content/uploads/2017/06/17-8399_GSR_2017_Full_Report_0621_Opt.pdf
18 Private sector score is based on a country’s Market potential, Access of foreign investment, Access of private investment, Access to affordable credit, Loan
repayment risk (attractiveness of), Country risk (attractiveness of), Currency risk (attractiveness of), Inflation stability, Ease of doing business.
19 Climate change relevance score is based on a country’s Energy Intensity, CO2 emissions intensity, Supporting environment for climate change.
20 Energy access relevance score is based on a country’s Share of Population w/o Access to Electricity, Electricity Prices, Electricity consumption growth.
A Report for the Business & Sustainable Development Commission and the Blended Finance Taskforce 15January 2018 Blended Finance in Clean Energy: Experiences and Opportunities
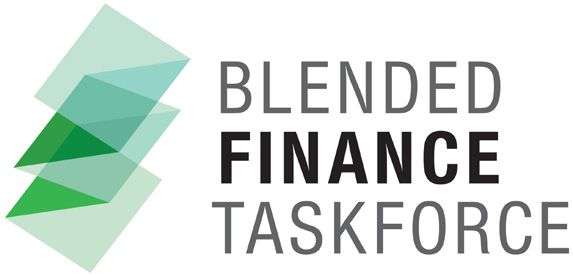
with the general understanding Figure 2: Key barriers and risks in high-impact countries
that lower income countries
have greater needs in energy
India
access, whereas higher income Higher
countries should focus more Private
Sector South Africa
on decarbonizing existing or Score Mongolia
Cambodia
planned electricity genera- Mozambique
tion assets. However, spe- Rwanda
cific sectoral opportunities Kenya
Uganda
in these regions in hydro,21
solar, wind, and geothermal
generation vary significantly.
Each country has its distinc-
tive resource potential and
planned capacity addition, and
investment barriers are also Capacity targeted
country-dependent.
By ranking individual coun- 250,000 MW
tries in terms of private sector 25,000 MW
2,500 MW
attractiveness, quality of
energy access, and relevance Higher Combined Energy Access and Climate Score
for climate change investment
(see Methodology in Annex Several additional tiers of countries are listed in Section 1.1.1 of the Annexes.
1), it is possible to identify,
Purple = East Africa).
within the different regional groups mentioned above,
a number of specific countries representing potential Table 4 summarizes the potential (in MW) of planned
high-impact investment opportunities. Within the and targeted renewable energy capacity in each market
regions identified, India, South Africa, Mozambique, identified. India represents 80% of total renewable
Cambodia, Mongolia, Uganda, Kenya and Rwanda are energy investment potential, followed by Kenya (7.9%)
countries that can deliver the highest impact per dollar and South Africa (7.5%). Hydropower represents 49%
invested both in improving the quality of energy access of investment potential, followed by solar (29%) and
and delivering climate impact.22 Figure 2 shows how wind (15%), with geothermal energy leading investment
the abovementioned countries score relatively higher opportunities in East Africa.
in terms of private sector attractiveness and energy
access and climate change relevance, filling the top- It is important to note that the above results do not
right section of the graph. The area of the bubble shows indicate that the particular countries and regions
the extent of additional planned and targeted capac- mentioned should be the sole focus of attention for
ity in each market, while colors indicate the different investors. Many other countries also provide interest-
regional groups identified (orange = South Asia, Green ing opportunities. See Annex 1 for additional results on
= Southern Africa, Red = East and South-East Asia and regions and countries.
21 Large hydro (>10 MW) is often excluded from definitions of clean energy; for completion we have kept it in.
22 We looked at countries with both climate mitigation and energy access potential. Another possibility is to look at these impacts separately.
A Report for the Business & Sustainable Development Commission and the Blended Finance Taskforce 16January 2018 Blended Finance in Clean Energy: Experiences and Opportunities
Table 4: Planned and targeted capacity and investment potential in high-impact countries
PLANNED TARGETED INVESTMENT
HIGH-IMPACT COUNTRY FOCUS MARKET KEY SECTORS ADD'L ADD'L CAPACITY POTENTIAL
CAPACITY (GW) BY 2030 (GW) (USD BN)
India South Asia Hydro, Solar, Wind 121.3 109.2 292
South Africa, Mozambique Southern Africa Hydro, Wind, Solar 10 12.4 36
Cambodia, Mongolia East & South-East Asia Hydro, Wind, 2.8 n/a 4
Kenya, Uganda, Rwanda East Africa Geothermal, Wind, Hydro 5.1 7.5 37
Note: planned additional capacity refers to the current advanced pipeline of projects in a country, while targeted additional capacity refers to the further project
additions that would be needed in the long term to meet country and technology specific targets.
3.2 Analysis of key barriers and risks in The intensity of risks and barriers in the high-impact
the high-impact countries regions are displayed in Figure 3. Other technology-spe-
cific barriers in the target areas were identified through
Identifying the key barriers and risks to investment in desk research, and are discussed in the following
each high-impact country is critical to targeting blended section. More details on the analysis of barriers for each
finance instruments. To identify key political and com- country, as well as data sources, are provided in Annex
mercial barriers to investment in each of the high-im- 2.
pact countries, we referred to individual or combined
country level indicators, assumed as proxies for specific
risks.
Figure 3: Key barriers and risks in high-impact countries
South
India Mozambique Cambodia Mongolia Kenya Uganda Rwanda
Key barriers and risks Africa
Political and social risks
Administrative barriers
Policy, regulatory risk
Access to capital barrier
Construction, financial, and operation
costs increase and volatility
Currency Risk
Counterparty, Offtaker, or Credit
* N/A N/A
Risk
Revenues Lack of Attractiveness and
Volatility * *
Relatively low barrier or risk Relatively high barrier or risk
Note: (*) indicates that in the absence of a quantitative figure to estimate the barrier or risk, the intensity has been qualitatively determined by combining expert
judgement with performance of other risks within the same country. N/A indicates data not available.
A Report for the Business & Sustainable Development Commission and the Blended Finance Taskforce 17January 2018 Blended Finance in Clean Energy: Experiences and Opportunities
3.3 Profiles of high-impact opportunities The average levelized cost of electricity for renewables
is falling rapidly; recent auctions have seen bids at USD
This section provides more detail on each of the 0.05 per kWh for wind and USD 0.038 per kWh for solar
high-impact opportunities and accompanying barriers (Upadhyay, 2017a; 2017b). Several Independent Power
to investment, incorporating both quantitative and desk Producers (IPPs) are expected to launch initial public
research. offerings in the near future, and the green bond market
is expanding rapidly. Both of these developments should
INDIA – DEEP DIVE free up capital currently tied up in project financing and
We examined India in significantly more detail given offer non-project investment opportunities in debt and
the magnitude of the opportunity. We also provide, equity vehicles (BNEF, 2017). 3.1 million off-grid solar
below, some information on current blended finance systems were sold in 2016, and 2.5 million in 2015.
opportunities.
Investment opportunity: India represents a USD
292bn market opportunity, 80% of the total renewable Institutional investors,23 foreign and domes-
energy investment potential in the high-impact coun-
tic, may be capable of bridging the shortfall in
tries identified in this report. As the world’s third-larg-
est economy, yet with 244 million people lacking debt and equity financing of required renew-
electricity access, India is critical in achieving global able energy investment in India,24 but face
climate change and sustainable development goals. additional barriers.
Targets and policies: India has ambitious renewable
energy targets (REN21, 2017), including 40% electricity
generation capacity from renewables (including large Barriers: Given current conditions, India will likely
hydro) by 2030. It has an interim goal of 175GW in fall short of the 2022 required investment by approxi-
renewable generation (excluding large hydro) by 2022, mately 30%, on both debt and equity (Sen et al, 2016).
with 100GW of solar PV, of which 40GW distributed Unfavorable terms of capital, especially high cost and
rooftop solar, and 60GW wind (REN21, 2017). Meeting short tenors of debt, can increase renewable energy
India’s targets will require up to USD 189bn addi- project costs by approximately 30% (Nelson et al, 2012).
tional investment by 2022, the majority in debt
finance (Sen, Sharma and Shrimali, 2016), and
Figure 4: Clean Energy Investment Opportunity in India
up to USD 292bn by 2030. The off-grid market
opportunity is estimated at USD 215m by 2018 (The Financial opportunity
Planned and targeted generation
Climate Group, 2015). Furthermore, the government (USD billion)
plans to invest USD 11bn in rural electrification by
2022 to reach all unelectrified villages. Feed-in- Large hydro 103 $156
tariffs have been set at the state level since 1993;
however, starting with solar in 2010 and wind in
Solar 9.1 81 $93
2017, auctions have begun to replace feed in tariffs
(ClimateScope, 2016b). Net metering for rooftop
solar is currently being rolled out state-by-state. Wind 4.2 27 $35
India has wholesale power markets and unbundled
generation and transmission, and added 28,000km
of transmission lines in 2016. Small hydro 3.9 $5.9
Market trends: Investment from 2011-15 in clean
energy was USD 48.3bn (REN21, 2017). New invest- Biomass 0.8 1.2 $2.1
ment in 2016 totaled USD 9.2bn (of which USD
5.5bn solar), and USD11.2bn in 2015. After China and Planned (GW)
Geothermal 0.01 $0.03
Japan, India is the largest solar PV market in Asia. Targeted (GW)
23 Domestic institutional investors, with a lower cost-of-capital, can meet 54% of the debt gap.
24 Climate Policy Initiative. 2016. “Reaching India’s Renewable Energy Targets.”
A Report for the Business & Sustainable Development Commission and the Blended Finance Taskforce 18You can also read