NEW ZEALAND CHINA COUNCIL - Investment Report : Fostering Growth - New Zealand China Partnership Forum2015: New Zealand China Council Investment ...
←
→
Page content transcription
If your browser does not render page correctly, please read the page content below
NEW ZEALAND CHINA COUNCIL
                                            Investment Report : Fostering Growth

1   New Zealand China Partnership Forum2015: New Zealand China Council Investment Report
Disclaimer This Report has been prepared for the NZ China Council and represents the views of those contributing. However, neither the NZ China Council, nor any contributor or sponsor represents or warrants the correctness or accuracy of the contents of the Report nor takes any responsibility to anyone that relies on the Report or any aspect of it. Anyone wishing to rely on the Report should make their own inquires and take their own advice.
Contents
Foreword ........................................................................................................................................................................................ 2
Executive Summary ................................................................................................................................................................... 5
New Zealand & China as Global Investors - ‘The big picture’ ..................................................................................... 7
New Zealand ............................................................................................................................................................................ 7
China ........................................................................................................................................................................................ 11
New Zealand & China - FDI Relationship ........................................................................................................................ 15
FDI in New Zealand from China ..................................................................................................................................... 15
FDI in China from New Zealand ..................................................................................................................................... 21
Investment Regulation .......................................................................................................................................................... 22
Investing in New Zealand ................................................................................................................................................. 22
Investing in China ................................................................................................................................................................ 24
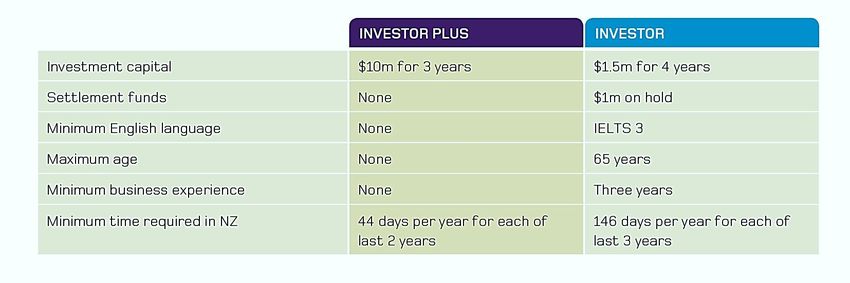
Investor Migration from China ............................................................................................................................................ 27
Case Studies - Chinese Investment in New Zealand .................................................................................................. 28
Yashili .................................................................................................................................................................................. 28
Fu Wah International Group ....................................................................................................................................... 30
Shanghai Pengxin ........................................................................................................................................................... 31
Beijing Capital Group ..................................................................................................................................................... 33
Shanghai Bright Dairy ................................................................................................................................................... 35
Haier – Fisher & Paykel Appliances......................................................................................................................... 36
Beijing Automotive Group ........................................................................................................................................... 37
Case Studies - New Zealand Investment in China ...................................................................................................... 39
Fonterra ............................................................................................................................................................................. 39
Nuplex ................................................................................................................................................................................. 41
Fletcher Building ............................................................................................................................................................. 42
Huhu Studios.................................................................................................................................................................... 44
Looking forward ........................................................................................................................................................................ 46
New Zealand Investment Attraction Strategy ......................................................................................................... 46
China FDI................................................................................................................................................................................. 48
Proposed Changes to Chinese Investment Rules ................................................................................................... 49
1. New Zealand China Council Investment Report: Fostering GrowthFOREWORD
Globalisation has many characteristics. While trade in goods is the most obvious, the international flow
of capital has long been an essential part of globalisation. But the flow of capital, particularly the inflow
of capital, is often treated with suspicion on nationalistic grounds.
There are two main angles from which to consider capital flows: economic and political.
The economic case is heavily skewed in favour of the free flow of capital. The literature is
overwhelmingly in favour, while a small minority suggest little net benefit.
The inflow of capital fills the gap between domestic savings and investment. For New Zealand this has
been a longstanding issue. New Zealand’s current account balance - which measures the shortfall in
domestic savings that is met by foreign capital inflows - has been in deficit most years since records
began in 1951.
Figure 1: New Zealand has consistently borrowed capital from overseas through decades of current
account deficit
Current account balance
6%
4%
2%
0%
-2%
% of GDP
-4%
-6%
-8%
-10%
-12%
-14%
-16%
1951 1961 1971 1981 1991 2001 2011
Source: Statistics NZ
New Zealand has relied on foreign capital over a prolonged period to increase the productive capital
base of the economy, which in turn has contributed to jobs and economic prosperity.
The international flow of capital - in the form of direct investment as opposed to debt -tends to be
accompanied by management expertise, market access and other factors that may not be available in
2. New Zealand China Council Investment Report: Fostering Growththe recipient business or country. These tend to be the main benefits of Foreign Direct Investment
(FDI).
Joint ownership of capital also strengthens the ties between the two parties in a business relationship.
This effectively reduces the ‘distance’ between them, improving returns to both. A large body of
literature shows that the more closely two markets are connected, the more mutually beneficial it is
for both economies.
Similarly, the outflow of capital allows investors to own businesses and control the value chain to
maximise profits. This is something that New Zealand does not yet do well. While New Zealand is a
strong performer in merchandise trade (considering the size of our economy and distance from
markets), we under-invest globally. This may reflect a scarcity of capital in New Zealand, but it is also a
lost opportunity.
Fig 2: Comparison between New Zealand’s FDI and ODI stock
Total&New&Zealand&direct&
NZ$mn"
100,000"
investment&stock:&&FDI&and&ODI&&
90,000"
80,000"
70,000" ODI"
60,000"
FDI"
50,000"
Linear"(ODI)"
40,000"
30,000" Linear"(FDI)"
20,000"
10,000"
0"
2005" 2006" 2007" 2008" 2009" 2010" 2011" 2012" 2013" 2014"
FDI"="Foreign"Direct"Investment"into"New"Zealand."
ODI"="Overseas"Direct"Investment,"from"New"Zealand"
Source:"StaKsKcs"New"Zealand.""March"years."""
Investing globally creates access to markets and supply chains that can help add more value to local
production. This is because the most value is often created at the points in the supply chain that are
closest to the customer. Ownership and control of the value chain also allows protection of intellectual
property which is, more often than not, the source of ultimate value in the modern economy.
3. New Zealand China Council Investment Report: Fostering GrowthCriticism of foreign capital flows, in both economic and general literature, tends to focus on questions
of sovereignty and political influence. The history of colonialism is characterised not only by the
political and military subjugation of the colonised nation, but also an appropriation of its economic and
productive assets. Fears of a modern form of economic colonialism have been sparked by successive
global waves of capital investment, led by the US in the 1970s, Japan in the 1980s and most recently
China. In each instance there is a fear that foreign investors will buy up businesses, land and buildings
at prices that locals cannot afford, making the locals tenants in their own country. However, in most
instances, these fears have proven unfounded.
Such fears are well founded in countries that lack strong institutions and an independent judiciary.
Under these circumstances, potential for the extraction and abuse of ownership rights is high.
Global capital flows have increased massively over successive decades – accompanied by increased
global prosperity. The positives have generally outweighed the negatives. Operating within a strong
institutional framework and an independent judiciary, the advantages of FDI outweigh the
disadvantages. New Zealand is fortunate to have some of the best economic settings in the world. By
making better use of FDI, in terms of welcoming inflows and wisely investing offshore, New Zealand
can boost prosperity at home.
Shamubeel Eaqub
Aotearoa Development Cooperative
4. New Zealand China Council Investment Report: Fostering GrowthEXECUTIVE SUMMARY This report explores the past, present and future investment relationship between China and New Zealand. The purpose of this report is to stimulate discussion about ways to improve the strong foundation that this relationship has been built upon. The goal is to encourage and facilitate future growth in two-way investments that are mutually beneficial for both countries. Like China, New Zealand has relied heavily on foreign direct investment (FDI) to grow its economy and develop the infrastructure needed to process and export high quality products to international markets. In comparison to other small developed economies, New Zealand’s stock of FDI as a percentage of GDP remains relatively high, while overseas direct investment (ODI) is relatively low. It has been this way for many decades. In contrast, China’s rapid economic development over the last 30 years sees it positioned to become a net exporter of capital in the very near future. Although China has not traditionally been a large source of FDI into New Zealand, the rate of growth and scale of investments is rapidly increasing. Looking forward, the challenge for New Zealand is to guide FDI from China into sectors of the economy where capital is most needed and creating long term alignment of interest between the Chinese and New Zealand counterparties. These sectors include: primary industries, premium food and beverage, tourism, specialised manufacturing, infrastructure, oil, gas and mining, ICT/digital and shared services. Ideally future FDI will bring more than capital to New Zealand but will also enhance business opportunities through deeper and longer term relationships and improved access to people, skills, know-how or market access. The growing number of large scale investments from China is a testament to the openness, and willingness of New Zealand to welcome high quality capital investment. New Zealand even offers attractive migration options for investors who meet certain capital requirements. In order to protect the quality of large scale investments, New Zealand has a thorough review and approval process before large or sensitive investments can proceed. As an economy reliant on export income, New Zealand businesses must explore ways to increase ODI and build a stronger physical market presence in China. By doing this, there will be more opportunities for New Zealand businesses to add value to their exports by being closer to the large and increasingly affluent Chinese consumer market. Efforts to expand value adding business operations in China are currently being pioneered by a small number of New Zealand companies. The case studies presented in this report are by no means an exhaustive list of the two-way investment activity between New Zealand and China. New and exciting investment projects are continually being announced. As future investments are made, updates to this report will be published 5. New Zealand China Council Investment Report: Fostering Growth
on the NZ China Council website1. Recommendations on ways to improve the investment relationship
discussed at this forum will also be included.

The full potential of the two-way investment relationship can only be reached if continued efforts are
made to open up further opportunities for communication and information sharing. The 2015 New
Zealand-China Partnership Forum presents such an opportunity. The productive dialogue and
friendships established at this event will no doubt further support the future development of this
important investment relationship.

                                                                                    Parley Reynolds
                                                                              China Market Analyst
                                                                   New Zealand Trade & Enterprise

1
    www.nzchinacouncil.com

6. New Zealand China Council Investment Report: Fostering Growth
NEW ZEALAND & CHINA AS GLOBAL INVESTORS - ‘THE BIG PICTURE’
New Zealand
New Zealand has long been open to foreign investment. In the last 200 years New Zealand has been
heavily reliant on foreign investment for national development projects. With a small population and a
relatively large geographic area, reliance on New Zealanders’ savings alone has never been realistic.
But we’re not just interested in the money, or even simply the additional jobs created by foreign direct
investment. We want the ideas, the technologies and the new business opportunities that go with
investment. These are the things that will create a stronger platform for sustained growth and
prosperity over the long-run.
New Zealand faces a well-known productivity challenge, and it’s likely that one of the contributing
factors is our distance from other centers of innovation. Cheaper transport and communication
technology have helped to close the gap, but concentrating economic activity in particular locations is
still a key way of increasing productivity. This reinforces the importance of making sure that Auckland,
our only global city, works well as our main physical point of connection to the world. The rise of
emerging markets in the Asia Pacific region and particularly China has put us closer to the action, but
Auckland is still no closer to cities in Asia than cities in Europe. We have to find other ways to bring the
world closer. Foreign direct investment (FDI) is part of the answer, in that it often brings new thinking
and skills from other parts of the world.
New Zealand is sometimes perceived as “not open to FDI.” In fact, the opposite is true. The New
Zealand economy already has a high penetration of foreign investment. Over the last twenty years,
foreign direct investment has averaged around 50 percent of GDP, one of the highest levels globally
among comparable small, open economies.
Fig 3: New Zealand’s ratio of FDI to GDP
90" """"""""""New"Zealand"
80" """"""""""Australia"
70"
""""""""""China"
60"
50" """"""""""Denmark"
46%"
40" """"""""""Finland"
34%"
30"
""""""""""Chile"
20"
""Developed"
10" economies"
0"
Source:"
1995"
1996"
1997"
1998"
1999"
2000"
2001"
2002"
2003"
2004"
2005"
2006"
2007"
2008"
2009"
2010"
2011"
2012"
2013"
UNCTAD"
7. New Zealand China Council Investment Report: Fostering GrowthStatistics New Zealand data for the year ending March 2014 indicates that the main source of FDI into
New Zealand is from Australia. This is not surprising given its close proximity and close trade ties with
New Zealand. Traditional investor countries such as the USA and the UK are tied in second place at
about 8% each. China, including HKSAR, is now in fourth place with $5.3 billion, nearly 6% of the total
(pink for HK and red for China). It is interesting to note the importance of tax effective jurisdictions like
Singapore and Holland. The British Virgin Islands and Cayman Islands together comprise 4% - $3.65
billion - of FDI in New Zealand FDI from these regions is more than the FDI from Japan 3% ($3.5 billion).
Fig 4: China is now New Zealand’s fourth largest source of FDI stock
FDI&stock&in&New&Zealand&
2014&&
(Immediate&investor&basis)&
Cayman"Islands"
1%"
Other"incl."
confidenKal""
BriKsh"Virgin"Islands" 6%"
3%"Canada" TOTAL&$97.4&bn&
Netherlands" 2%"
3%"
Japan"
3%"
Singapore"
4%"
China*"
1%"
China,"HKSAR*" Australia"
5%" 56%"
UK"
8%" Source."StaKsKcs"New"Zealand"
internaKonal"investment"
posiKon.""Immediate"investor"
USA""" basis"for"March"year"2014..""
8%" *"China"and"HKSAR"data"is"for"
December"2014"year,"pending"
December"year"data"for"others"
countries""
"
FDI in New Zealand is diversified across a number of sectors. Although the New Zealand media tends
to focus on politically sensitive foreign investments that involve the sale of New Zealand land, the
sector of the New Zealand economy that attracts the most FDI is the financial and insurance services
sector. New Zealand’s major banks are all owned by parent companies based in Australia.
8. New Zealand China Council Investment Report: Fostering GrowthFig 5: FDI in New Zealand by sector (year ending March 2012 – 2014)
NZD millions
Total&FDI&stock&by§or&&
Other"industries"n.e.s"
100,000" 97,373&
90,000" 87,479& 89,622&
16,739" Agriculture,"forestry"and"fishing"
80,000" 17,860"
19,748" 5,540"
Professional,"scienKfic,"and"
70,000" 4,794" technical"services"
4,484" 9,116"
60,000" 8,605" Wholesale"&"retail"trade"
8,858" 12,723"
50,000"
13,546"
14,177" Manufacturing"
40,000" 16,876"
12,774"
30,000" 11,644"
Unallocated"to"industry"
20,000"
27,190" 30,569"
10,000" 24,976" Financial"and"insurance"services"
0"
2012" 2013" 2014"
Source:"NZ"StaKsKcs.""March"years.""
‘Other"industries’"is"comprised"of"
13"smaller"categories"""
By March 2014, the stock of New Zealand’s FDI was NZD $97.3 billion. In contrast, the stock of ODI
from New Zealand was only NZD $23.1 billion. To compound matters further, New Zealand’s returns
from ODI tends to be much lower than what foreign investors achieve in New Zealand. An assessment
from ANZ Bank economists suggests that if ODI returns to New Zealand companies matched the FDI
rates achieved in New Zealand by overseas firms, NZD $2-3 billion could potentially be added each
year to the New Zealand economy.2 ODI can help New Zealand businesses to shorten supply chains,
get closer to customers, increase returns, and potentially open up new sources capital. However, New
Zealand’s ODI to GDP ratio is declining while in most other developed economies, ODI is increasing.
Prior to the mid-1990s, New Zealand’s ODI was similar to comparable economies. In 1995, New
Zealand’s ODI to GDP ratio was around 10%. In 2013, it was still 10%.
2
Capital Markets: The new big O.E., NZ Herald, 14 May 2015. David Green - Managing Director ANZ.
9. New Zealand China Council Investment Report: Fostering GrowthFig 6: New Zealand ODI as percentage share of GDP
FDI&outward&stock&as&share&of&GDP&
90"
80" 81%"
70"
60" New"Zealand"
%&of&GDP&
50" Australia"
47%"
40" Chile"
30" Denmark"
20"
10" 10%"
0"
Source:"OECD"&"UNCTAD"
"
10. New Zealand China Council Investment Report: Fostering GrowthChina Over the past three decades, China has been one of the top destinations in the world for FDI, particularly in the manufacturing sector. Investors have been attracted by low labour costs and relatively developed internal infrastructure. China has welcomed FDI, seeing capital and expertise as fundamental to the economic strategy of “reform and opening” that began in the late 1970s under Deng Xiaoping. In the 1980s, the Chinese government established Special Economic Zones which were devised to target FDI. In 1995, the government issued the first catalogue of rules and regulations for FDI which identified sectors in which investment was encouraged, restricted or prohibited, depending on China’s economic development plan at the time. These catalogues are still regularly updated with different types of goods highlighted in each issue. Until the late 2000s, FDI in export processing was especially encouraged. In 2007, the Chinese government issued a revised catalogue in which the prior bias towards manufacturing for export was reversed. FDI into businesses solely devoted to export was to be limited. In 2008, tax advantages that foreign enterprises had previously received for investing in Special Economic Zones were largely eliminated (except in China’s less developed western and central regions). Tax incentives were to be provided based on type of business activity, not by location. FDI was no longer primarily seen as a source of funding or job creation. Instead, it was seen as a way of bringing in advanced technology and expertise into sectors that were viewed as key to national economic development. The official guidelines on FDI issued at the end of 2011 promoted opportunities in areas such as alternative energy, biotechnology, information technology and high-end equipment manufacturing. Rising wages in China, concerns about market access, and reduced export demand in western countries still recovering from the GFC have fuelled conjecture that FDI into China may slow in the coming years, particularly as low end manufacturing companies relocate to countries such as Bangladesh and Vietnam. However, FDI into China has become increasingly focused on the services sector, rather than on manufacturing. Rapidly growing levels of personal disposable income will encourage foreign investors to try to tap into rising domestic demand. FDI in China’s financial services sector alone surged more than 400 percent in the first half of 2015 compared to the same period a year earlier. In recent years, China and Hong Kong’s stock of FDI has been increasing at an annual rate of US$200 billion. This is equivalent to the size of the New Zealand economy. Fig 7: Value of New Zealand’s stock of FDI between 1995 - 2013 11. New Zealand China Council Investment Report: Fostering Growth
FDI&stock&between&1995&T&2013&
                                                                                                                                                                 1,444"
           $1,400"                                                                                                                                                              """"""""""New"Zealand"

           $1,200"                                                                                                                                                              """"""""""China"

                                                                                                                                                                   957"
           $1,000"                                                                                                                                                              """"""""""China,"Hong"Kong"SAR"
USD&billions&

                $800"
                                                                                                                                                                                """"""""""Australia"

                $600"
                                                                                                                                                                                """"""""""Chile"

                $400"
                                                                                                                                                                                """"""""""Denmark"
                $200"
                                                                                                                                                                                """"""""""Finland"
                  $0"
                                                                                                                                                                                Source:"UNCTAD"
                        1995"

                                        1997"
                                                1998"
                                                        1999"

                                                                        2001"

                                                                                                        2005"

                                                                                                                        2007"
                                                                                                                                2008"
                                                                                                                                        2009"

                                                                                                                                                        2011"
                                1996"

                                                                2000"

                                                                                2002"
                                                                                        2003"
                                                                                                2004"

                                                                                                                2006"

                                                                                                                                                2010"

                                                                                                                                                                2012"
                                                                                                                                                                        2013"
In a little over a decade, Chinese ODI has increased from an insignificant level to more than $100 billion
a year, making China one of the world’s top three exporters of capital. China’s long-term outbound
investment is catching up with inbound foreign investment, bringing the country closer to becoming a
net exporter of funds as it boosts its global economic clout. ODI in renminbi (RMB) terms jumped 29.2%
in the first half of 2015 compared to the same period a year earlier. In comparison, FDI into China grew
by 8.3% during the same period.3 ODI was valued at 343.2 billion RMB during the period, compared
with 420.5 billion RMB in FDI. It is expected that at some point in in 2015, China will become a net
provider of capital to the world. Institutions like the Asian Infrastructure Investment Bank and Chinese-
led regional economic integration initiatives like “One Belt One Road” will further accelerate this trend,
reshaping the global economic landscape in the process.

3
    China Outbound Investment Expands as Nation Boosts Global Clout, Bloomberg, 21 July 2015,

12. New Zealand China Council Investment Report: Fostering Growth
Fig 8: Value of New Zealand’s ODI stock between 1995 - 2013
ODI&stock&between&1995&T&2013&
$1,600" """"""""""New"Zealand"
$1,400" 1,352" """"""""""China"
$1,200" """"""""""China,"Hong"Kong"SAR"
USD&billions&
$1,000" """"""""""Australia"
$800"
614" """"""""""Chile"
$600"
""""""""""Denmark"
$400"
""""""""""Finland"
$200"
$0"
Source:"UNCTAD"
1995"
1997"
1998"
1999"
2001"
2005"
2007"
2008"
2009"
2011"
1996"
2000"
2002"
2003"
2004"
2006"
2010"
2012"
Chinese companies are increasingly being encouraged to invest overseas under China’s ‘Going Out’ 2013"
policy, which provides access to lower cost loans from policy banks such as the China Development
Bank. Most of the larger Chinese investors in New Zealand have been state owned enterprises, from
the dairy, meat and utility sectors - the most recent example being Shanghai Maling’s acquisition of 50%
of Silver Fern Farms which was announced on 15 September 2015. In 2014, three Chinese state
owned banks also established subsidiaries in New Zealand (Bank of China, China Construction Bank
and Industrial and Commercial Bank of China).
As a result, many Chinese investors are able to outbid private companies in competition for assets
because of assistance from Beijing. Chinese overseas assets have posted an annual growth rate of
16.4% since 2011, rising from 2.7 trillion RMB in 2011, to 4.9 trillion RMB in 2015. China currently has
113 centrally administered SOEs. Their investments abroad account for over 70% of China’s ODI. At
the end of 2014, 107 Chinese SOEs had set up a total of 8,515 branches in 150 countries and regions.4
International investment statistics have traditionally been compiled based on the jurisdiction of
registration of the immediate investor, not the jurisdiction of the investor where the funds were
originally sourced. It is common practice for international investors to route funds through jurisdictions
offering favourable tax treatment. Chinese investors are no exception. ODI figures are distorted by
“round-tripping”, whereby domestic Chinese companies funnel money to Hong Kong or other tax
havens, only to bring it back into China to take advantage of favourable tax incentives. Even though a
4
SOE overseas assets surge, China Daily, 19 June 2015
13. New Zealand China Council Investment Report: Fostering Growth2008 law equalised tax rates for both foreign-invested and domestic enterprises, financial incentives
are still available for ‘foreign’ investors in central and western regions of China.5 According to MOFCOM
statistics, in 2013, 70% of China’s ODI was in ‘tax favourable’ territories. 58% of China’s ODI went to
Hong Kong with another 11% being invested in the Cayman Islands and the British Virgin Islands and a
further 2% in Singapore. Only 3% of Chinese ODI was reported as being destined for the USA, despite
the United States being the world’s largest global destination for FDI.
Fig 9: Chinese ODI stock by country/ region (December 2013)
Chinese&ODI&stock&by&country/region&&
2013&&
NZ"
Indonesia" 0.1%"
Total&&
1%"
Canada" US$661&bn&
1%"
Russia"
UK" 1%" Other"countries"
2%" 18%"
Singapore"
2%"
China,"HKSAR"
Australia" 58%" Source:"MOFCOM."
3%" December"years."
Countries/regions"with"
USA" BriKsh"Virgin" >0.9%"share".""
3%" Islands"
5%"Cayman"Islands"
6%"
5
Serve the people: The new landscape of foreign investment into China, Economist Intelligence Unit
14. New Zealand China Council Investment Report: Fostering GrowthNEW ZEALAND & CHINA - FDI RELATIONSHIP
FDI in New Zealand from China
As Chinese companies move offshore, they are choosing New Zealand as an investment destination,
taking advantage of our stable economic and political environment, favourable regulatory environment
and investor-friendly tax policies – including the lack of a capital gains tax.
New Zealand and China have seen a large increase in our two way trading relationship. In the last five
years or so we have also seen a huge expansion in the bilateral investment relationship. A big factor in
the growth of Chinese investment in New Zealand over the last decade has been China’s ‘Going out’
policy, which encourages Chinese companies to invest offshore.
Part of the interest in investing in New Zealand has also been driven by the Free Trade Agreement
which came into force in 2008 - China’s first FTA with a developed economy. Almost all of the phasing
out of tariffs has now come into effect, further increasing the attraction of New Zealand as an
investment destination, particularly in the primary sector.
In 2010 Prime Minister John Key and Premier Wen Jiabao set a target of $20 billion in two-way goods
trade by 2015. This target looked to be firmly on track until the drastic fall in global dairy prices which
has led to a steep decline in the value of New Zealand merchandise exports to China. Global dairy
prices are not expected to recover until mid-2016. In March 2014, Prime Minister John Key and
President Xi Jinping set a new goal of achieving $30 billion in two-way trade by 2020.
Fig 10: New Zealand and China Merchandise Trade Relationship (2005 – 2015)
New&Zealand&T&China&Goods&Trade&RelaYonship&
YE"June"
$14,000"
$12,000"
$10,000"
NZD"(millions)"
$8,000"
$6,000"
$4,000"
$2,000"
$0"
2005"" 2006"" 2007"" 2008"" 2009"" 2010"" 2011"" 2012"" 2013"" 2014"" 2015""
NZ"Exports"to"China" China"Exports"to"NZ"
15. New Zealand China Council Investment Report: Fostering GrowthIn the last few years, the increase in Chinese investment into New Zealand has been extraordinary.
From a low base, China’s share of New Zealand’s FDI stock has grown to 6.2%. This is a 160% increase
since 2011.
Fig 11: China and HKSAR investment in New Zealand as percentage of FDI stock
Chinese&share&of&NZ&FDI&stock&
immediate&investor&basis&
7.0%" 6.2"%""
6.0%"
5.4%"
5.0%"
%"of"stock"
4.0%" 3.4%"
3.0%"
2.4%"
2.0%" 1.5%"
1.0%"
Source"StaKsKcs"NZ."
0.0%" PRC"including"China"
and"HKSAR.""
2011" 2012" 2013" 2014" 2015"
Since 2011, FDI from the PRC (including HKSAR) has gone from NZ$1.1 billion to NZ$5.3 billion, an
increase of nearly 400%, or on average growth of nearly NZ $1 billion a year. When measuring FDI on
an immediate investor basis, the level of investment from HKSAR is quite striking.
16. New Zealand China Council Investment Report: Fostering GrowthFig 12: China and HKSAR investment in New Zealand – immediate investor basis
Stock&of&direct&investment&from&China&&
NZ$"mn""
T&immediate&investor&basis&&
6,000"
5,270"
5,000"
4,000" Hong"Kong"SAR"
3,054" China"
3,000"
Based"on"immediate"
2,057"
investor"basis,"ie"the"
2,000" jurisdicKon"of"registraKon"of"
1,120" 1,173" 1,087" the"invesKng"enKty,""not"the"
ulKmate"investor.""
1,000" "
HK"2014"is"to"end"of"Sept"
quarter"as"Dec"quarter"is"
0" confidenKal"
2009" 2010" 2011" 2012" 2013" 2014" "
Source."StaKsKcs"New"
December"years" Zealand.""
"
However, the actual level of direct investment from China is much higher. Data compiled by New
Zealand Trade & Enterprise reveals that most Chinese investment in New Zealand is from mainland
investors with companies registered in Hong Kong, Singapore, Cayman Islands, British Virgin Islands
and other tax favourable territories. When also taking into account direct investments where Chinese
companies are the ultimate investor, the total is much closer to NZ$7 billion. For example, in 2012
when Haier completed its purchase of New Zealand’s Fisher and Paykel Appliances the New Zealand
Overseas Investment Office (OIO) reported that the NZ$742 million transaction was made through
Haier (Singapore) Management Holding Co Pte Ltd, a 100% owned subsidiary of the Haier Group
Corporation. This investment was reflected in New Zealand’s FDI statistics as being from Singapore.
17. New Zealand China Council Investment Report: Fostering GrowthFig 13: China and HKSAR actual and announced investment - ultimate investor basis
&Chinese&FDI&in&New&Zealand&by&ulYmate&investor&
NZ$mn" Actual&&&Announced&
7000"
6000"
5000"
HKSAR"
4000"
3000"
Mainland"
2000"
1000" Source:""
NZTE"China"FDI/ODI""
database"
0"
2010" 2011" 2012" 2013" 2014" 2015"
To""May"2015"
A feature of Chinese FDI in New Zealand is the diverse range of sectors which have received
investment from Chinese investors. The largest sector is infrastructure and utilities, accounting for
more than one-third of announced Chinese investments. Some examples: in 2014 Beijing Capital
Group acquired New Zealand’s largest waste management company, for NZ$950 million. In 2008,
Hong-Kong based Cheung Kong Infrastructure bought the Wellington Electricity Company for $785
million and in 2012 acquired New Zealand’s second largest waste management company, Envirowaste,
for NZ$490 million.
18. New Zealand China Council Investment Report: Fostering GrowthFig 14: Chinese direct investment into New Zealand is relatively diversified
&Chinese&FDI&in&New&Zealand&T&by§or&
&&&&&&&&&&&&&&&&&&&May&2015&Actual&&&announced&&&
&&&&&&&&&&&&&&&&&&&&&&&&&&&&UlYmate&investor&basis&&&&&&&&&&&&&&&&&&&&&&&&&&&&&&&&&&&&&&&&&&&&&&&&&&&&&&&&&&
Primary"industry"&"food"
17%"
Total&$6.6&bn&
26%" Forestry"
Manufacturing""
Financial"services"
Infrastructure/"UKliKes"
2%" Hotel/Commercial"
Total"commiled"and"announced"
14%" FDI"from"China"including"HKSAR"was"
37%"
$6.6"billion""to""May"2015"
Source"NZTE""China"FDI/ODI"
database""
4%"
Chinese investments in New Zealand’s primary industries and food processing make up the second
largest sector. China is the largest foreign investor in New Zealand’s dairy sector with NZ$800 million
in current investments and a further NZ$700 million in announced projects. Most of China’s largest
dairy companies are building a stake in the New Zealand dairy sector: many of these are large
greenfield projects.
In November 2014 Yili opened a NZ$214 million processing facility in the South Island and announced
a $400 million expansion programme for the next five years. In November 2015 Mengniu-controlled
Yashili will formally open a NZ$212 million infant formula plant in the Waikato region of the North
Island. Both the Yili and Mengniu invested ventures are wholly Chinese owned. In addition, Shanghai
Bright Dairy has a 39 percent stake in South Island infant formula manufacturer Synlait, which has the
largest infant formula plant in New Zealand. By 2016, Beijing Sanyuan’s Baxy icecream subsidiary will
start producing icecream for the China market from Hauraki in the North Island. Shanghai Pengxin has
invested in a number of farms in both the North Island and South Island as a base for developing new
products for exporting new dairy products to the Chinese market.
As mentioned earlier, Haier owns Fisher & Paykel Appliances, one of New Zealand largest
manufacturing companies, with a total investment of around NZ$1 billion. In the last couple of years
19. New Zealand China Council Investment Report: Fostering GrowthNew Zealand has also seen significant new Chinese investments into the tourism sector, taking advantage of the rapid increase in Chinese visitors to our shores. Another new sector of interest has been the finance sector. As noted above, three of China’s largest banks opened New Zealand subsidiaries in 2014. A further promising area for cooperation is in the high technology sector. Earlier in 2015, Shenzhen-based KuangChi Science took a controlling stake in Martin Aircraft which is aiming to be the world's first to market a commercial jetpack as a first responder vehicle for emergency services. Another new area of interest has been the cultural services sector. In June 2015, Dalian Wanda acquired Hoyts, New Zealand’second largest cinema chain, as part of the purchase of the Australasian Hoyts Group. (Hoyts had only recently been acquired by Sun Xishuang of the Dalian Yifang group, in December 2014.) New Zealand is a very open economy but also a relatively small economy. China’s annual increase in its ODI spend globally is equivalent to half the size of New Zealand’s US$200 billion economy. There is also a huge difference in the scale of our companies. New Zealand’s largest company, Fonterra, a dairy cooperative, has annual sales of NZ$20 billion, while Chinese companies like Alibaba are worth more than the annual output of the New Zealand economy. New Zealand’s regulatory criteria for foreign investment are intended to ensure that foreign investors in large projects and in farming are suitably qualified and of the highest integrity. The primary sector is the pillar of the New Zealand economy and particularly its export sector. All projects above NZ$100 million and all investments into rural land require the prior approval of the Overseas Investment Office. The process is transparent and more than 99% of applications to date have been approved. The large increase in Chinese investment indicates that the OIO process has not been proven to hinder investment. New Zealand remains, as it always has been, a net importer of capital. China now has one of the largest global pools of capital available to invest. With the FTA providing a sound framework for investment, it is not unexpected that Chinese enterprises are showing increasing interest in investing in New Zealand (as indeed they are doing elsewhere around the world). 20. New Zealand China Council Investment Report: Fostering Growth
FDI in China from New Zealand
Investment is very much a two-way affair, with New Zealand investors also active in China. Fonterra
is New Zealand’s largest investor in China with more than NZ$1 billion currently invested. Fonterra’s
farming business is building dairy hubs in North China with the aim of producing 1 billion litres of milk
annually by 2018. The first hub at Tangshan is now operational and a second hub in Ying County,
Shanxi Province is under construction. A third hub is expected to be built in Shandong province in
conjunction with Abbott, an infant nutrition company. In March 2015 Fonterra also completed a
NZ$755 million investment into infant formula manufacturer Beingmate to secure an 18.8% stake in
the company. Other major New Zealand investors in China include Fletcher Building, a building
materials manufacturer, and Nuplex, a specialties resin manufacturer (see case studies below).

New Zealand’s ODI remains relatively small as a share of GDP and has not has not increased
significantly in more than ten years. More than half of New Zealand’s ODI stock is in Australia. Despite
New Zealand’s merchandise exports to China being comparable to those to Australia, ODI in China
(including HKSAR) accounts for only 4% of New Zealand’s ODI total stock. The New Zealand
government encourages further investment from New Zealand into China.

Fig 15: China/HK is New Zealand’s fifth largest ODI destination, with 4% of total ODI stock.

             New&Zealand&ODI&stock&by&country/region&
                                2014&T&&immediate&investor&basis&

                                                                                 Total&$23.2&bn&

                            China"""
                                     Other"countries"
                             1%"
                                          18%"
       China,"HKSAR"
            3%" Malaysia"
                      3%"                                           Australia"
                                 UK"                                  53%"
                                 6%"
                                                                                               Source."StaKsKcs"New"
                                                                                               Zealand.""Immediate"
                                         USA"                                                  investor"basis"for"March"
                                                                                               year"2014.""
                                         16%"

21. New Zealand China Council Investment Report: Fostering Growth
INVESTMENT REGULATION
Investing in New Zealand
OIO application and approval process
Investments by overseas persons in ‘sensitive land’, ‘significant business assets’ and fishing quota are
regulated under the Overseas Investment Act 2005 (the Act), and consent is required from the
Overseas Investment Office (OIO). The Act acknowledges that it is a privilege for overseas persons to
own or control sensitive New Zealand assets.
'Sensitive land' includes non-urban land exceeding five hectares (i.e. farmland), any land that is part of
the foreshore or seabed or on certain offshore islands, and land over 0.4 hectares that includes or
adjoins certain sensitive areas such as conservation land, reserves, historic or heritage areas, lakes or
foreshore or seabed. This is not an exhaustive list.
‘Significant business assets’ includes business assets in New Zealand where the value of the securities
or consideration paid, or where the value of the assets of a company and its 25% or more subsidiaries
exceeds $100 million.
People who are not New Zealand citizens or who do not ordinarily reside in New Zealand must apply
for consent to invest in sensitive land or significant business assets. This requirement also applies
to overseas owned or controlled companies, other incorporated or unincorporated bodies, such as
partnerships or joint ventures, and trusts, as well as associates of overseas investors (who may be
New Zealanders). The regime applies whether the acquisition is made directly, or through the
acquisition of securities where the ‘overseas person’ acquires 25 percent or more of the securities.
If the applicant is investing in sensitive land and does not intend to reside in New Zealand indefinitely,
the OIO and the decision-making ministers must be satisfied the overseas investment will, or is likely
to, benefit New Zealand. If the land being acquired is non-urban and exceeds five hectares the
applicant will also be required to demonstrate that the benefit will, or is likely to be, ‘substantial and
identifiable’.
Benefits for sensitive land investments are assessed in accordance with 21 economic and non-
economic factors set out in section 17 of the Act and regulation 28 of the Overseas Investment
Regulations 2005 (the Regulations). These include:
• the creation of new job opportunities in New Zealand;
• the introduction into New Zealand of new technology or business skills;
• increased export receipts for New Zealand exporters;
• added market competition, greater efficiency or productivity, or enhanced domestic services in
New Zealand;
• the introduction into New Zealand of additional investment for development purposes;
• increased processing in New Zealand of New Zealand's primary products;
• improved walking access across the land; and
22. New Zealand China Council Investment Report: Fostering Growth• protection of indigenous flora and fauna.
Applications for consent should only address the benefits that are likely to flow from the investment.
Would-be investors should identify and focus on the key benefits of the investment; making
unnecessary or frivolous claims increases assessment times.
Overseas persons who are considering investing in New Zealand need to obtain advice from a lawyer
experienced in OIO matters early on, before entering into any purchase agreement and before seeking
OIO approval. Investors should also carefully read through the OIO’s website:
(http://www.linz.govt.nz/regulatory/overseas-investment/making-application/how-apply-for-
consent). Only once the OIO has been provided with all material information relating to the proposed
investment can it make a recommendation for consent.
As a consequence of the High Court decision Tiroa E and Te Hape B Trusts v Chief Executive of Land
Information6 (Tiroa E), the OIO and the decision-making ministers must also apply a “with and without”
test when assessing whether an overseas investment will, or is likely to, benefit New Zealand.
Applications to the IOI must, as a result, address what is likely to happen with the investment, and
what is likely to happen without the investment (the counterfactual). This means that investors will
need to ask what could reasonably be expected to occur if the proposed investment does not proceed
and fully explain this in any application letter.
The “with and without” test must also be applied to each of the relevant benefit factors (other than
some of those in regulation 28 for which such analysis is not appropriate). The practical effect of Tiroa
E is that an applicant’s acquisition of the land has to deliver a benefit over and above the benefit that
would be delivered by an alternative New Zealand owner.
If consent is granted the OIO will impose conditions requiring the applicant to implement its stated
business plan and demonstrate that any claimed benefits have arisen. Monitoring compliance with
conditions of consent is an important part of the OIO’s work. Failure to comply with conditions is a
serious matter and may result in enforcement action being taken.
The OIO endeavours to meet all commercial deadlines in assessing applications. However, given that
the OIO is always in receipt of numerous urgent applications, its ability to expedite or fast track an
application is often limited. Accordingly, applicants will need to factor in significant time to obtain
consent to the relevant transaction. Applicants must ensure any agreements entered in to incorporate
a sufficient OIO consent time frame.
Most major sensitive land applications are decided by two Ministers after receiving recommendations
from the OIO. All other decisions are made by the OIO under delegated authority.
6
Tiroa E and Te Hape B Trusts v Chief Executive of Land Information [2012] NZHC 147.
23. New Zealand China Council Investment Report: Fostering GrowthInvesting in China
Business and Investment Structures
Investment from any country or region outside the PRC Mainland (which includes Taiwan and the
Special Administrative Regions of Hong Kong and Macau) constitutes foreign investment in China.
Although China has encouraged foreign investment for over 25 years, the legal framework still
contains significant restrictions for investors and mandates a wide range of government approvals
and requirements that may be unfamiliar to New Zealand enterprises doing business in China for the
first time. However, proposals to lessen these restrictions were recently announced, which are
discussed in more detail below.
Limitations on foreign investment projects
The Chinese government’s Provisions for Guiding the Direction of Foreign Investment categorise
foreign investment projects as “encouraged”, “permitted”, “restricted” or “prohibited”. Specific types
of foreign investment that fall into the encouraged, restricted and prohibited categories are listed in
the Foreign Investment Industrial Catalogue (the latest version is effective from 10 April 2015). Any
person considering investing in China should consult the catalogue at an early stage. In general:
• projects that involve advanced or new technology are encouraged;
• projects in areas that are technologically backward, or belong to certain sectors that China is in
the process of gradually opening up (e.g. banking, telecommunications, legal services), are
restricted;
• projects that threaten public interest and national security or that may cause serious
environmental pollution are prohibited; and
• projects not listed in the Catalogue are generally considered permitted and do not require
special approval.
Approval Authority
Foreign investment in China is subject to a system of multi-tiered approvals.
Several factors may determine which government authority has jurisdiction over a particular
company establishment. For example, if the total investment of a foreign invested enterprise (FIE) is
sufficiently high, approvals from both the National Development and Reform Commission and the
Ministry of Commerce (MOFCOM) would be needed, as opposed to MOFCOM alone. Moreover, the
investment amount may also determine whether the provincial, municipal or district-level MOFCOM
office will be the approval authority over a given project.
Additionally, if the FIE is in a specific business sector, special approvals of the FIE’s business scope
may be necessary. Chinese enterprises are required to have narrowly defined business scopes, and
if the business described falls under the supervision of a particular government agency, an
approval from that body may be required in addition to a general approval from MOFCOM.
24. New Zealand China Council Investment Report: Fostering GrowthA single project will usually involve the approval of more than one governmental agency, even if the FIE will not engage in a specially-regulated business sector. With the assortment of authorities involved, government supervision is found almost everywhere. For foreign exchange issues, the approval of the State Administration of Foreign Exchange or its local counterpart is required. For land use and real property matters, approval by the State Land Administration Bureau or its local counterpart is necessary. For Joint Ventures where a Chinese State-owned Enterprise is to contribute its tangible assets as its capital contribution into a JV, the State-owned Assets Administrative Commission will be involved in approving the asset appraisal and contribution. Specific and preferential tax treatment is approved by the State Administration of Taxation along with the State Council. The appropriate government approvals will need to be secured. Some local governments may offer certain preferential treatment and approvals but may not have the legal authority to grant those rights. An FIE that has been improperly approved may be subject to invalidation at a later time. So it is always important to ensure that all required governmental approvals have been obtained from the proper level and proper agency of the Chinese government. Equivalent government approvals are also generally required for the acquisition of a company by way of an M&A transaction. While the acquisition of a business through an asset purchase will not itself require any government approval, the establishment of the FIE that is to undertake the acquisition will require the equivalent government approvals. Foreign Investment Structures Foreign investment in China typically takes the form of either a Joint Venture (JV) or a Wholly Foreign-owned Enterprise (WFOE). JVs were the first investment structure allowed and were therefore the most common vehicle for many years. Since China began to liberalise its investment policies, and particularly after its accession to the World Trade Organisation, WFOEs became the preferred FIE structure in most unrestricted industries. JVs and WFOEs each have their own benefits and disadvantages. Many foreign investors are attracted to the WFOE structure because it allows the foreign party to have complete control over the management of the enterprise, major financial decisions, and the use of intellectual property rights. JVs allow inexperienced China investors to work closely with a local partner who may have significant contacts with the local business community, specific geographic or industry knowledge, and experience with government relations. Joint Ventures can be either Sino-Foreign Equity Joint Ventures (EJVs) or Sino-Foreign Cooperative Joint Ventures (CJVs). Equity Joint Ventures An EJV is an independent legal person with limited liability. The JV partners contribute capital to the enterprise and enjoy rights to a percentage of the profits equal to the paid-in capital. Capital contributions may be in cash or in-kind (e.g. land use rights, buildings, intangible assets or 25. New Zealand China Council Investment Report: Fostering Growth
You can also read