Bigger ships - what are the implications for New Zealand? - Past, present and future implications for New Zealand supply chains - New Zealand ...
←
→
Page content transcription
If your browser does not render page correctly, please read the page content below
Bigger ships – what are the
implications for New Zealand?
Past, present and future implications for New Zealand
supply chains

NZIER report to New Zealand Shippers’ Council
5 December 2017
About NZIER
NZIER is a specialist consulting firm that uses applied economic research and analysis
to provide a wide range of strategic advice to clients in the public and private sectors,
throughout New Zealand and Australia, and further afield.
NZIER is also known for its long-established Quarterly Survey of Business Opinion and
Quarterly Predictions.
Our aim is to be the premier centre of applied economic research in New Zealand. We
pride ourselves on our reputation for independence and delivering quality analysis in
the right form, and at the right time, for our clients. We ensure quality through
teamwork on individual projects, critical review at internal seminars, and by peer
review at various stages through a project by a senior staff member otherwise not
involved in the project.
Each year NZIER devotes resources to undertake and make freely available economic
research and thinking aimed at promoting a better understanding of New Zealand’s
important economic challenges.
NZIER was established in 1958.

Authorship
This paper was prepared at NZIER by Killian Destremau.
It was quality approved by John Ballingall.
The assistance of Deborah O’Connor and Sarah Spring is gratefully acknowledged.

L13 Willeston House, 22-28 Willeston St | PO Box 3479, Wellington 6140
Tel +64 4 472 1880 | econ@nzier.org.nz
© NZ Institute of Economic Research (Inc) 2012. Cover image © Dreamstime.com
NZIER’s standard terms of engagement for contract research can be found at www.nzier.org.nz.
While NZIER will use all reasonable endeavours in undertaking contract research and producing reports to ensure the
information is as accurate as practicable, the Institute, its contributors, employees, and Board shall not be liable (whether in
contract, tort (including negligence), equity or on any other basis) for any loss or damage sustained by any person relying on
such work whatever the cause of such loss or damage.
Recommendations
       1. Government should focus on maintaining strong domestic
          competition across the shipping sector
       •       To support New Zealand’s potential gains from the emergence of bigger
               ships, the government needs to ensure sound competition across the
               supply chain.
       •       Improving the domestic competitive environment would ensure that port
               investment would be appropriate for individual ports’ business models
               (including investing to the right size of vessels that will be deployed for their
               port)1.
       2. Officials should closely monitor global shipping fleet developments
       •       International shipping lines consolidation, while not yet identified as a
               major risk to New Zealand shippers, requires monitoring to manage the risk
               of diminishing competition.
       3. Government as an infrastructure provider must work closely with
          industry stakeholders to minimise total transport costs
       •       If New Zealand is to keep pace with the global shipping industry’s move to
               larger container ships, there must be integrated planning of investments.
       •       The opportunity and challenge for government is understanding how it can
               support supply chain coordination that is already taking place, and provide
               greater certainty for industry stakeholders.
       4. Any future Ports study should look ‘beyond the border’ too
       •       Any future ports strategy work needs to be widened to become a supply
               chain strategy to ensure integrated planning of investments or policy
               affecting road, rail, ports and coastal shipping.
       •       Government must align its policies on ‘behind the border’ infrastructure
               provision (road and rail) with its coastal shipping and port strategies to the
               reality of bigger ships so that shippers, ports and shipping lines can invest
               with greater certainty.

   1
           Policies to foster sound competition across the supply chain recommended by the NZPC’s 2012 international freight
           transport services inquiry have yet to be fully implemented. We think these represent a good starting point.

NZIER report – Bigger ships – what are the implications for New Zealand?                                                       i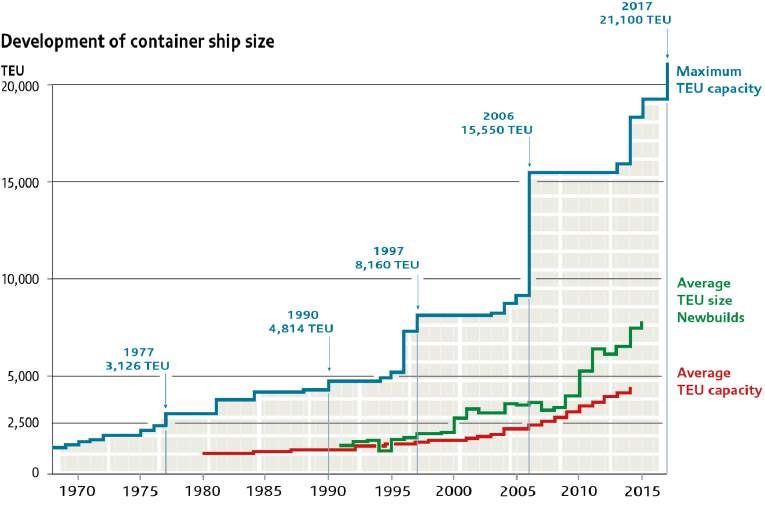
Key points
We have been asked to revisit the issue of bigger ships in New Zealand
This research tests the conclusions reached in the New Zealand Shippers’ Council’s
(NZSC) 2010 and 2012 reports in light of recent developments globally and in New
Zealand. We then review potential implications of bigger ships for New Zealand.
We do not attempt to identify New Zealand’s optimal port configuration, although we
do make some suggestions about factors that need to be considered.
NZSC was concerned about transhipment risks and recommended all
New Zealand ports become bigger ship capable over time
The NZSC’s 2010 report identified the risk that shipping services might become
‘boutique’ in New Zealand (that is, serviced by smaller and old vessels) or might
increasingly be hubbed through Australia.
It recommended that two ports (Tauranga (POT) and Lyttelton Port) invest to become
7,000 TEU ships capable over the next 5 years and that all four major container ports
in New Zealand (Ports of Auckland (POAL) and Port Otago along with POT and Lyttelton
Port) become bigger ships capable eventually.

5 years on from NZSC’s 2010 and 2012 reports, what has happened?
Our 2017 review shows that the concern that gave rise to the NZSC’s 2010 and 2012
reports is now unlikely to be realised.
The scenario that large volumes of New Zealand’s imports and exports would be
transhipped through Australia has not materialised. New Zealand will not be bypassed
by bigger ships.
Instead, ports have invested in their capacity to cater for bigger ships and are looking
to increase it going forward.
Between 2012 and 2017, the number of port visits by ships with a capacity greater
than 4,000 TEU has dramatically increased at New Zealand’s largest international
ports. Furthermore, most New Zealand ports have invested or have plans to invest
to accommodate bigger ships with a capacity ranging from 6,000 to 9,500 TEU.
The increases in capacity at New Zealand ports since 2012 are broadly in line with the
NZSC’s 2010 and 2012 recommendations.
Since the global financial crisis (GFC), growth in capacity through the building of bigger
ships globally has outpaced sluggish demand and depressed freight rates worldwide,
leading to the consolidation of shipping lines. This overcapacity has been the result of
the introduction of mega-ships or ULCVs.
Hence since the original NZSC reports, while bigger ships have indeed been introduced
to New Zealand and lowered freight rates, global shipping overcapacity has had a much
greater impact on New Zealand’s export and import costs.
New Zealand is currently benefiting from historically low freight rates. The cost per
TEU is now a third of what it was in 2009 on the Shanghai to Australia/New Zealand
route (UNCTAD, 2016).

NZIER report – Bigger ships – what are the implications for New Zealand?                ii
Looking ahead, two different visions exist for the future of New
Zealand’s international freight system
Shippers, ports and shipping lines interviewed as part of this study described one of
two potential future freight systems:
     •     Hub-spoke model – two ports would accommodate larger ships (over 6,000
           TEU). Other ports would retain some international calls but would provide
           feeder service – spokes – to the hub ports.
     •     String service model – bigger ships would call along the East Coast to four
           ports. The size of ships under a string service model are expected to be in
           the order of 6,000 TEU.
They are not mutually exclusive and to some extent will coexist. The debate is a matter
of degree between the two visions rather than a strict one or the other choice.
Since mid-2016 there are signs that, and an emerging debate on, the port sector is
moving towards a hub-spoke model given the recent significant increase in
transhipment volumes (40% between 2016Q3 to 2017Q2).

The future structure of New Zealand’s supply chains and where
investment should take place remain uncertain
The two different future visions for New Zealand’s supply chain reflect the fact that
supply chains could evolve in many ways as container ships increase in size.
Because it is uncertain as to how bigger ships will be introduced in New Zealand, there
is uncertainty about where investment by shippers, ports and shipping lines should
take place and what the future transport costs for New Zealand shippers might be.
The hottest debated issue currently is by far potential overinvestment at ports.
This would occur because shipping lines introducing bigger ships would call fewer ports
– only those with sufficient container volumes to justify introducing bigger ship
services in New Zealand.

The objective of shippers, ports, shipping lines and government is to
minimise total transport cost as bigger ships are introduced
Bigger ships are beneficial to New Zealand if they reduce total transport cost. The total
transport cost is the cost of moving containers across the supply chain, not just the
shipping cost. Total transport cost is broken down into two parts:
     1.    Handling costs – the transport cost between the gate and the port (including
           the handling cost at the port)
     2.    Vessel cost – the shipping transport cost (OECD/ITF, 2015).

As ships get bigger, the shipping transport cost (or vessel cost) per container falls but
these may not be entirely passed on, as shipping lines recover from years of losses.
Conversely the handling cost per TEU tends to increase as ships get bigger if the port
sector consolidates into a small number of hubs which could increase handling costs
(especially in the most remote regions to hub ports).
Who pays for the investment cost to cater for bigger ships also needs to be considered.
Another risk for shippers is around port investment. If a port invests in getting bigger
ship capable but bigger ships do not call that port, existing shippers may have to bear
the cost of the sunk investments but without the savings that come with bigger ships.

NZIER report – Bigger ships – what are the implications for New Zealand?                 iii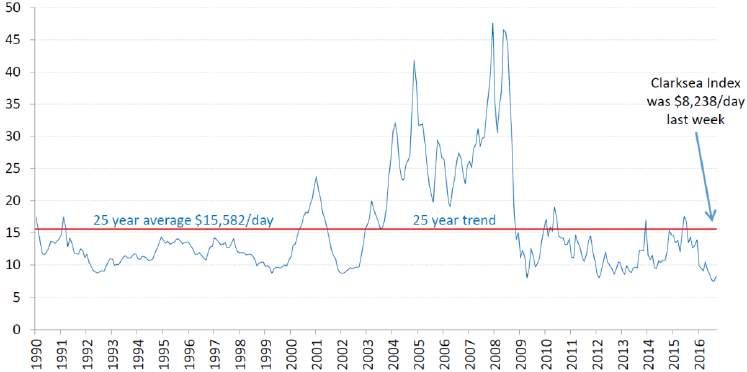
Defining the underlying problem caused by bigger container ships
Bigger ships have drawn attention to port capacity (particularly dredging because it is
costly). But the supply chain response to leverage the benefits from bigger ships is
equally if not more important, for both industry and public policy.
The core of the big ships issue is not the ability of ports to invest but ensuring that the
whole of the supply chain can adapt to bigger ships and gain competitiveness by
lowering total transport cost.
The overarching question which needs to be answered is how to best ensure that New
Zealand’s future freight system configuration accommodates larger ships in a way
that minimises total transport costs.
The challenge for ports, shipping lines and government is to coordinate investments
to best deal with the uncertainty bigger ship create and maximise the benefits and
minimise the costs of bigger ships for New Zealand.
The problem definition for government is to improve the quality of the regulatory
environment and its approach to providing infrastructure in response to container
ships increasing in size.

Maintaining sound competition is New Zealand’s key insurance for
maximising benefits from bigger ships
Maintaining a sound competitive environment, whether the port sector evolves as a
hub-spoke or string system (or anywhere in between), is in our view the best approach
to ensuring that total transport cost is minimised. If government wishes to take a more
hands-on approach, it is unlikely that total transport costs will be minimised.

Bigger ships are already having important implications for New
Zealand’s supply chains
The increasing ship size in New Zealand and internationally is already having an impact
on supply chains. Coordination is taking place across the supply chain between
shippers, ports and shipping lines to provide greater certainty for investment.
Government must work alongside these efforts and consider how its own actions
either improve or worsen the certainty with which shippers, ports and shipping lines
can respond to ships getting bigger.
Both the domestic and international supply chain competitive environments are
affected. The consolidation of international shipping lines is of concern to shippers
particularly, who are worried that competition between shipping lines is diminishing.
Shipping lines, ports and shippers interviewed as part of this project do not yet deem
this a major risk.
Domestically, the industry considers the competitive environment as generally sound.
There are no major concerns around current or future increases in bargaining power
that might compromise efforts to minimise total transport cost.

NZIER report – Bigger ships – what are the implications for New Zealand?                 iv
Contents
1. Scope and approach ................................................................................................ 1
1.1. Research questions .................................................................. 1
1.2. Our approach ........................................................................... 1
1.3. Our focus ................................................................................. 1
2. Background on bigger ships .................................................................................... 2
2.1. Ships are getting bigger globally .............................................. 2
2.2. Mega-ships are displacing smaller ships on other routes as a
cascade effect .......................................................................... 3
2.3. Ships visiting New Zealand are getting bigger as a result ....... 3
3. Overview of the bigger ship debate in New Zealand .............................................. 5
3.1. New Zealand Shippers’ Council – 2010 and 2012 reports ....... 5
3.2. New Zealand Productivity Commission – International Freight
Transport Services Inquiry (2012)............................................ 6
3.3. Ministry of Transport – Freight Futures Study (2014) ............. 7
3.4. The debate is not limited to New Zealand .............................. 8
4. Framing the issue of bigger ships for New Zealand ................................................ 9
4.1. Framework: total transport costs rather than shipping transport
cost alone................................................................................. 9
4.2. Determining the shape of the curves for New Zealand is difficult
............................................................................................... 11
5. How has New Zealand adjusted to bigger ships since 2010?................................ 13
5.1. New Zealand container trade volumes grew despite a slow
global recovery ...................................................................... 13
5.2. New Zealand ports are investing to cater for bigger ships .... 14
5.3. Port market structure changes spark debate over hub-spoke
future ..................................................................................... 17
6. Looking forward – what trends will affect the future of bigger ships in New
Zealand? ................................................................................................................ 22
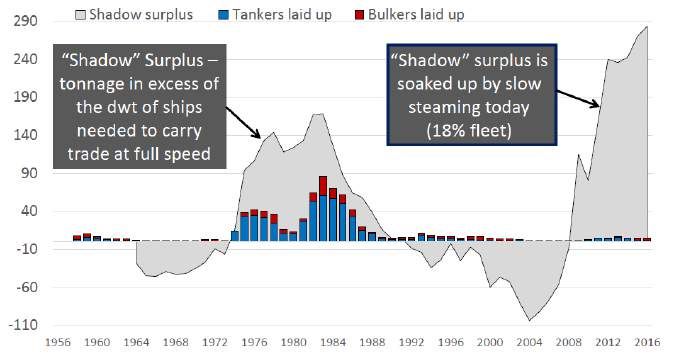
6.1. The global shipping industry is in a major state of disequilibrium
............................................................................................... 22
6.2. Freight rates have reached record lows ................................ 24
6.3. Container ship scrappage is at an all-time high ..................... 26
6.4. Global economic outlook is positive but the recovery is expected
to be prolonged ..................................................................... 27
6.5. Panama Canal widening’s contribution to the cascade effect
could be exaggerated ............................................................ 28
6.6. Alliances are still growing, leading to further consolidation . 30
6.7. The impact of the ‘cascade effect’ on New Zealand ............. 31
7. Key themes from interviews ................................................................................. 33
NZIER report – Bigger ships – what are the implications for New Zealand? v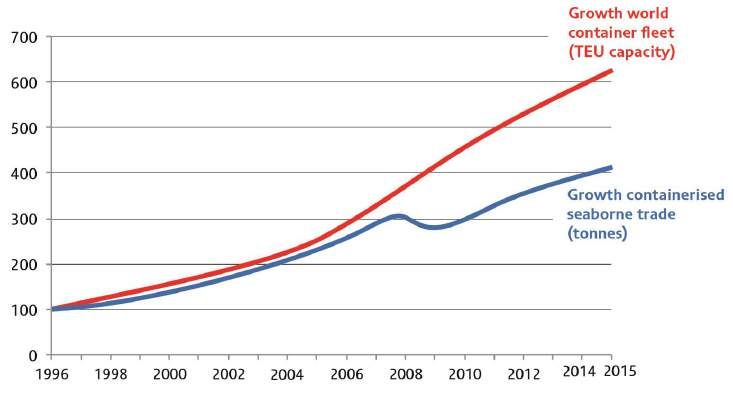
7.1. Low freight rates force shipping lines to cut costs but they
remain unsustainable ............................................................ 33
7.2. Container ships will increase in size ...................................... 33
7.3. Which ports would invest? .................................................... 33
7.4. Government action can distort market signals ..................... 33
7.5. The shippers-ports-shipping lines competitive environment is
sound overall ......................................................................... 34
7.6. Bigger ships create uncertainty that the supply chain is adjusting
to ............................................................................................ 34
7.7. The main risk from distortions is unsustainable supply chains34
7.8. Two different visions for New Zealand’s port system ........... 35
7.9. MOT’s Freight Futures Study was not well received ............. 35
7.10. Congestion, transit times as well as payment are practical
challenges .............................................................................. 36
7.11. Social licenses to operate ...................................................... 36
8. Implications for industry and government............................................................ 37
8.1. Does the conclusion that bigger ships will drive lower freight
rates still hold true? ............................................................... 37
8.2. What is the impact if multiple ports invest in dredging to
compete for bigger ships? ..................................................... 39
8.3. Are bigger ships a good or a bad thing for shippers? ............ 39
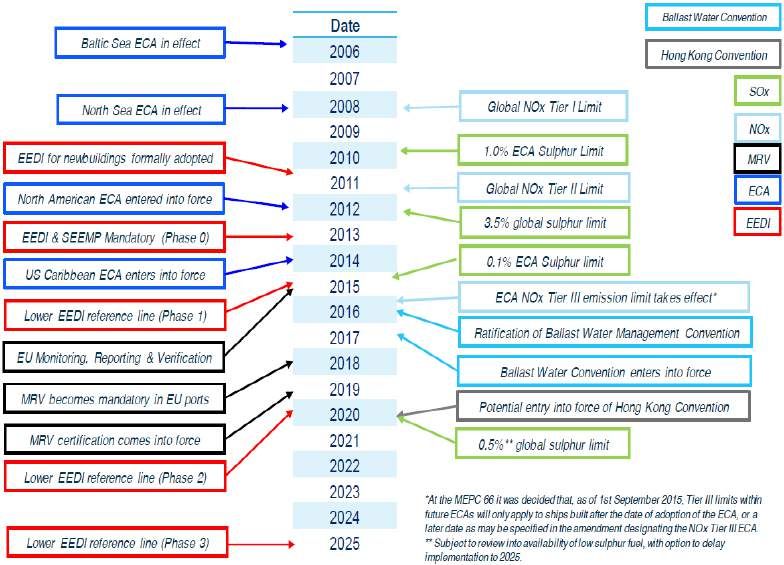
8.4. Are there new implications that need to be considered? ..... 40
8.5. The policy implications of bigger ships .................................. 42
Appendices
Appendix A Bibliography.............................................................................................. 46
Appendix B Supporting information ............................................................................ 52
Appendix C Most relevant NZPC recommendations to bigger ships ........................... 59
Appendix D List of interviewees .................................................................................. 60
Figures
Figure 1 Increasing container ship sizes ...................................................................................... 2
Figure 2 Order book is very skewed towards bigger ships .......................................................... 3
Figure 3 Bigger ships (over 4,000 TEU capable) are increasingly calling at most New Zealand
ports ............................................................................................................................................ 4
Figure 4 Bigger ships are replacing ‘medium’ sized ships ............................................................ 4
Figure 5 As ships get bigger, so do the costs to accommodate bigger ships at ports ................. 8
Figure 6 The trade-offs of bigger ships calling New Zealand ....................................................... 9
Figure 7 Export and import volumes are growing at a relatively similar rate ........................... 13
Figure 8 New Zealand port capacity to cater for bigger ships as of 2014 – some ports have
invested since then which are summarised in Table 1 .............................................................. 15
Figure 9 NZ port sector market structure .................................................................................. 17
NZIER report – Bigger ships – what are the implications for New Zealand? vi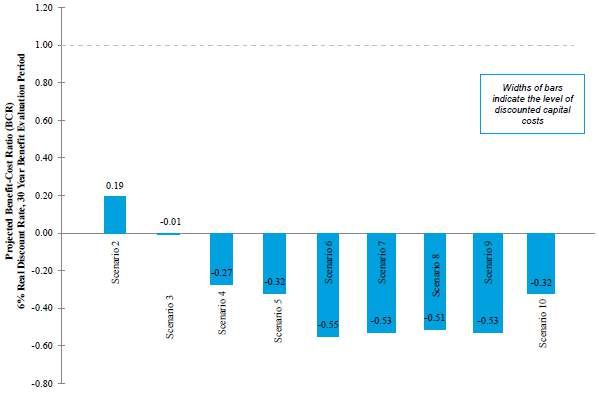
Figure 10 Almost all of the increase in containers handled by bigger ships over the last two
years has taken place at POT ..................................................................................................... 18
Figure 11 Trends in TEU loads and discharges in New Zealand ................................................. 19
Figure 12 Share of total exports transhipped has just started to rise ....................................... 19
Figure 13 The increase in container handling across New Zealand’s combined ports is being
met primarily by road ................................................................................................................ 21
Figure 14 For the first time since 2012, the use of rail for container movement has increased
................................................................................................................................................... 21
Figure 15 Disconnection between container ship size capacity and seaborne trade growth ... 22
Figure 16 The shipping super cycle, capacity laid up and slow steaming .................................. 23
Figure 17 The ClarkSea Index is at its lowest level in 20 years .................................................. 24
Figure 18 New Zealand’s shipping costs have plummeted ........................................................ 25
Figure 19 Oil prices have come down significantly since 2010/2012 and are not projected to
increase substantially in the near term ..................................................................................... 26
Figure 20 Steel prices have recovered as China cuts production but still remain subdued ...... 27
Figure 21 Change in ship sizes on the USEC route as a result of the Panama Canal expansion 29
Figure 22 Increasing concentration in the container shipping industry .................................... 31
Figure 23 Are Oceania ports one of the last routes that the cascade effects would impact? ... 32
Figure 24 Environmental regulation timeline for shipping ........................................................ 41
Figure 25 MOT’s hub-spoke scenarios ....................................................................................... 52
Figure 26 About half of containerised export growth has come from dairy ............................. 52
Figure 27 Growth in New Zealand container exports has been almost entirely to Asia ........... 53
Figure 28 Container import growth has mostly come from chemicals, plastic and foodstuffs . 53
Figure 29 Growth in imports has been broader geographically than exports ........................... 54
Figure 30 Imports’ and exports’ container handling at New Zealand ports .............................. 55
Figure 31 Exports: transhipment loading and discharges.......................................................... 56
Figure 32 Imports: transhipment loading and discharges ......................................................... 57
Figure 33 POT and Port Otago are increasingly using rail to move containers in and out ........ 58
Figure 34 Shipping containers moved from Auckland to Bay of Plenty and within Otago
account for all the growth in the use of rail for container movement ...................................... 58

Table
Table 1 Recent investment developments by New Zealand ports for bigger ships .................. 16

NZIER report – Bigger ships – what are the implications for New Zealand?                                                                          vii
1. Scope and approach
1.1.          Research questions
The purpose of this research is to test the conclusions reached in the New Zealand
Shippers’ Council’s (NZPSC) 2010 and 2012 reports considering developments globally
and in New Zealand since those reports were published. Specifically, this report seeks
to answer the following research questions:
     •     In 2017, in light of the developments, including significant consolidation of
           shipping lines in the shipping industry, are the conclusions still valid?
     •     Given significant reductions in freight rates over the last two years, do the
           previous conclusions that bigger ships will drive lower freight rates hold
           true in the current environment and what would that do to sustainability?
     •     What is the impact for New Zealand shippers if multiple ports invest in
           dredging and other infrastructure improvements to compete for bigger
           ships? For shippers is this a good or a bad thing?
     •     Are there new implications that need to be considered?
     •     Are there new policy recommendations?

1.2.          Our approach
Our approach consists of a desktop-based review of the global and New Zealand trends
affecting the shipping industry since 2012, followed by stakeholder interviews. The list
of interviewees is provided in Appendix B.
The project had three main stages:
     •     Desktop review of trends – review both global and New Zealand trends
           including data analysis (lower trade volumes, capacity oversupply, shipping
           industry alliances) but also the current or potential impacts of investments
           (e.g. widening of the Panama Canal)
     •     Develop hypotheses based on trends – how might the trends identified
           above contradict or confirm NZSC’s earlier conclusions? Have those trends
           increased or reduced New Zealand’s need to accommodate bigger ships?
     •     Key stakeholder interviews – test the hypotheses with key stakeholders,
           supported by our desktop analysis.

1.3.          Our focus
Our focus is on the impact of bigger ships on New Zealand’s freight system taken as
whole and whether there are new implications or recommendations for action at a
high level.
We do not investigate whether specific actions by actors in the supply chain (ports,
shippers, shipping lines) have been beneficial or not. Similarly, we were not asked to
determine the optimal port configuration as ships get bigger.

NZIER report – Bigger ships – what are the implications for New Zealand? 1
2. Background on bigger ships
2.1. Ships are getting bigger globally
2.1.1. Ship size has been increasing since the
first days of containerisation
Over the last 50 years, international trade has become increasingly containerised,
meaning goods traded across borders are packed into containers.
In the search for transport cost savings, container ships themselves are getting bigger.
This trend is accelerating. Between 2001 and 2008 the average size for new ships was
3,400 TEU; over 2009 to 2013 it increased to 5,800 TEU. In 2015 the average build was
8,000 TEU (OECD/ITF, 2015).
Figure 1 Increasing container ship sizes
Source: OECD/ITF, 2015
2.1.2. What are mega-ships/ULCVs?
The term mega-ship is being used for the latest generation of container ships
(OECD/ITF, 2015). They are also referred to as Ultra Large Container Vessels (ULCV).
These ships have a capacity in the order of 21,000 TEU. There are already plans for the
next generation of container ships which are expected to reach a capacity of 24,000
TEU (OECD/ITF, 2015).
NZIER report – Bigger ships – what are the implications for New Zealand? 22.2. Mega-ships are displacing smaller ships
on other routes as a cascade effect
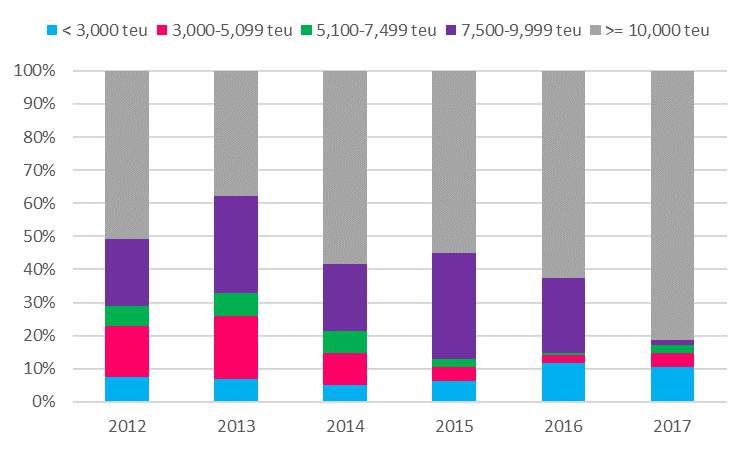
The current order book (the orders shipping lines place for new ships to be built) for
container ships is skewed towards mega-ships. The higher proportion of mega-ship
orders compared to other ship sizes triggers a cascade effect2 on the structure of the
global container fleet.
Figure 2 Order book is very skewed towards bigger ships
Anticipated deliveries
Source: MOT, 2016
Mega-ships are replacing the latest generation of big ships which must be moved to
another route (mega-ships are introduced on the North Europe-Far East trade because
it is relatively unconstrained, one of the longest by distance and with high trade
volumes). They in turn displace the generation of ships before that and so on
(OECD/ITF, 2015).
2.3. Ships visiting New Zealand are getting
bigger as a result
The global container shipping cascade effect is contributing to an increase in the size
of ships visiting New Zealand. Between 2012 and 2017, the number of port visits by
ships with a capacity greater than 4,000 TEU has dramatically increased at New
Zealand’s largest international ports.
2
The 'cascade effect’ is the process by which older generations of big ships (still larger than ships visiting New Zealand
currently) are potentially being “bumped” from their current routes towards New Zealand routes.
NZIER report – Bigger ships – what are the implications for New Zealand? 3Figure 3 Bigger ships (over 4,000 TEU capable) are increasingly
calling at most New Zealand ports
International port visits for ships 4,000 TEU capable and over; Counts visits to individual ports (so the
totals are higher than the number of ships visiting New Zealand)
Source: MOT, 2017
Bigger ships in New Zealand have replaced ‘medium’ sized ships. Much of the
transition towards larger ships in New Zealand occurred over 2013, this has slowed
down since then.3 Container exchanges by 4,000 to 6,000 TEU ships has remained more
or less constant since 2015 (but at a much higher share than in 2012), but 6,000+ TEU
ships are now beginning to make their way to New Zealand.
Figure 4 Bigger ships are replacing ‘medium’ sized ships
By international ship size; As a proportion of total TEU exchanges
Source: MOT, 2017
3
This slowing down maybe exaggerated due to the ‘line in the sand’ thresholds for different ship size categories, but it does
reflect the relative lumpiness of the introduction of bigger ships.
NZIER report – Bigger ships – what are the implications for New Zealand? 43. Overview of the bigger ship
debate in New Zealand
The bigger ship debate has attracted lots of attention. Three key research pieces in
New Zealand have had a major impact on the debate and provide a good summary of
the competing views on the issue.
3.1. New Zealand Shippers’ Council – 2010
and 2012 reports
The New Zealand Shippers’ Council produced the first landmark report on the question
of bigger ships in 2010, with an update in 2012 (which largely confirmed the
conclusions reached in the 2010 report). Below we provide a summary of the findings
and recommendations of these two reports.
3.1.1. New Zealand is at risk if ports do not
invest to accommodate larger ships
NZSC’s 2010 report made the case that if New Zealand’s ports did not invest in
becoming bigger ship capable, there was a risk that shipping services would become
‘boutique’, meaning that New Zealand would be serviced by relatively small and old
vessels (by international standards). Furthermore, New Zealand’s trade could be
transhipped through Australian ports such as Melbourne, Sydney, or Brisbane, adding
cost and potential delays (NZSC, 2010).
3.1.2. Bigger ships are an opportunity for New
Zealand
The NZSC estimated that New Zealand could realise up to NZ$144 million per year of
net supply chain benefits from 2015/164. These benefits assumed two ports become
7,000 TEU ship capable. The benefits from the increase in ship size was tested against
the counterfactual that trade would otherwise be transhipped through Australia
(NZSC, 2010).
3.1.3. Recommends investment in four hub ports
Based on projected container volumes and the benefits from catering for bigger ships
relative to the potential of transhipment through Australia, NZSC recommended that
two ports (POT and Lyttelton Port) invest to become 7,000 TEU ship capable within five
years, and that all four major container ports (POAL, POT, Lyttelton Port and Port
Otago) eventually will have to become bigger ships capable (NZSC, 2010).
4
The review or update of this estimate is out of scope.
NZIER report – Bigger ships – what are the implications for New Zealand? 53.2. New Zealand Productivity Commission –
International Freight Transport Services
Inquiry (2012)
3.2.1. At odds with the NZSC approach
In 2012 the New Zealand Productivity Commission (NZPC) released their findings from
their International Freight Transport Services Inquiry (Freight Inquiry). The report
acknowledged but also contested the NZSC’s approach, conclusion and
recommendations.
The NZPC’s principal rebuttal was that higher costs to consumers are punished in
competitive marketplace:
Shippers are unlikely to pay more for an inferior service, and
shipping lines are unlikely to ‘leave money on the table’ by missing
an opportunity for profit (NZPC, 2012).
Competing shipping lines would have an incentive to reinstate a
direct New Zealand-Singapore service and capture some of this
revenue. Hubbing via Australia will only be viable should it provide
a lower price or improved service quality than the status quo (NZPC,
2012).
The report concluded:
The Commission cautions against using the ‘Australian hubbing’
scenario to justify investment in bigger ship readiness or central
government planning of port infrastructure (NZPC, 2012).
3.2.2. NZPC recommended a cautious and
tailored approach
The NZPC acknowledged that bigger ships do raise questions around the coordination
of investments to be made, particularly at ports.
But the report disagreed with the NZSC approach to defining the problem and
estimating the risks associated with it. It recommended that the framework on which
to base government decisions when confronted with the question of bigger ships must
be more robust (NZPC, 2012).
It also noted that there is a role for the government to play as part of those
coordination challenges but it must be wary of over-extending:
Governments can usefully promote this process by facilitating
information sharing and discussion about different options, while
ensuring that there is adequate coordination between different
levels of government and between their own investment decisions
when these cut across transport modes.
NZIER report – Bigger ships – what are the implications for New Zealand? 6But if the government adopts a strong leadership approach, it may
well choose an inferior option, based on incomplete information
(NZPC, 2012).
Because the question of bigger ships is complex, the strength of the approach and the
robustness of the framework must be comprehensive enough to deal with the
complexity if it is to help decision-makers understand the opportunities but also the
trade-offs associated with bigger ships. The government can play a role, but it must
understand the limitations of its role under uncertainty.
3.3. Ministry of Transport – Freight Futures
Study (2014)
In 2014, Deloitte released a study commissioned by the MOT about the future of
freight in New Zealand. Its focus was on the potential evolution of the port sector in
New Zealand and how different scenarios of port hub-spoke system would impact the
New Zealand economy (see Figure 27).
3.3.1. The study considered various future
potential hub-spoke port scenarios
Ten possible scenarios were discussed. They differed by varying degrees of hub-port
concentration and permutations of which ports would arise as hubs (while the others
would become feeder ports).
3.3.2. Estimated benefits from bigger ships but
also operational and capital costs
The study took a cost-benefit analysis (CBA) approach and looked at port capacity but
also the required investments in road and rail depending on the port system (hub-
spoke) configurations.
It considered both operational costs (lower freight rates with potential increase in
transport within New Zealand to consolidate volumes to hub ports) and capital costs
(infrastructure investments required to accommodate larger ships through ports, road
and rail).
3.3.3. Concluded that bigger ships may not be
welfare enhancing to New Zealand
The study concluded that as the ships get bigger, the costs outweigh the benefits. No
alternative hub and spoke scenario passes the cost-benefit test (see Figure 5).
NZIER report – Bigger ships – what are the implications for New Zealand? 7Figure 5 As ships get bigger, so do the costs to accommodate bigger
ships at ports
Projected Benefit-Cost Ratio (incremental to Scenario 1)
Source: MOT, 2014
3.4. The debate is not limited to New
Zealand
The OECD/ITF (2015) makes the same argument for ports and shippers globally (it
focused specifically on mega-ships but the conclusions are still relevant for New
Zealand as we consider the question of bigger ships) as the MOT study:
There are cost savings of mega-ships, but these are decreasing and
might not even be realized. The transport costs due to larger ships
could be substantial. There are size-related fixes to existing
infrastructure, such as bridge height, river width/depth, quay wall
strengthening, berth deepening, canals/locks and port equipment
(crane height, outreach).
Mega-ships also require expansion of infrastructure to cater to the
higher peaks related to mega-ships; as a result, more physical yard
and berth capacity is needed. A substantial share of the dredging,
infrastructure and hinterland connection costs are costs to the
public sector in many countries (OECD/ITF, 2015).
NZIER report – Bigger ships – what are the implications for New Zealand? 84. Framing the issue of bigger
ships for New Zealand
To understand how bigger ships will affect New Zealand’s future, we must first very
clearly frame the issue of bigger ships.
4.1. Framework: total transport costs rather
than shipping transport cost alone
Our framework for this analysis is the total transport cost of moving containers across
the supply chain, not just the shipping cost. The total transport cost is broken down
into two parts:
3. Handling costs – the transport cost between the gate and the port (including
the handling cost at the port)
4. Vessel cost – the shipping transport cost (OECD/ITF, 2015).
Figure 6 The trade-offs of bigger ships calling New Zealand
The shape of the curves are for illustrative purposes only and explain the trade-offs involved with bigger
ships. They are not representative of the relative magnitude of handling and vessel costs per TEU.
NZ current? NZ minimum total
transport costs
Source: OECD/ITF, 2015
As ships get bigger, the shipping transport cost (or vessel cost) per container falls.
There is however a decreasing marginal reduction to this cost meaning that the cost
NZIER report – Bigger ships – what are the implications for New Zealand? 9reduction per container for future bigger ships visiting New Zealand (above 5,000 TEU)
will be lower than for the previous increases in ship size (OECD/ITF, 2015).
Conversely the handling cost per TEU increases as ships get bigger for two reasons:
• Operational costs – the longer distance that the container must travel to
the hub port to be loaded onto bigger ships (which may not apply in every
situation)
• Capital costs – the infrastructure investments in road, rail, coastal shipping
and at the ports themselves to cater for bigger ships (assuming that capital
costs are recovered through pricing the use of the infrastructure which
would increase the total handling costs on a per TEU basis).
It is important to distinguish between capital costs at the ports and capital
costs to provide road, rail and coastal shipping infrastructure. They do not
necessarily move in the same direction.
4.1.1. Total transport cost is more than just the
freight rate
Vessel cost
The overcapacity of bigger ships has led to slow steaming.5 This means that the
‘cheaper’ headline freight rate per TEU of bigger ships is at least partially offset by the
implicit cost of reducing the speed at which the ships travel.
Handling costs
Managing transit times will be crucial considerations for shippers and cargo owners.
Bigger ships could lead to a reduction in port call frequency (the number of port visits).
This would be an important issue for New Zealand, due to the seasonal and perishable
nature of many of our export products. There perhaps is an upper bound on how
frequently large ships can visit before the frequency of port calls, even at hub ports,
becomes too much of a risk.
To further manage transit times, existing land side congestion issues at ports will need
to be addressed as bigger ships would lead to greater ‘spikes’ in containers exchanged.
Finally, to the extent that bigger ships may lead to further supply chain integration it
would provide savings to be shared across the supply chain.
Social costs (visual amenity, emissions, noise, injuries, fatalities, road
congestion)
Social costs, particularly emissions, are an integral part of the total transport cost of a
supply chain.
As ships get bigger and more fuel-efficient (a 6,500 TEU vessel emits 31% less carbon
per TEU than a 2,600 TEU vessel), they contribute to the transition towards a lower
emissions future (NZSC, 2010).
5
Slow steaming is when ships are operated at slower speeds to reduce fuel and over capacity.
NZIER report – Bigger ships – what are the implications for New Zealand? 10In this sense emissions from shipping move in the same direction as vessel costs when
thinking about the shape of the curves in Figure 7. But emissions are only one part of
social costs and shipping is only one part of the supply chain.
Social costs affect both handling and vessel costs.
4.1.2. Who pays for the capital handling cost?
How the capital investment component of handling costs is funded is an important
problem associated with the question of bigger ships. If the investment cost is not
recovered by pricing the use of the infrastructure, then the handling cost per TEU
within the supply chain may not increase as ships get bigger.
The infrastructure is funded as subsidy. While ultimately New Zealand would benefit
from lower vessel costs, taxpayers or cross subsidies within the supply chain would
have funded the infrastructure to make this cost reduction possible.
To correctly apply the total transport cost framework, we must take a cost-benefit
analysis approach which intends to maximise welfare for New Zealanders (as
taxpayers) and not only shippers or ports (or international shipping lines).
Furthermore, there are competing interests between and within shipper, port and
taxpayer groups. Not all New Zealand’s regions will benefit equally (and some regional
economies may be hurt).
The economy-wide distribution of the impacts may lead some regions to benefit and
others to suffer. The export and import catchments closest to hub ports are likely to
benefit the most.
4.2. Determining the shape of the curves for
New Zealand is difficult
The shape of the curves Figure 6 are a function of complex drivers and vary by country
based on their size, geography/topography, type of goods exported and imported,
number of ports, the different shipping routes and many other factors.
For New Zealand, the big question is what does the “total costs for the transport chain”
curve look like, and where are we now in relation to its lowest point, i.e. the lowest
total transport cost per TEU, where the dotted line crosses the curve in Figure 6. In
theory, while there could be a ship size that is ideal for New Zealand’s trade, in practice
it is too complex to determine.
4.3. Defining the problem
What exactly is the problem that we are trying to solve regarding the visits of bigger
ships to New Zealand?
Defining the problem as the risk that New Zealand may not develop the capacity to
accommodate larger ships is not sufficient. That is only a symptom of the underlying
problem. The problem is not that the government must plan under uncertainty either
– that is just a feature of the challenge, rather than the underlying issue.
NZIER report – Bigger ships – what are the implications for New Zealand? 11The overarching question which needs to be answered is how to best ensure that New Zealand’s future freight system configuration accommodates larger ships in a way that minimises total transport costs. Hence, the problem definition for government is how to improve the quality of the regulatory environment and its provision of infrastructure in response to container ships increasing in size. NZIER report – Bigger ships – what are the implications for New Zealand? 12
5. How has New Zealand
   adjusted to bigger ships
   since 2010?
5.1.          New Zealand container trade volumes
              grew despite a slow global recovery
Despite the slow global recovery from the GFC, New Zealand’s total export and import
container volumes have both increased by about 200,000 TEU between 2012 and
2017.

Figure 7 Export and import volumes are growing at a relatively
similar rate
TEU; Rolling 12 months; Quarterly

Source: MOT, 2017

The final origin and destination of exports and imports (respectively) in New Zealand
are important to the bigger ships debate. Depending on which ports arise as hubs, it
may increase costs for some shippers and not for others. The geographical location of
the dairy industry relative to hub ports, for example, needs to be considered.
New Zealand’s trade is increasingly with Asia, and China particularly. This
concentration could provide potential opportunities for shipping lines to offer
additional routes and ship capacity. The following provide an overview of the evolution
of New Zealand’s containerised trade since 2012:
     •     About half of containerised export volume growth has come from dairy
           exports, despite low prices over 2014 and 2015. Dairy, vegetables, fruits

NZIER report – Bigger ships – what are the implications for New Zealand? 13
and foodstuffs (processed) account for the lion’s share of New Zealand
containerised exports (see Figure 26 in Appendix B)
• China is the major importer of New Zealand’s dairy exports, and its share of
total container export volumes is increasing. It now matches the total
Australian/Pacific volumes (see Figure 27).
• Containerised import growth is more balanced across commodities than for
our exports (see Figure 28).
• The geographical origin of import growth has also been more balanced,
with most of the increase coming from China, South East Asia and Europe
(see Figure 29).
5.2. New Zealand ports are investing to cater
for bigger ships
The ability of ports to handle larger vessels depends on several factors:
• Channel and berth pocket dimensions (depth, width, length)
• Size of quay cranes – larger cranes are required to reach wider beamed
vessels
• Number of quay cranes – larger vessels will mean higher exchanges of
containers per visit
• Number of container handlers required to support each quay crane
• Larger capacity container yards (MOT, 2014).
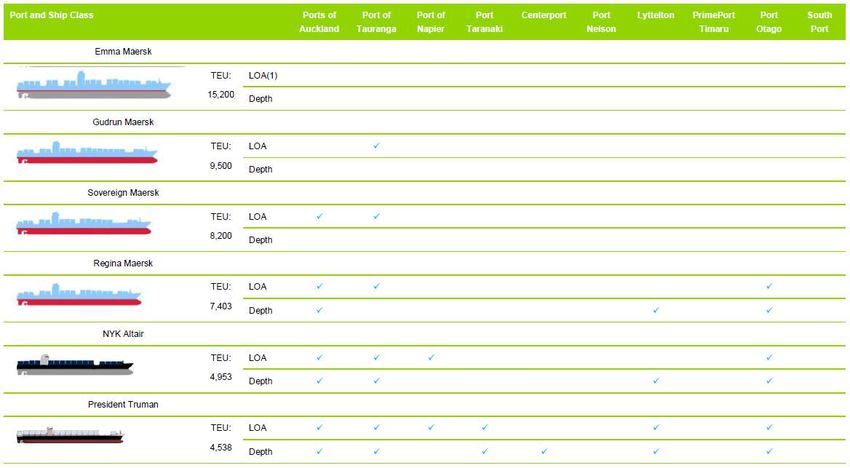
MOT (2014) summarised the current capacity of each port from the perspective of
length and depth in 2014 (see Figure 8).
Figure 9 should not be taken as a representation of current port capacity. Its purpose
is to summarise the capacity at different ports in 2014. We then subsequently discuss
in Table 1 investments that have taken place since 2014 as well as future investment
plans.
NZIER report – Bigger ships – what are the implications for New Zealand? 14Figure 8 New Zealand port capacity to cater for bigger ships as of 2014 – some ports have invested since then which are summarised in Table 1 LOA (Length over all) – total length of the vessel Source: MOT, 2014 NZIER report – Bigger ships – what are the implications for New Zealand? 15
Table 1 summarises port developments since 2014 as well as planned investments.

Table 1 Recent investment developments by New Zealand ports for
bigger ships
 Port          Recent capacity development
 Ports of      Ports of Auckland recently released its 30-year masterplan which includes berth
 Auckland      extensions and channel dredging (POAL, 2017). Details on cost and channel depth not
               yet available but Ports of Auckland has consent to deepen its ship berths up to 14.5m
               (POAL, 2017).
               Ports of Auckland has also invested in three new cranes which can load and unload up
               to 19 containers deep (Prentice, 2017). POAL’s long term investment includes
               automation of its terminal stacks which will increase its terminal capacity to around
               1.7 million TEU (Prentice, 2017).
 Port of       Port of Tauranga is investing nearly $350 million to handle larger ships including by
 Tauranga      dredging its channel (Knowler, 2016). The first stage of the dredging is estimated at a
               cost of $40 to $50 million (POT, 2015). Port of Tauranga’s channel is now 14.5m deep
               at low tide (POT, 2015). In late 2016, the Aotea Maersk with a capacity of more than
               9,500 TEU began to call at Port of Tauranga (Knowler, 2016).
 Napier Port   Port of Napier has plans for an up to $100m development including a new 350m
               wharf container terminal which would require some dredging around it. It is also
               seeking to dredge its channel from the existing consented depth of 12.8m to 14.5m
               (Port of Napier, n.d.) (Radio New Zealand, 2016).
               It is applying for a staged consent (six stages) to progressively meet demand for larger
               ships over time (Port of Napier, n.d.). Port of Napier also recently purchased cranes in
               2014 (at a cost of $34 million) that could accommodate bigger ships (Underhill, 2014).
 Centreport    CentrePort is seeking consent to dredge its channel to $14.5m so that it can handle
               6,000 TEU ships at a cost between $37 and $44 million. The deepening of the channel
               is likely to be staged (Maxwell, 2016).
 Port Nelson   Port Nelson is expecting fewer direct international visits and more feeder services but
               has retained international calls over time nonetheless. The cost of deepening the
               shipping channel at the time was considered prohibitive (estimated at $250 million)
               (Watson, 2010).
 Lyttelton     MOT commented that of all the major ports, Lyttelton Port is the most constrained to
 Port          take larger vessels (MOT, 2014).
               Following the Christchurch earthquake, the port developed a 30-year vision in which it
               will spend $1 billion on re-development. The plan includes extending the channel by
               6.5 kilometres, doubling its current length as well as making it 20m wider and up to
               6m deeper (New Zealand Coastal Society, 2016).
               The dredging cost is estimated to cost $80 million to $120 million, and will provide
               capacity for ships up to 8,000 TEU capable with 14.5m channel depth (New Zealand
               Coastal Society, 2016).
 Port Otago    Port Otago has completed the first stage of its dredging (increasing the depth of the
               channel to 14m); the second phase is to allow the port to handle ships of 8,000 TEU
               (by dredging to 15m) (Knowler, 2016). The total dredging cost is estimated at $30
               million (Mcneilly, 2015). Port Otago’s investment also includes larger cranes, wharf
               strengthening, new warehousing and new tugs (Hartley, 2016).

Source: Various (as cited in table)

These increases in capacity at potential hub ports for New Zealand are broadly in line
with the NZSC’s 2010 recommendations.

NZIER report – Bigger ships – what are the implications for New Zealand? 16
5.3. Port market structure changes spark
debate over hub-spoke future
5.3.1. Changes to port market structure
The most significant changes to New Zealand’s port structure over the last 5 years are
taking place at Port of Tauranga. POT’s container volume market share has been
growing since 2014, and it is the only port exhibiting strong growth in container volume
handled since 2014.
Other port market shares (in terms of containers handled) have remained relatively
stable with total container volumes handled stable or slightly growing or falling.
Figure 9 NZ port sector market structure
Total TEU loads and discharges by port; Share of NZ total; Quarterly
Source: MOT, 2017
Total container handling at ports can be broken down into imports and exports.
In both cases, POT is gaining market share. It now handles import volumes comparable
to that of POAL. The growth in export volumes has been even more concentrated
towards POT than imports.
Activity at the Port of Napier is also increasing, but some of its most recent gains can
be in part attributed to Centreport’s shutdown. Primeport, while only handling small
volumes, is also growing strongly. All other New Zealand ports, including POAL, have
seen only relatively minor changes to their total volume of containers handled. All of
POT’s recent growth over the last year was accommodated by bigger ships (8,000+ TEU
capable).
NZIER report – Bigger ships – what are the implications for New Zealand? 17Figure 10 Almost all of the increase in containers handled by bigger
ships over the last two years has taken place at POT
Port of Tauranga container load and discharges; Rolling 12-month; Export TEU by ship size
Source: MOT, 2017
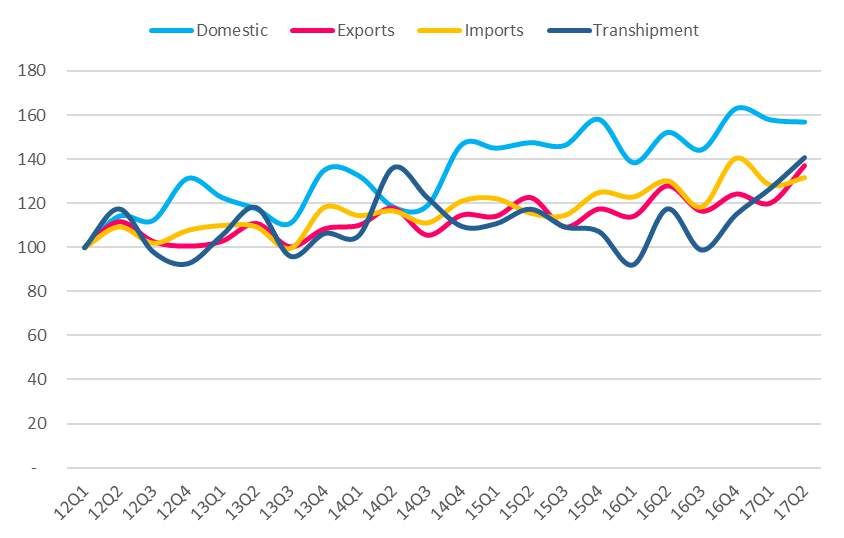
5.3.2. Transhipment volumes are on the rise
6
after fluctuating since 2012
Total container handling at ports includes imports and exports but also transhipment
and domestic shipping. Imports and exports are growing at relatively similar rates
while domestic shipping is rising strongly.7
Transhipment volumes have been rising fast since the end of 2016. Alongside the
various port investment plans across the country, this trend is sparking debate around
the future structure the port sector and the role of different hub ports, particularly
Port of Tauranga.
Since the end of 2016 export and import transhipment volumes have taken off after 5
years of fluctuations (transhipment volumes rose 40% in a year). Again, transhipment
volumes (import transhipment loading and export transhipment discharges) are only
growing at two hub ports, POAL but POT in particular (Figure 33 and Figure 34).
This trend is more visible for the share of exports transhipped across the entire port
sector. Since the end of 2016, the share of total exports transhipped has stabilised and
has been growing since the beginning of 2017.
6
The characterisation of cargo movements in FIGS (MOT, 2017) is designed to split shipping movements into international
and coastal. For an export container that is transhipped, the container is loaded at a New Zealand port, is shipped to a
second New Zealand port, discharged, and is then loaded for export without leaving the second port, and without the cargo
changing (FIGS, 2017).
7
Domestic coastal shipping has grown strongly but only between three ports, POAL and POT (where containers are loaded)
and Lyttelton Port (where the majority are destined). Domestic coastal shipping is only growing between hub ports.
NZIER report – Bigger ships – what are the implications for New Zealand? 18Figure 11 Trends in TEU loads and discharges in New Zealand TEU loads and discharges; Index 2012 = 100; Transhipment includes re-exports Source: MOT, 2017 Figure 12 Share of total exports transhipped has just started to rise Percentage of exports that are transhipments Source: MOT, 2017 NZIER report – Bigger ships – what are the implications for New Zealand? 19
5.3.3.              Exploring changes in transhipment
                    volumes across ports
Export transhipment8
New Zealand has two export ‘hub’ ports (where containerised transhipped exports are
discharged), POAL and POT, with POT handling about three times POAL’s export
transhipment volume since the beginning of 2017. While POAL’s volumes are not
growing strongly for import and exports, its role as a hub for transhipment is also
somewhat strengthening.
Port Otago, Primeport, Port of Napier and Port Nelson are increasingly sending exports
to be transhipped through either POAL or POT (much of that change has taken place
over the last year).

Import transhipment9
Import transhipment loadings are increasingly concentrated at two ports, POAL and
POT. POT’s import transhipment rose sharply over the last year, reaching volumes now
comparable to that of POAL.
Import transhipment discharges are also increasingly concentrated at Lyttelton Port
and Port Otago, the two hub port candidates for the South Island (imports to those
two ports are being transhipped through North Island ports).

5.3.4.              POT aside, road has traditionally
                    accounted for most of the increase in
                    container movements to and from ports
Between 2012 and 2015, most of the growth in container handling to and from ports
was via road transport, which is more competitive for destinations under 150km (rule
of thumb) trips.
Port of Tauranga is an exception to this trend with most of the growth in and out of
the port being moved by rail (from about a third to half of exports between 2012 and
2016) (MOT, 2017).
Because Port of Tauranga moves container by rail and most of the total container
volume handled in New Zealand has been at Port of Tauranga, since 2016 the total
container tonnage moved by rail is rising. The share of container tonnage to the total
rail tonnage has increased from 41% in 2015 to nearly half in 2017 (MOT, 2017).

   8
       Figure 31.
   9
       Figure 32.

NZIER report – Bigger ships – what are the implications for New Zealand? 20
You can also read