China Parcels Market Market Insight Report 2018 - Apex Insight
←
→
Page content transcription
If your browser does not render page correctly, please read the page content below
China Parcels Market
                Market Insight Report 2018

                Apex Insight Ltd

                2 Eastbourne Terrace,
                London
                W2 6LG

                +44 20 7100 7239
                www.apex-insight.com
                mail@apex-insight.com

February 2018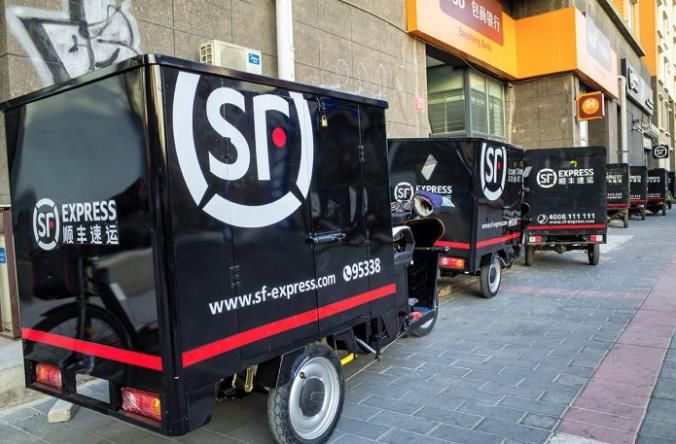
China Parcels Market: Market Insight Report 2018
innovated, deploying new technology and designing new processes
About this report
which, in many cases, are far more advanced than those seen in the west
The report includes:
o Description of the market and the key trends which are shaping it
Background to the report
o Historical and forecast market size and growth covering the period
from 2012-2022
China’s economy continues to perform strongly as the country has
o Analysis of drivers of market growth
urbanised and the new middle classes have embraced consumption.
o Competitive landscape comparing the performance of the main
In this context, online retail has grown rapidly, having quadrupled since
carriers present in the market and profiling them and other leading
2012 to the point where China now accounts for over half of the global
market participants such as marketplaces and parcel locker
total.
networks.
China’s parcels market has expanded rapidly to deliver this enormous
retail volume as well as growth in demand from the B2B segment. What are the sources on which the report is based?
o China accounted for almost half of the total global growth in the
parcels market in 2017.
Extensive desk research on the parcels market and its operators covering
o The chart illustrates how growth has been much faster than company accounts, websites, official statistics and a wide range of other
elsewhere sources
Parcels market growth by country: 2012-2016
Published information on key market drivers such as economic data and
estimates of online retail spending
Interviews with senior-level contacts in the market
Who is it useful for?
The report is intended for:
o Owners and operators of parcel networks both in China and in
other territories
o Customers of those networks, in particular, retailers who sell via
the internet
o Investors in these businesses
Source: Apex Insight market model
o Market regulators and policymakers
o Banks, analysts, consultants and other parties with interests in the
In meeting the delivery needs of the online retail segment, parcels carriers
sector
have not only added large increments of capacity, they have also
© 2018 Apex Insight Ltd www.apex-insight.com
Standard licence. Document reference: 1260-01. May be shared with 1-5 colleagues
Contact us if additional user or enterprise licences are required 2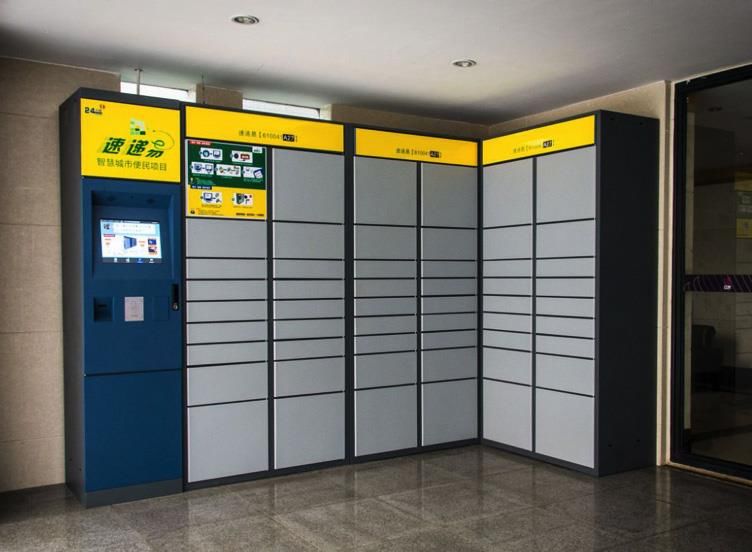
China Parcels Market: Market Insight Report 2018
Summary Competitive landscape
Market context and growth
The market is served by a combination of
o China Post,
The structure of the Chinese parcels market is different from that of most
western countries. This reflects factors including: o Privately owned domestic carriers, such as SF Express, YTO,
ZTO, STO and Yunda, regional and local carriers,
o Scale of the market – now the largest in the world by volume
o In-house delivery operations such as those of JD.com
o High population density in the urban areas of eastern China with
fast growth in tier 3 / 4 cities o Open delivery platforms such as NewDada
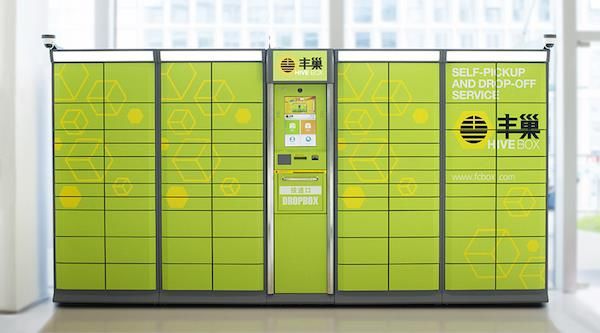
o Importance and rapid growth of online retail o Parcel shop and locker networks, including Hive Box, Sposter and
Best Express.
o Importance of marketplaces such as Taobao, Tmall and JD.com
o Sophisticated mobile payment infrastructure The integrators (UPS, FedEx and DHL) are also present but their overall
market shares are small.
Parcels volume reached 40.1bn in 2017, having grown at a CAGR of over
o They have struggled to be competitive on price with their domestic
50% since 2012.
competitors and mainly focus on international services and B2B
o During Singles Day (11 November) in 2017 more than 800m services between major cities
parcels were sent in one day.
o Nevertheless, the scale of the Chinese market means it must
Online retail spending has grown at an average of over 40% per year and remain a strategic priority for them.
exceeded US$1.1trn in 2017 – over twice the size of the next largest
Of the Chinese carriers, SF Express – which has an integrated model – is
market, the US.
the largest carrier by revenue while ZTO – which carries out line haul and
Marketplaces play a very important role in both online shopping and the hub sortation but outsources its local depots – is the largest by volume.
parcels market.
All of the main carriers have grown strongly in recent years, mainly
o Alibaba, which operates the Taobao and Tmall marketplaces is the through organic means given the rising market, but also as a result of
largest parcels customer, accounting for the majority of volumes some acquisitions.
for some carriers
High levels of investment have been required to cope with growing
o JD.com which operates its own delivery network, is also important demand. For example, SF is currently building what it claims will be the
While volumes have grown strongly, competition has forced prices down, world’s largest parcel hub, with its own airport, which it expects to handle
despite rising labour costs which are forcing Chinese carriers to automate c.2m tonnes of freight per year, at Wuhan. Several carriers have sought
and introduce new technology and processes. stock market listings to fund their expansion.
In our forecasts for the market to 2022 we expect to see further growth,
driven by the ongoing growth of the Chinese economy and, in particular,
online retail.
© 2018 Apex Insight Ltd www.apex-insight.com
Standard licence. Document reference: 1260-01. May be shared with 1-5 colleagues
Contact us if additional user or enterprise licences are required 3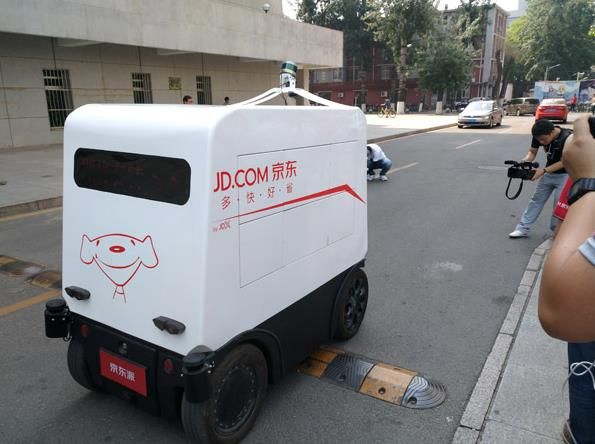
China Parcels Market: Market Insight Report 2018
Key trends
Labour costs are rising rapidly in all sectors in China. As a labour-
intensive industry, parcel delivery is exposed to this trend. Pressure for
improved pay and conditions, combined with a shortage of delivery
manpower means we expect this to continue
One response to rising labour costs is automation. Chinese carriers are
automating rapidly, introducing technologies such as sortation robots in
hubs and driverless delivery vehicles with locker compartments, which are
not yet common in western markets.
Retailers increasingly require their carriers to provide storage capability
and e-fulfilment services, to enable them to hold fast-moving stock close
to their customers in the many large cities across China. This supports
their ability to offer fast delivery. As a result, around 25% of the Chinese
market is currently intra-city, for which the default delivery service is often
same day
Parcel shops and lockers are much more widespread in China than in
most western markets and play an increasingly important role, both in
improving service levels and maximising labour productivity. Locker
utilisation rates are high and we believe that over 10% of parcels are
currently delivered via lockers or parcel shops, with the proportion rising.
© 2018 Apex Insight Ltd www.apex-insight.com
Standard licence. Document reference: 1260-01. May be shared with 1-5 colleagues
Contact us if additional user or enterprise licences are required 4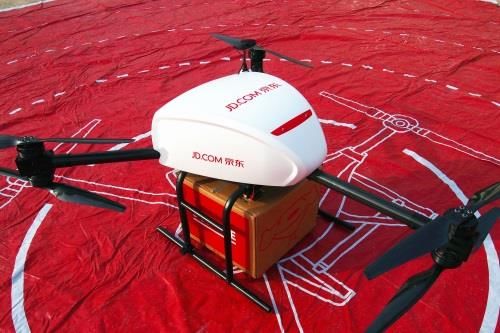
China Parcels Market: Market Insight Report 2018
About Apex Insight: 2018-19 Parcels & Logistics Research Programme Highlights
Report Description
UK Parcels: Carrier Profiles Detailed profiles of each of the main UK carriers including analysis of performance and benchmarking against peer
group
UK 2-Man Delivery: Market Insight Review of the UK 2-man delivery segment including B2C (furniture and bulky household items) and B2B (big
Report computers, ATMs, etc.). Market size, review of trends, profiles of main operators and forecasts.
Global Last Mile Logistics Market Study of developments designed to facilitate last mile delivery including new carrier systems, parcel locker and parcel
Insight Report shop networks and newer ideas such as drones and driverless vehicles.
European Parcels: Market Insight In-depth review of the parcels industry across Europe and in seven leading markets (France, Germany, Netherlands,
Report Italy, Poland, Spain and the UK). Market size estimates drawn from our market model built up from company revenues
and other data and includes forecasts to 2019
UK e-fulfilment: Market Insight e-fulfilment is one of the key growth segments in logistics as customer demand and international sales continue to
Report. drive growth and encourage – and reward – innovation on the part of service providers
Global Logistics Market Insight Analytical overview of the Global Logistics market which portrays the market structure, size, growth, trends and
Report competitive landscape.
UK Same Day Delivery (non-food): Review of the UK same day market including review of trends, profiles of main operators and forecasts.
Market Insight Report
Global Postal Operators – Benchmarking of the postal operators of the 20 largest global economies, analysis of relevant market trends and case
Benchmarking of performance, studies on the leading operators, reviewing their context, performance and strategy in detail.
strategy and diversification
UK Consumer & Small Business Review of the demand for services from consumers and small businesses sending moderate volumes of parcels and
(C2X) Parcels Services the increasing range of alternatives now available to this segment
Global Parcels: Market Insight Review of the global parcels market. Market size and growth by region. Analysis of the leading players including the
Report global integrators and the major post-office backed networks.
China Parcels: Market Insight Report Review of the China parcels market. Analysis of the market and leading players including the major locker networks.
UK Parcels: Market Insight Report Updated and extended version of our in-depth report on the UK parcels market. Includes market segmentation
estimates and forecasts
© 2018 Apex Insight Ltd www.apex-insight.com
Standard licence. Document reference: 1260-01. May be shared with 1-5 colleagues
Contact us if additional user or enterprise licences are required 5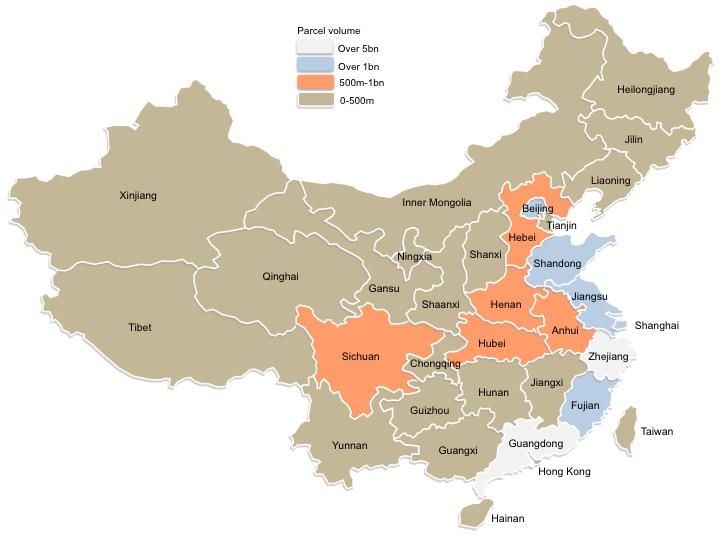
China Parcels Market: Market Insight Report 2018

About Apex Insight: recent parcels, transport and logistics consulting experience
Sector                     Client/s                                  Apex Insight role           Comment

Parcel Lockers             Government of Singapore                   Advise on locker network    Review of trends and best practices in last mile logistics, profiling of best practice
                                                                     roll-out in Singapore       operators, interviews with potential suppliers and market participants in Singapore,
                                                                                                 recommendation of a model for Singapore
Last mile                  YorBox                                    Advice on strategy and      Organisation formed to promote open networks for last mile delivery
delivery                                                             development of model
Parcels                    UK / international carrier                Cost benchmarking &         Profiling of competitors using published information and market interviews, building of a
                                                                     competitor comparison       model to benchmark costs by process stage
Parcels                    Citizens’ Advice Scotland                 Research                    Research on the range and costs of parcels services for B2C deliveries to remote areas
                                                                                                 and the extent to which gaps in delivery services impact internet retail take-up
Parcels                    European post office                      Price comparison            Comparison of prices charged for international and domestic delivery by retailers and
                                                                                                 carriers in six European countries
Mail / parcels             Target: P2P Mailing                       Buy side commercial due     Bolt-on acquisition of a high-growth company specialising in international B2C deliveries
                           Acquirer: The Delivery Group              diligence
                           / Next Wave Partners
Logistics                  Target: Dalepak                           Buy side commercial,        Logistics and e-fulfilment service provider with focus on beauty products, giftware and
                           Acquirer: Sovereign Capital               operational + IT due        other sectors.
                                                                     diligence
Logistics                  Target: Carousel Logistics                Buy side commercial +       Bespoke logistics solutions and e-fulfilment services to customers with demanding
                           Acquirer: Livingbridge                    operational due diligence   requirements in sectors including hi-tech, automotive and fashion.
Logistics                  UK e-fulfilment business                  Evaluation of customer      Interview programme with past, current and potential customers to help client understand
                                                                     needs                       how to re-focus its proposition as part of a divisional turnaround
Travel                     Target: Locomote                          Buy side commercial due     Locomote developed a sophisticated travel management platform for corporate customers
management                 Acquirer: Travelport                      diligence                   which Travelport has now added to its range of services
services
Travel                     Target: Drum Cussac                       Buy side commercial due     Drum Cussac provides travel risk management services including tracking of executives
management                 Acquirer: Root Capital                    diligence                   travelling overseas via a technology platform, emergency response management and
services                                                                                         security consulting

© 2018 Apex Insight Ltd www.apex-insight.com
Standard licence. Document reference: 1260-01. May be shared with 1-5 colleagues
Contact us if additional user or enterprise licences are required                                                                                                                            6
China Parcels Market: Market Insight Report 2018

About Apex Insight: example parcels / delivery research and consulting clients

© 2018 Apex Insight Ltd www.apex-insight.com
Standard licence. Document reference: 1260-01. May be shared with 1-5 colleagues
Contact us if additional user or enterprise licences are required                  7
China Parcels Market: Market Insight Report 2018

                                                                                                                                 Value ....................................................................................................................... 16
Contents                                                                                                                         Growth rate comparison: China vs. other markets ................................................. 16

About this report ..................................................................................................... 2        Volume .................................................................................................................... 17

Background to the report .......................................................................................... 2            Revenue per parcel ................................................................................................ 18

What are the sources on which the report is based? ............................................... 2                             Market segmentation .............................................................................................. 19

Who is it useful for? .................................................................................................. 2              B2B / C2X and online retail delivery (B2C / C2C) ............................................ 19
Summary .................................................................................................................. 3            Local or intra-city vs. national vs. international ............................................. 20
Market context and growth ........................................................................................ 3                    Market by region ............................................................................................ 22
Competitive landscape .............................................................................................. 3
                                                                                                                                        Market by province ........................................................................................ 24
Key trends ................................................................................................................. 4
                                                                                                                                 Market Drivers ........................................................................................................ 29
About Apex Insight: 2018-19 Parcels & Logistics Research Programme Highlights 5
                                                                                                                                 Population growth ................................................................................................... 29
About Apex Insight: recent parcels, transport and logistics consulting experience .. 6
                                                                                                                                 Economic growth .................................................................................................... 30
About Apex Insight: example parcels / delivery research and consulting clients ..... 7
                                                                                                                                 Online retail ............................................................................................................. 31
Contents................................................................................................................... 8
                                                                                                                                        Size and growth .............................................................................................. 31
List of charts and tables ....................................................................................... 11
                                                                                                                                        Emergence of new categories of items sold online........................................ 32
About the Market ..................................................................................................... 13
                                                                                                                                        Seasonal and promotional trends .................................................................. 32
Market Characteristics ............................................................................................ 13
                                                                                                                                 Key Market Trends ................................................................................................. 33
       Scale of the market – now the largest in the world by volume ...................... 13
                                                                                                                                 Increasing labour costs ........................................................................................... 33
       High population density in the urban areas of eastern China with fast growth
                                                                                                                                 Investment in network operations ........................................................................... 33
       in tier 3 / 4 cities ............................................................................................. 13
                                                                                                                                        New hubs ........................................................................................................ 33
       Importance and rapid growth of online retail ................................................ 13
                                                                                                                                        Vehicle optimisation: use of bigger trucks and smart routing software ........ 34
       Importance of marketplaces such as Taobao, Tmall and JD.com ................... 14
                                                                                                                                        Robots ............................................................................................................. 34
       Sophisticated mobile payment infrastructure ................................................ 14
                                                                                                                                        Drones and driverless vehicles ....................................................................... 35
Market Size, Segmentation and Growth ................................................................. 16
                                                                                                                                 Regulation ............................................................................................................... 36

© 2018 Apex Insight Ltd www.apex-insight.com
Standard licence. Document reference: 1260-01. May be shared with 1-5 colleagues
Contact us if additional user or enterprise licences are required                                                                                                                                                                                              8
China Parcels Market: Market Insight Report 2018
Storage and e-fulfilment services ........................................................................... 37 JD.com ............................................................................................................ 49
Growth of parcel shop and locker networks ............................................................ 38 Carriers - Integrators ............................................................................................... 50
Carrier consolidation ............................................................................................... 38 UPS.................................................................................................................. 50
Competitive Landscape .......................................................................................... 39
FedEx............................................................................................................... 51
Overview ................................................................................................................. 39
DHL ................................................................................................................. 51
Marketplaces .................................................................................................. 39
Carriers - National ................................................................................................... 51
Carriers............................................................................................................ 39
China Postal Express & Logistics Company Limited (EMS) ............................. 51
Open local delivery platforms ......................................................................... 40
SF Express ....................................................................................................... 52
Parcel shop and locker networks .................................................................... 40
ZTO Express .................................................................................................... 54
Carriers ................................................................................................................... 40
YTO Express .................................................................................................... 55
Share by category ........................................................................................... 40
STO Express..................................................................................................... 57
Competitive advantages ................................................................................. 41
Yunda Express ................................................................................................. 58
Competitive analysis – Chinese carriers ................................................................. 42
Best Inc (Best Express) .................................................................................... 59
Size .................................................................................................................. 42
GTO Express .................................................................................................... 61
Growth ............................................................................................................ 45
TTK Express ..................................................................................................... 61
Margins ........................................................................................................... 46
Quanfeng Express ........................................................................................... 61
Stock market listings ....................................................................................... 46
ZJS Express ...................................................................................................... 61
Competitive analysis – Integrators .......................................................................... 47
UC Express ...................................................................................................... 62
Competitive analysis – Parcel shops and locker networks ..................................... 47
Profiles of key market participants .......................................................................... 48 Sure Express.................................................................................................... 62
Marketplaces ........................................................................................................... 48 Carriers - Regional .................................................................................................. 62
Alibaba ............................................................................................................ 48 Local open delivery platforms ................................................................................. 63
Cainiao ............................................................................................................ 48 New Dada ....................................................................................................... 63
Ele.me ............................................................................................................. 63
© 2018 Apex Insight Ltd www.apex-insight.com
Standard licence. Document reference: 1260-01. May be shared with 1-5 colleagues
Contact us if additional user or enterprise licences are required 9China Parcels Market: Market Insight Report 2018
Meituan-Dianping ........................................................................................... 64
Linqu ............................................................................................................... 64
Shanshong ....................................................................................................... 64
SHBJ.com......................................................................................................... 64
Dianwoda ........................................................................................................ 65
Parcel shops and lockers ........................................................................................ 65
Hive Box .......................................................................................................... 65
Sposter ............................................................................................................ 67
CIMC................................................................................................................ 67
JD.com............................................................................................................. 68
Parcel shop networks...................................................................................... 68
Forecasts ................................................................................................................ 69
Population ............................................................................................................... 69
Economic growth .................................................................................................... 69
Online retail ............................................................................................................. 70
Parcels market forecasts ........................................................................................ 71
© 2018 Apex Insight Ltd www.apex-insight.com
Standard licence. Document reference: 1260-01. May be shared with 1-5 colleagues
Contact us if additional user or enterprise licences are required 10China Parcels Market: Market Insight Report 2018
List of charts and tables China GDP per capita, 1960-2016 (current US$) ................................................... 30
China total and online retail market value, 2012-2016 / US$bn ............................. 31
China Parcels Market Size, 2007-2017 (RMB bn) .................................................. 16 Total and online retail market value, 2012-2016 .................................................... 31
China Parcels Market Size, 2007-2017 (RMB bn) .................................................. 16 STO Express hub robots ........................................................................................ 34
China Parcels Market Size, 2007-2017 (US$ bn) ................................................... 16 JD.com robot courier .............................................................................................. 35
China parcels market value growth vs. other major economies, CAGR 2012-2016 JD.com delivery drone ............................................................................................ 35
................................................................................................................................ 17 SF Express delivery tricycle .................................................................................... 37
China Parcels Market Volume: 2007-2017 (m)....................................................... 17 China parcels market volume by type of company, (private, state-owned, foreign),
China Parcels Market Volume and Growth: 2007-2017 (m) ................................... 18 2011-2016 (chart) ................................................................................................... 41
Revenue per parcel: 2007-2017 / RMB .................................................................. 18 China parcels market volume by type of company, (private, state-owned, foreign),
2011-2016 ............................................................................................................... 41
China parcels market growth by segment: 2011-2016 / RMB bn ........................... 19
China parcels market value by type of company, (private, state-owned, foreign),
China parcels market volume by destination, 2007-2017, (chart) .......................... 20 2011-2016 ............................................................................................................... 41
China parcels market volume by destination, 2007-2017 ....................................... 20 Carriers by parcel revenue, 2016 (RMBm) ............................................................. 42
China parcels market value by destination, 2010-2017, RMBm (chart) ................. 21 Carriers by parcel revenue, 2016 (US$m) .............................................................. 43
China parcels market value by destination, 2010-2017, RMBm ............................. 21 Carriers by parcel volume, 2016 (m) ...................................................................... 43
Average revenue per parcel: Local vs national vs international: 2012 and 2017 / Revenue per parcel of leading carriers, 2016 (RMB) ............................................. 44
RMB / parcel ........................................................................................................... 21
Carrier parcel volume growth, 2014-16 (chart) ....................................................... 45
China parcels market volume by region, 2010-2017 (chart) ................................... 22
Carrier parcel volume growth, 2014-16 (table) ....................................................... 45
China parcels market volume by region, 2010-2017 .............................................. 22
Carrier parcel revenue growth, 2015-16 ................................................................. 45
China parcels market value by region, 2010-2017 ................................................. 22
Margins of leading carriers, 2015-16 ...................................................................... 46
Average revenue per parcel: Western vs. Central vs. Eastern: 2012 and 2017 /
RMB / parcel ........................................................................................................... 23 Recent public listings of major express parcels companies in China ..................... 46
China parcels market by region, value and volume, 2016 ...................................... 23 SF Holding financial performance, 2015-2016 ....................................................... 52
China parcels market by province, 2016 ................................................................ 26 SF Holding financial performance, 2015-2016 ....................................................... 52
China population, 1960-2016 .................................................................................. 29 SF Express parcel volume, 2014-2016 .................................................................. 53
China GDP and growth, 2012-2017 ........................................................................ 30 SF Express average revenue per parcel ................................................................ 53
© 2018 Apex Insight Ltd www.apex-insight.com
Standard licence. Document reference: 1260-01. May be shared with 1-5 colleagues
Contact us if additional user or enterprise licences are required 11China Parcels Market: Market Insight Report 2018 SF Express revenue by major business segment, 2015-2016 ............................... 53 Best Express revenue per parcel, 2014-2016 ........................................................ 61 SF Express revenue by sub-segment, 2015-2016 ................................................. 53 HiveBox locker in China .......................................................................................... 66 SF Express revenue by region, 2015-2016 ............................................................ 53 Sposter locker bank in China .................................................................................. 67 ZTO Express management ..................................................................................... 55 China population forecast, 2000-2022 .................................................................... 69 ZTO Express financial performance, 2014-2016 .................................................... 55 China GDP forecast and growth, 2012-2022.......................................................... 69 ZTO Express parcel volumes, 2014-2016 .............................................................. 55 GDP per capita, 2010-2022 (US$) ......................................................................... 70 YTO Express financial performance, 2014-2016 (RMB M) .................................... 56 China total and online retail market value, 2012-2021 (chart)................................ 70 YTO Express financial performance, 2014-2016 (US$m) ...................................... 56 China total and online retail market value, 2012-2021 ........................................... 71 YTO Express parcel volume / revenue per parcel, 2015-2016............................... 56 China parcels market value forecast, RMB bn, 2012-2022 (chart) ........................ 71 YTO Express revenue by segment, 2015-2016...................................................... 56 China parcels market forecast, value and volume, 2012-2022 .............................. 72 YTO Express revenue by sub-segment, 2016 ........................................................ 56 YTO Express revenue by region, 2016 ................................................................... 56 STO Express financial performance, 2014-2016 (RMBm) ..................................... 57 STO Express financial performance, 2014-2016 (US$m) ...................................... 57 STO Express parcel volume, 2014-2016 ................................................................ 58 Yunda Express financial performance, 2014-2016 (RMB m) ................................. 58 Yunda Express financial performance, 2014-2016 (US$m) ................................... 58 Yunda Express parcel volume and growth, 2014-2016 .......................................... 58 Yunda Express revenue by major business segment, 2015-2016 ......................... 58 Yunda Express sub-segment revenue, 2015-2016 ................................................ 59 Yunda Express revenue by region, 2015-2016 ...................................................... 59 Best Inc. revenue by business segment, 2014-2016 (RMB m) .............................. 60 Best Inc. revenue by business segment, 2014-2016 (US$m) ................................ 60 Best Express financials, 2014-2016 ....................................................................... 60 Best Express parcel volume and growth, 2012-2016 ............................................. 60 © 2018 Apex Insight Ltd www.apex-insight.com Standard licence. Document reference: 1260-01. May be shared with 1-5 colleagues Contact us if additional user or enterprise licences are required 12
China Parcels Market: Market Insight Report 2018
The vast majority of China’s population (1.3bn) lives in the East of
About the Market o
the country, mostly in major cities along the coast.
Population density in these cities is very high. This has implications for
Market Characteristics delivery:
o Delivery costs are low because the distances involved are much
The structure of the Chinese parcels market is different from that of most smaller than in western cities.
western countries. This reflects factors including: o Congestion can be a problem. For this reason, western-style
o Scale of the market – now the largest in the world by volume parcel vans are rarely used. Motorised tricycles, scooters and e-
bikes with trailers are more common
o High population density in the urban areas of eastern China with
fast growth in tier 3 / 4 cities (population up to 3m) Within the Eastern cities, the distribution of population has been changing.
o Importance and rapid growth of online retail o The top ten cities in China are Shanghai with a population of 22m,
o Importance of marketplaces such as Taobao, Tmall and JD.com Beijing (19m), Guangzhou (11m), Shenzhen (10m), Tianjin (11m),
Taipei (8m), Hong Kong (7m), Dongguan (8m), Hangzhou (7m)
o Sophisticated mobile payment infrastructure and Chengdu (7m).
o While these tier 1 (population >15m) and tier 2 (3-15m) cities have
Scale of the market – now the largest in the world by volume continued to grow, China now has more than 100 cities that have
a population of more than 1m.
Parcels volume in China in 2017 reached 40.1bn, larger than the US o As a result of this growth the urban middle class, the key
market in terms of volume. demographic segment for online retail and hence parcel delivery,
o Not only are the volumes significant, but the growth rates are is now more dispersed.
rapid: volumes have grown at a CAGR of over 50% between 2012 o In 2002, virtually all of this segment was concentrated in a few
and 2016. cities, which meant that retailers only needed to store stocks in a
During Singles Day (11 November) in 2017 more than 800m parcels were handful of places to reach their entire market.
sent in one day. o Now the split of urban middle class is approximately 50:50
Guangdong is the largest provincial parcels region in China, worth between tier 1/2 cities and tier 3/4 cities – hence it is necessary for
RMB88,028m in 2016, or US$13,204m, a similar size to the UK parcels retailers to have product in many more locations to support
market. efficient delivery operations.
High population density in the urban areas of eastern China with fast growth in tier Importance and rapid growth of online retail
3 / 4 cities
According to Alibaba, 467m Chinese Internet users engaged in online
According to the United Nations, China’s population in 2017 was 1,411bn. shopping in 2016, out of a total of 731m Internet users.
Approximately one fifth of the world’s population lives within its borders. Statistics from eMarketer show Chinese online retail spending has grown
at an average of over 40% per year and reached US$851bn in 2016,
© 2018 Apex Insight Ltd www.apex-insight.com
Standard licence. Document reference: 1260-01. May be shared with 1-5 colleagues
Contact us if additional user or enterprise licences are required 13China Parcels Market: Market Insight Report 2018
more than twice the size of the US online retail market at US$391bn in the Sophisticated mobile payment infrastructure
same year.
Shopping via mobile is much more common in China than in Europe or China’s mobile payments market was worth around US$5.5tn in 2016,
the US. In China, mCommerce sales were US$621.8bn in 2016, much some 50 times larger than the US market. China leads the global market
larger than US$113.8bn achieved in the US and almost three quarters of for mobile payment, driven by online shopping growth and the relative
total online retail. lack of alternatives like credit cards.
Growth in online retail is expected to continue to reach US$2,660bn in There are a number of mobile and e-commerce payment methods in
2021, with forecast CAGR of 25.6%. In this year, it will be more than three China, including:
times the size of the US online retail market. o Alipay
o Tenpay (Weixin Pay)
Importance of marketplaces such as Taobao, Tmall and JD.com o 99Bill
o Union Pay
Online marketplaces occupy an important market position in China o LianLian Pay
accounting for the overwhelming majority of all sales. The main operators
are Alibaba and JD.com. o Yeepay
o Baidu Wallet
Alibaba operates:
o Union Mobile Financial
o Taobao, its C2C marketplace
o 1qianbao
o Tmall, its B2C marketplace for Chines and international brands
and retailers. The market is dominated by two companies with around 90% market
o Alipay, the payment processing platform for Taobao and Tmall. share; Alipay and Tenpay. The two companies operate mobile wallets
Alipay and WeChat Pay, respectively.
It also has stakes in a number of Chinese and foreign logistics
businesses, including YTO Express, Best Express and Singapore Post. Alipay was launched in 2004 as a payment service to facilitate payments
on Taobao. Alipay had a 54% share at the end of 2016, down from 71% in
Finally it has a controlling interest in Cainaio Smart Logistics Network, the 2015. TenPay’s share grew to 37% in 2016, up from 16% in 2015.
platform that links order data to delivery providers’ systems allowing
o Ant Financial is the Alibaba affiliate that runs Alipay. In April 2017,
delivery firms to access a large national network of warehouse space.
Ant Financial merged with HelloPay Group, which provides the
JD.com acts as both a retailer and a marketplace. It operates its own payment solution for Lazada. Ant Financial also has stakes in
delivery network and does not rely on third-parties. Paytm, an Indian payments company, and Mynt, a financial
Another important player is WeChat, the social network site. services start-up in the Philippines.
o It accounts for 35% of mobile time, or 66 minutes per user per day Tenpay is operated by Tencent, known for its social media platform
and 1bn users per month. It owns the payment platform, WeChat WeChat, with 890m users. Alipay was the default digital wallet in China,
Pay, which has 280m transactions per month. but as Chinese consumers spend an increasing amount of time in the
o Retailers are able to list on WeChat’s commerce platform, WeChat ecosystem, they keep funds in their WeChat Pay wallet for peer-
WeCommerce. to-peer payments and in-app purchases. Hence it has emerged as a
serious competitor to Alipay.
© 2018 Apex Insight Ltd www.apex-insight.com
Standard licence. Document reference: 1260-01. May be shared with 1-5 colleagues
Contact us if additional user or enterprise licences are required 14China Parcels Market: Market Insight Report 2018
UnionPay is China’s state run card network with a near monopoly over the
country’s payment card system. It is seeking to enter the mobile payments
market through offering a QR payment system. UnionPay could be an
important mobile payments competitor – as it currently has 5.4bn cards
issued. More than 38bn transactions were made on UnionPay cards in
2016.
In August 2017, The People’s Bank of China demanded that Alipay,
TenPay and other online payment solutions send payments through a
newly established clearing house by June 2018. The motive for this may
be to restrict money laundering, but it has also been seen by some
observers as a move to restrict the payments duopoly of Alipay and
Tenpay.
The wide acceptance of mobile payment apps, for offline as well as online
purchases, means that 84% of Chinese people report that they would be
happy to leave home without their wallet, relying on smartphone
payments for any transactions.
For the parcels industry, the widespread use of payment apps has
facilitated the development of lockers, which use apps for their operation
and for any payments.
© 2018 Apex Insight Ltd www.apex-insight.com
Standard licence. Document reference: 1260-01. May be shared with 1-5 colleagues
Contact us if additional user or enterprise licences are required 15China Parcels Market: Market Insight Report 2018
Market Size, Segmentation and Growth China Parcels Market Size, 2007-2017 (RMB bn)
RMB (bn) Market Value Growth %
Value 2007 34,258.5
2008 40,842.7 19.2%
2009 47,900.3 17.3%
The Chinese parcels market reached RMB495.7bn in 2017, an increase
2010 57,460.3 20.0%
of 24.7% on the 2016 market value. In dollar terms, it was worth
2011 75,798.8 31.9%
US$74.4bn in 2017.
2012 105,533.2 39.2%
It is approximately half the size of the United States parcels market (in 2013 144,200.0 36.6%
value terms), but growing at about ten times the rate. 2014 204,540.0 41.8%
o Per capita parcel volume in China (31) is still much lower than that 2015 276,960.0 35.4%
of US (50). 2016 397,440.0 43.5%
According to the State Post Bureau of China, marketplace sales via 2017 495,710.0 24.7%
Source: State Post Bureau of China
Alibaba accounted for 48% of all parcels volumes in 2016.
Market value has growth at a CAGR of 30.6% between 2007 and 2017.
China Parcels Market Size, 2007-2017 (US$ bn)
China Parcels Market Size, 2007-2017 (RMB bn)
(US$bn) Market Value Growth %
2007 5,138.8
2008 6,126.4 19.2%
2009 7,185.0 17.3%
2010 8,619.0 20.0%
2011 11,369.8 31.9%
2012 15,830.0 39.2%
2013 21,630.0 36.6%
2014 30,681.0 41.8%
2015 41,544.0 35.4%
2016 59,616.0 43.5%
2017 74,356.5 24.7%
Source: State Post Bureau of China
Growth rate comparison: China vs. other markets
Source: State Post Bureau of China
© 2018 Apex Insight Ltd www.apex-insight.com
Standard licence. Document reference: 1260-01. May be shared with 1-5 colleagues
Contact us if additional user or enterprise licences are required 16China Parcels Market: Market Insight Report 2018
Growth rates, both in value and volume terms, do not show signs of
slowing. CAGRs for market value and volume between 2012 and 2016 Volume
were 39.3% and 53.2% respectively.
As the chart shows, the Chinese market is growing significantly faster Parcel delivery volume, at 40.06bn, is up by 28.1% on the previous year.
than other leading markets: over ten times faster than the US.
Growth, while still strong, has slowed from 51.3% in 2016.
China accounted for over half of total global market growth in 2017.
Market volume has grown at a CAGR of 42.0% between 2007 and 2017.
China parcels market value growth vs. other major economies, CAGR 2012-
2016
China Parcels Market Volume: 2007-2017 (m)
Source: State Post Bureau of China
Source: Apex Insight
© 2018 Apex Insight Ltd www.apex-insight.com
Standard licence. Document reference: 1260-01. May be shared with 1-5 colleagues
Contact us if additional user or enterprise licences are required 17China Parcels Market: Market Insight Report 2018
China Parcels Market Volume and Growth: 2007-2017 (m) o A competitive market which has ensured that the gains from
(m) Market Volume Growth % increased productivity have been shared with customers
2007 1,202
2008 1,513 25.9%
2009 1,858 22.8% Revenue per parcel: 2007-2017 / RMB
2010 2,339 25.9%
2011 3,673 57.0%
2012 5,685 54.8%
2013 9,186 61.6%
2014 13,960 52.0%
2015 20,670 48.1%
2016 31,280 51.3%
2017 40,060 28.1%
Source: State Post Bureau of China
Revenue per parcel
The average price per parcel has decreased from RMB28.5 in 2007 to
RMB12.4 in 2017.
o This equates to a decrease from US$4.28 to US$1.86.
o The price has changed at a CAGR of -8.0%.
This fall in average price has occurred despite the increases in labour
costs. It has resulted from a series of factors including the following: Source: China State Post Bureau
o Significant change in mix towards lower-priced B2C parcels
o Change in mix towards intra-city (the lowest-priced segment) and
away from international parcels (the highest-priced segment)
o Shift in market share away from China Post towards its private
sector competitors
o Major increases in volumes which have improved the economics
of parcel operations significantly by increasing delivery density
o Automation and application of new technology throughout the
parcels service process which have led to major improvements in
labour productivity
© 2018 Apex Insight Ltd www.apex-insight.com
Standard licence. Document reference: 1260-01. May be shared with 1-5 colleagues
Contact us if additional user or enterprise licences are required 18China Parcels Market: Market Insight Report 2018
Market segmentation China parcels market growth by segment: 2011-2016 / RMB bn
The market can be segmented in the following ways:
o Online retail delivery vs other parcels
o Local or intra-city vs. national vs. international
o By geographical area: region / province
B2B / C2X and online retail delivery (B2C / C2C)
The Chinese market segments between:
o Online retail deliveries (B2C and C2C)
o Other parcels, sent by consumers and businesses (B2B and C2X).
Online retail parcel senders are considered to be more price-sensitive.
They may have very large volumes.
o Alibaba alone accounts for an estimated 48% of the overall market
Commercial and personal senders are less price-sensitive and are more Source: Statistics Bureau of China, company reports. Note: splits unavailable for 2017.
likely to use premium service levels.
Growth is most rapid in the online retail segment, which we believe
accounts for over 70% of total market value, up from 57% in 2011 .
© 2018 Apex Insight Ltd www.apex-insight.com
Standard licence. Document reference: 1260-01. May be shared with 1-5 colleagues
Contact us if additional user or enterprise licences are required 19China Parcels Market: Market Insight Report 2018
Local or intra-city vs. national vs. international
China parcels market volume by destination, 2007-2017
The market splits between these types as follows: Vol mn Local (City) National HK & Inter. Total
2007 333 772 97 1,202
o 23% delivered locally or intra-city; 2008 402 1,005 106 1,513
o 75% national 2009 437 1,308 113 1,858
o 2% international (including Hong Kong and Macau) 2010 536 1,673 130 2,339
2011 818 2,727 128 3,673
Carriers often have same day delivery options for intra-city deliveries. It is
2012 1,314 4,189 182 5,685
sometimes the default service
2013 2,287 6,637 262 9,187
o JD.com, which operates its own delivery infrastructure, offers 2014 3,550 10,090 330 13,960
same-day delivery for certain items if ordered prior to 11am. 2015 5,400 14,840 430 20,670
2016 7,410 23,250 620 31,280
2017 9,270 29,960 830 40,060
China parcels market volume by destination, 2007-2017, (chart) Source: China State Post Bureau
There are two forms of intra-city parcel delivery, fixed and un-fixed routes.
To allow them to offer rapid delivery times, retailers typically store stocks
of items locally in each major city.
o Carriers frequently offer storage and e-fulfilment services which
may involve using the Cainaio network of distributed logistics
facilities.
o Fixed routes are predominantly for the delivery of parcels within a
city from a warehouse to individual customers. There is no need
for sorting hubs and line-haul operations, nor parcel pick-up.
o Non-fixed routes applies to ad-hoc deliveries of takeaway food,
flowers, pharmaceuticals. Crowd-sourced delivery platforms
dominate this delivery segment, including NewDada, Meituan and
Ele.me.
For national deliveries the process is more typical of that seen elsewhere:
items are collected and sent to a local hub then line-hauled to the
Source: China State Post Bureau destination sorting hub, and moved out into the last-mile delivery network
to the customer.
Whilst international parcels account for small proportion of volume (2%),
they account for 11% of value.
© 2018 Apex Insight Ltd www.apex-insight.com
Standard licence. Document reference: 1260-01. May be shared with 1-5 colleagues
Contact us if additional user or enterprise licences are required 20China Parcels Market: Market Insight Report 2018
China parcels market value by destination, 2010-2017, RMBm (chart) Local (city) average revenue per parcel has remained fairly static.
National average revenue per parcel has nearly halved. International (and
Hong Kong) average revenue per parcel has also declined significantly.
Local parcels have grown the quickest with International the slowest.
o The resultant change in mix has contributed to the fall in the
overall average revenue per parcel.
Average revenue per parcel: Local vs national vs international: 2012 and
2017 / RMB / parcel
Source: China State Post Bureau
China parcels market value by destination, 2010-2017, RMBm
RMB m Local (City) National HK & Inter. Total
2010 4,150 31,450 17,880 57,460
2011 6,590 44,590 18,470 75,799
2012 11,020 63,550 20,560 105,533
2013 16,640 82,900 27,070 144,168
2014 26,590 113,060 31,590 204,540
2015 40,080 151,290 36,960 276,960
2016 56,310 209,930 42,900 397,440 Source: China State Post Bureau
2017 73,365 251,325 53,041 495,710
Source: China State Post Bureau
© 2018 Apex Insight Ltd www.apex-insight.com
Standard licence. Document reference: 1260-01. May be shared with 1-5 colleagues
Contact us if additional user or enterprise licences are required 21China Parcels Market: Market Insight Report 2018
Market by region China parcels market volume by region, 2010-2017
Vol (m) Eastern Central Western Total
The Eastern region is the most populated and most economically 2010 1,850 270 210 2,330
developed and accounts for the overwhelming majority of parcels: 81% by 2011 2,940 410 330 3,680
both value and volume 2012 4,660 600 430 5,690
2013 7,470 990 730 9,190
o Four provinces of Shandong, Jiangsu, Henan and Anhui have a
2014 11,450 1,480 1,030 13,960
combined population of more than 320m people.
2015 16,960 2,310 1,400 20,670
o The Eastern region includes Shanghai, Shenzhen and Beijing – 2016 25,320 3,710 2,250 31,280
major population centres. 2017 32,489 4,647 2,924 40,060
As the charts show, growth has been at similar levels across the regions. CAGR 2010-17 50.6% 50.2% 45.7% 50.1%
Source: China State Post Bureau
China parcels market volume by region, 2010-2017 (chart)
China parcels market value by region, 2010-2017
RMB m Eastern Central Western Total
2010 46,580 5,680 5,200 57,460
2011 61,430 7,530 6,840 75,800
2012 86,810 9,870 8,860 105,540
2013 119,200 13,280 10,970 143,450
2014 169,430 19,160 15,950 204,540
2015 227,090 28,390 21,480 276,960
2016 322,410 42,540 32,490 397,440
2017 401,029 53,537 41,144 495,710
CAGR 2010-17 36.0% 37.8% 34.4% 36.0%
Source: China State Post Bureau
Source: China State Post Bureau
© 2018 Apex Insight Ltd www.apex-insight.com
Standard licence. Document reference: 1260-01. May be shared with 1-5 colleagues
Contact us if additional user or enterprise licences are required 22China Parcels Market: Market Insight Report 2018
Average revenue per parcel has fallen across all three regions – by a China parcels market by region, value and volume, 2016
negative CAGR of 7-8%.
Average revenue per parcel: Western vs. Central vs. Eastern: 2012 and 2017
/ RMB / parcel
Source: China State Post Bureau Source: China State Post Bureau
© 2018 Apex Insight Ltd www.apex-insight.com
Standard licence. Document reference: 1260-01. May be shared with 1-5 colleagues
Contact us if additional user or enterprise licences are required 23China Parcels Market: Market Insight Report 2018
Market by province
There are 31 provinces in China.
o Guangdong is the largest province in terms of both parcels market
volume and value. It had parcel volumes of 7,672m in 2016, worth
RMB88,028m (US$13,204m).
o Guangdong and Zhejiang account for 43.7% of parcels market
volume and 35.8% of market value.
o The top five provinces (including Jiangsu, Shanghai and Beijing)
account for 67.3% of volume and 68.6% of revenue:
The top cities in terms of express parcel volume are:
o Guangzhou
o Shanghai
o Shenzhen
o Hangzhou
o Beijing
o Jinhua
o Dongguan
o Suzhou
o Chengdu
o Wenzhou
The provinces are discussed individually in the following chart and table.
© 2018 Apex Insight Ltd www.apex-insight.com
Standard licence. Document reference: 1260-01. May be shared with 1-5 colleagues
Contact us if additional user or enterprise licences are required 24You can also read