Information Memorandum in connection with the Acquisition Financing - March 2018 - GVC Holdings
←
→
Page content transcription
If your browser does not render page correctly, please read the page content below
Information
        Memorandum
in connection with the
 Acquisition Financing

               March 2018
Table of contents

List of figures                                                                                          4

1.      Disclaimer                                                                                       6

2.      Transaction overview                                                                             8
2.1.    Introduction                                                                                     8
2.2.    Sources and uses                                                                                 9
2.3.    Pro forma capitalisation                                                                         9
2.4.    Illustrative transaction timeline                                                               10
2.5.    Key terms of the acquisition financing                                                          11
2.6.    Pro forma organisational structure                                                              12
2.7.    Strategic rationale for the Acquisition                                                         13

3.      Key credit highlights                                                                           14
3.1.    Largest multi-channel gaming operator globally with leading positions in key markets            14
3.2.    Over 90% of revenue from regulated and / or taxed markets                                       17
3.3.    Strong and complementary brand portfolio with cross-sell growth opportunity                     19
3.4.    Enhanced scale underpinned by best-in-class technology                                          20
3.5.    Acquisition to generate material run-rate synergies                                             22
3.6.    Highly profitable business with robust cash generation                                          24
3.7.    Experienced management team with a track record of successful acquisitions                      25

4.      Industry overview                                                                               27
4.1.    Regulatory landscape                                                                            27
4.2.    Recent trends in online gaming                                                                  28
4.3.    Recent trends in retail gaming                                                                  34
4.4.    Competitive landscape                                                                           38
4.5.    Industry business model                                                                         40

5.      Triennial Review and Contingent Value Right                                                     41
5.1.    Triennial Review                                                                                41
5.2.    Contingent Value Right                                                                          43

6.      GVC company overview                                                                            47
6.1.    Summary                                                                                         47
6.2.    Company history and recent developments                                                         50
6.3.    Business overview                                                                               51
6.4.    Technology                                                                                      53

                                                                                               Page 2 of 75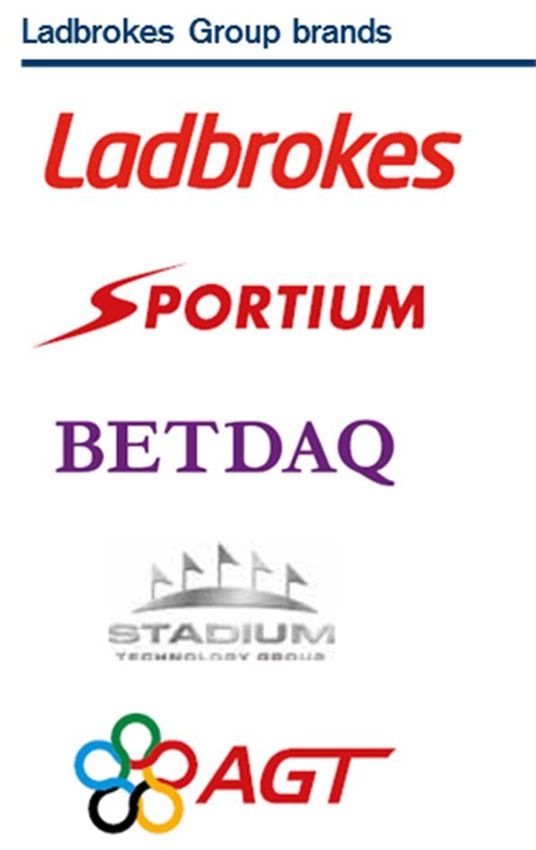
7.     Ladbrokes Coral Group company overview            55
7.1.   Summary                                           55
7.2.   Company history                                   57
7.3.   Business overview                                 58
7.4.   Divisional overview                               60

8.     Historical financials                             62
8.1.   Basis of preparation                              62
8.2.   Historical financial information                  62
8.3.   Current trading                                   72

9.     Appendix                                          74
9.1.   Glossary of key terms and definitions             74

                                                Page 3 of 75
List of figures

Figure 1: Indicative sources and uses (LTM Jun-2017 as adjusted)                                  9
Figure 2: Pro forma capitalisation (LTM Jun-2017 as adjusted)                                     9
Figure 3: The largest online-led operator in the world by €bn revenue                            14
Figure 4: Top 10 global gaming markets by €bn gross win (ex-Asia)                                14
Figure 5: Top 10 global online gaming markets by €bn gross win (ex-Asia)                         15
Figure 6: Top 10 European land-based gaming markets by gross win €bn                             15
Figure 7: Combined Group’s multi-channel exposure                                                16
Figure 8: Combined Group’s regulated and/or taxed revenue exposure                               17
Figure 9: Impact of introduction of gaming regulation on online gross win (€m)                   18
Figure 10: Key geographies for leading GVC and Ladbrokes Coral brands                            19
Figure 11: GVC technology platform key highlights                                                20
Figure 12: GVC technology platform improvements since acquisition from bwin.party                21
Figure 13: Synergy phasing for the Combined Group                                                22
Figure 14: UK average internet speed                                                             28
Figure 15: Unique mobile phone subscribers – Europe 2013–2020E                                   29
Figure 16: Global M-Payments transactions volume, 2013–2019E                                     29
Figure 17: Internet users in Western Europe                                                      30
Figure 18: Projected growth in betting and gaming market by channels in Europe                   30
Figure 19: Projected growth in global online betting and gaming market by geography              31
Figure 20: Projected growth in global online betting and gaming market by product                31
Figure 21: Projected growth in UK online betting and gaming market by product                    33
Figure 22: Projected growth in German online betting and gaming market by product                33
Figure 23: Projected growth in Italian online betting and gaming market by product               34
Figure 24: Betting shops in UK                                                                   34
Figure 25: Historical and projected growth of UK retail gaming market by product                 35
Figure 26: Historical and projected growth of Irish retail gaming market by product              36
Figure 27: Historical and projected growth of Belgian retail gaming market by product            36
Figure 28: Historical and projected growth of Spanish retail gaming market by product            37
Figure 29: Historical and projected growth of Italian retail gaming market by product            37
Figure 30: Estimated global market share of online gaming and betting players in 2016            38
Figure 31: Estimated UK market share of online gaming and betting players in 2017                38
Figure 32: Estimated market share of UK retail gaming and betting players in 2017                39
Figure 33: Illustrative business model in the gaming industry                                    40
Figure 34: FOBT category overview                                                                41
Figure 35: The Triennial Measures                                                                43
Figure 36: CVR Base Value at various maximum stake levels                                        44
Figure 37: Last five year GVC share price                                                        47
Figure 38: Geographies in which GVC holds a licence                                              48

                                                                                        Page 4 of 75
Figure 39: H1 2017 revenue breakdown by geography                                                 49
Figure 40: GVC’s proprietary technology platform processes 95% of the group’s revenues            54
Figure 41: Key strategic benefits of owning proprietary platform                                  54
Figure 42: Geographies in which LCL holds a licence                                               56
Figure 43: H1 2017 revenue breakdown                                                              59
Figure 44: Unadjusted financials for the Combined Group                                           62
Figure 45: LTM Jun-17 pro forma EBITDA bridge                                                     63
Figure 46: Summary GVC financials                                                                 63
Figure 47: Historical financial performance of GVC by segment                                     65
Figure 48: GVC Cash flow summary                                                                  66
Figure 49: Summary Ladbrokes Coral financials                                                     67
Figure 50: Historical financial performance of Ladbrokes Coral by segment                         69
Figure 51: Ladbrokes Coral cash flow summary                                                      71

                                                                                         Page 5 of 75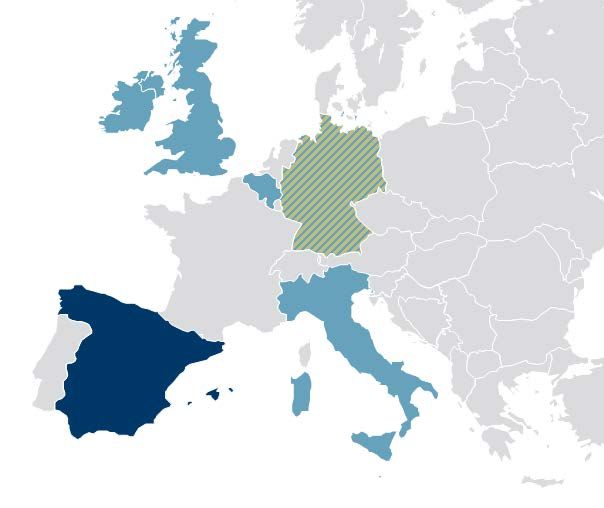
1.        Disclaimer
This memorandum, any related materials which are distributed alongside this memorandum, each of their
respective contents, and any oral presentation made by or on behalf of GVC Holdings PLC (the "Company") in
relation to the subject matter hereof (all such documents and information together being the "Relevant
Information") is strictly private and confidential and may not be reproduced, redistributed or passed on, directly or
indirectly to any other person or published in whole or in part by any medium or in any form without the prior
written consent of the Company.

The sole purpose of the Relevant Information is to provide background information to assist you in obtaining a
general understanding of the business of the Company, the business of Ladbrokes Coral Group plc ("Ladbrokes
Coral") and the proposed acquisition by the Company of Ladbrokes Coral.

The Relevant Information does not constitute, or form part or, any listing particulars, prospectus or circular relating
to the Company and/or Ladbrokes Coral, nor does it constitute an offer to sell, or a solicitation of an offer to buy or
subscribe for securities of the Company and/or Ladbrokes Coral in any jurisdiction. It is not intended to provide the
basis of any investment decision, financing or other evaluation and is not to be considered as a recommendation by
the Company, any financial adviser, broker, financing party or other person acting on behalf of the Company or
their respective affiliates, agents or advisers (together the "Identified Persons") that any recipients of the Relevant
Information purchases or subscribes for any securities in the Company and/or Ladbrokes Coral. Furthermore, the
Relevant Information has not been approved by the UK Financial Services Authority or an authorised person (as
defined in the Financial Services and Markets Act 2000) or any other supervisory authority.

The directors of the Company have taken all reasonable care to ensure that the facts stated herein are true to the
best of their knowledge and belief. However, no representation or warranty, express of implied is given by or on
behalf of the Company, any of the Identified Persons or any other person as to the accuracy of completeness of the
information of opinions given in any Relevant Information and no liability is accepted for any such information or
opinions. In particular, certain industry and market information in the Relevant Information may have been
obtained by the Company from third party sources. Without prejudice to the foregoing, neither the Company nor
the Identified Persons, to the fullest extent permitted by law accept any liability whatsoever for any loss howsoever
arising, directly or indirectly, whether arising in tort, contract or otherwise, from the use of the Relevant
Information or otherwise in connection herewith.

The Identified Persons are under no obligation to update or keep current the information contained in the Relevant
Information, to correct any inaccuracies which may become apparent or to publicly announce any revision to the
statements made herein except to the extent that they would be required to do so under applicable law or
regulation, and any opinions expressed in the Relevant Information are subject to change without notice.

This memorandum contains statements about GVC, Ladbrokes Coral and the combined group if the proposed offer
completed (the "Enlarged Group") that are or may be forward looking statements. All statements other than
statements of historical facts included in this memorandum may be forward looking statements. Without limitation,
any statements preceded or followed by or that include the words "targets", "should", "continue", "plans",
"believes", "expects", "aims", "intends", "will", "may", "anticipates", "estimates", "projects" or words or terms of
similar substance or the negative thereof, are forward looking statements. Forward looking statements include
statements relating to the following: (i) future capital expenditures, expenses, revenues, earnings, synergies,
economic performance, indebtedness, financial condition, dividend policy, losses and future prospects; (ii) business
and management strategies and the expansion and growth of Ladbrokes Coral's, GVC's or the Enlarged Group's
operations and potential synergies resulting from the proposed offer; and (iii) the effects of government regulation
on Ladbrokes Coral's, GVC's or the Enlarged Group's business.

The distribution, possession or use of the Relevant Information in certain jurisdictions may be restricted by
applicable law. No action has been taken to qualify the Relevant Information under the laws of any jurisdiction.

                                                                                                             Page 6 of 75
Recipients of the Relevant Information are required to inform themselves of any applicable laws which restrict the
possession, distribution or use of the Relevant Information and to observe such laws and the Company does not
accept any responsibility for any violation of any such laws by any person.

                                                                                                          Page 7 of 75
2. Transaction overview
2.1. Introduction
On 22 December 2017, GVC and Ladbrokes Coral announced terms of a recommended offer by GVC to acquire
Ladbrokes Coral in a cash and shares deal which valued Ladbrokes Coral’s fully diluted share capital at
approximately £4.0 billion or EV/EBITDA multiple of c.13.2x based on LTM Jun-17 EBITDA.
Up to £827 million of consideration is in the form of a CVR, payable dependent on the outcome of the Triennial
Review
Implied Equity Value of the Combined Group is c. €4.5 billion(1)
GVC is a multinational sports betting and gaming group operating leading consumer-facing brands in the online
gaming industry. Ladbrokes Coral is a leading European and international betting and gaming group, providing its
customers with a broad choice of products across a strong multi-channel platform.
The Combined Group will be a fast-growing, diversified, international online and retail sports betting led gaming
group with more than 90% of Net Gaming Revenue generated from locally regulated/taxed markets. Unaudited pro
forma combined revenue of €3.8 billion(2) for FY 2016. The Combined Group will benefit from a combination of GVC
and Ladbrokes Coral management expertise with the executive senior leadership drawn from both companies.
With a portfolio of strong brands, proprietary technology, and the opportunity to apply the best practices from
each business, GVC believes that the Combined Group will be well-placed to deliver a great experience to millions
of consumers in a highly-regulated gaming environment.
The Acquisition is expected to generate significant synergies driven by efficiencies across technology and data,
corporate, administrative and marketing verticals, in addition to revenue synergies from the cross-selling of
products between the two customer bases, leveraging brands across the two businesses and differentiating the
Combined Group’s offerings more effectively in competitive markets.
Following Completion, Ladbrokes Coral shareholders will own approximately 46.5% and GVC shareholders will own
approximately 53.5% of the Combined Group on a fully diluted basis. They will participate together in the synergy
benefits and future growth potential of the Combined Group.
The cash consideration payable to Ladbrokes Coral shareholders, the refinancing of certain existing indebtedness(3)
of Ladbrokes Coral, and certain costs and expenses will be funded by:
£1,400 million equivalent Term Loan B denominated in GBP, EUR and USD(4)
£550 million equivalent multicurrency Revolving Credit Facility (undrawn at close)
Based on LTM Jun-17 PF combined adjusted EBITDA of £798 million(5), PF total net leverage is expected to be 2.5x
at close (excluding CVR impact) with long-term strategy to maintain leverage below 2.0x.
Following all reasonably expected outcomes of the Triennial Review and giving effect to the CVR, net leverage is
expected to be inside 3.0x by the end of the first full year post Completion
(1) Based on GVC and Ladbrokes Coral share prices as at 6 December 2017 and adjusted for cash consideration of £632 million and the maximum CVR
payment of £827 million. This excludes benefit of acquisition synergies.
(2) Average exchange rate for 2016 of £1:€1.22.
(3) There is currently a change of control solicitation outstanding in respect of the Ladbrokes Coral notes.
(4) There is an additional bond backstop TLB of £400m should the consent solicitation in respect of the 2023 Notes not be passed.
(5) LTM Jun-17 PF combined adjusted EBITDA calculation is shown in Figure 45.
Page 8 of 75
2.2.         Sources and uses
 Figure 1: Indicative sources and uses (LTM Jun-2017 as adjusted)

Sources                                                          £m               Uses                                                              £m
New TLB                                                          1,400            Estimated cash component of the Offer                               632
Existing GVC TLB (€300m)                                           264            Existing GVC TLB (€300m)                                            264
RCF (£550m)                                                            –          Refinancing Ladbrokes Coral gross debt                              627
Ladbrokes Coral finance leases                                         3          Ladbrokes Coral finance leases                                         3
            (1)
GVC cash                                                           134            Cash left on balance sheet                                          180
                           (2)                                                                                     (3)
Ladbrokes Coral cash                                                 15           Transaction costs and fees                                          110
Total sources                                                   1,815             Total uses                                                       1,815
Existing Ladbrokes Coral notes                                     500            Existing Ladbrokes Coral notes                                      500
Total sources                                                   2,315             Total uses                                                       2,315

2.3.         Pro forma capitalisation
 Figure 2: Pro forma capitalisation (LTM Jun-2017 as adjusted)

                                                                                                                              PF LTM Jun-17

PF capital structure (before CVR impact)                                                                                 £m                 x EBITDA
GVC LTM Jun-17 Clean EBITDA (PF for Turkey disposal)(4)                                                                   176
Ladbrokes Coral LTM Jun-17 EBITDA                                                                                         382
PF combined EBITDA (excluding synergies)                                                                                  558
Ladbrokes Coral synergies (remaining)                                                                                     140
Combined Group synergies                                                                                                  100
PF combined EBITDA                                                                                                        798

RCF (£550m)                                                                                                                  –
Existing GVC TLB (€300m)                                                                                                   264
New TLB                                                                                                                  1,400
Ladbrokes Coral existing notes                                                                                             500
Ladbrokes Coral finance leases                                                                                               3
PF total gross debt                                                                                                      2,167                     2.7x
Cash                                                                                                                       (180)
PF total net debt                                                                                                        1,987                     2.5x

Source:   GVC annual report FY 2016, Ladbrokes Coral annual report FY 2016, 2.7 Announcement, GVC combined Prospectus and Class 1 circular dated 9 February
          2018.
Note:     Assuming 1.14 GBP/EUR FX rate as of 8 February 2018.
(1)       Adjusted for €50m TLB upsize and €48.2m interim dividend paid in October 2017. Excludes €112m customer liabilities and includes €46m cash in transit
          and €5m short term investments.
(2)       Adjusted for £38.3m interim dividend paid in November 2017 and excludes £83m customer liabilities.
(3)       Excludes value added tax.
(4)       Excludes €35m estimated EBITDA from Turkey facing business which was disposed per GVC announcement in November 2017.

                                                                                                                                                  Page 9 of 75
2.4.     Illustrative transaction timeline

                            March
          M     T    W       T      F    S    S
                             1      2    3    4
          5     6       7    8      9    10   11
          12   13   14       15     16   17   18
          19   20   21       22     23   24   25
         26    27   28       29     30   31

Scheme

Court meeting                            8 March
Ladbrokes Coral general meeting          8 March
Scheme Effective Date                    28 March

                                                    Page 10 of 75
2.5. Key terms of the acquisition financing
£550m £1,400m
Multicurrency RCF Acquisition TLB(1)
Borrower GVC Holdings PLC GVC Holdings PLC (EUR / GBP)
GVC Finance LLC (USD)
Amount / Currency £550m (multicurrency) €[900]m
£[325]m
$[400]m
Maturity 5 years 6 years
Pricing / Floor E/L + [•]bps GBP: L + [•]bps / Floor [•]
USD: L + [•]bps / Floor [•]
EUR: E + [•]bps / Floor [•]
OID [•] [•]
Call Protection None 101 soft call for 6 months
Use of Proceeds General corporate and working capital purposes To finance the cash consideration payable to
(including refinancing the £100m 2022 Ladbrokes Ladbrokes Coral Shareholders, refinance existing
Coral bonds and / or CVR)(2) indebtedness of the Ladbrokes Coral Group and
pay certain costs and expenses
Financial Springing leverage covenant if >35% drawn Cov-lite
Covenant Flat test @ 4.00x Leverage
Security Share pledges over certain Material Subsidiaries (≥10% EBITDA) consistent with the existing GVC
facility agreement
Guarantees Material Subsidiaries and guarantor coverage test (≥75% of EBITDA), subject to customary agreed
security principles
Covenants Customary information and general covenants consistent with the existing GVC facility agreement
Governing Law English law (share pledges governed by appropriate local law)
(1) In addition, a £400m TLB Bond Backstop is available to fund repayment of any of the £400m 2023 Ladbrokes Coral bonds in the event any bondholders
exercise their CoC put right. The backstop will be cancelled should the consent solicitation dated 23 February 2018 be passed.
(2) Up to £100m to be cancelled if not required for purposes of either funding the retail bond put or the CVR (prior to 12 months post Completion).
Page 11 of 752.6. Pro forma organisational structure
Current GVC Structure Pro-forma (Proposed) Structure
€70m Senior Secured €300m Senior Secured Term
Facility (Existing) Loan (Existing)
GVC Holdings
PLC
€300m Senior Secured €550m Senior Secured Facility
GVC Holdings PLC
Term Loan (Existing) (New)
Guarantee
£[1,400]m B Loan (Acquisition
Certain GVC GVC Finance LLC Financing)
Subsidiaries
Holding company
Share
Pledge
Certain GVC
Current Ladbrokes Structure(1) Subsidiaries
Ladbrokes
Coral Group Guarantee Guarantee
plc
Ladbrokes Coral Group Share Pledge
£100m Unsecured plc
Notes due 2022 Guarantee
Ladbrokes Ladbrokes (Existing)
Coral Group £100m Unsecured Notes due
Subsidiaries Finance plc £400m Unsecured 2022 (Existing)
Ladbrokes Coral Ladbrokes Group
Notes due 2023
Subsidiaries Finance plc
(Existing) £400m Unsecured Notes due
2023 (Existing)
The TLB, RCF and existing Ladbrokes Coral notes will benefit from a share and guarantee package on a pari
passu basis(2)
(1) Ladbrokes Coral existing debt to be refinanced as part of the Transaction.
(2) Assuming CoC consent solicitation is successful.
Page 12 of 752.7. Strategic rationale for the Acquisition
The Board of GVC believes that the Acquisition has a compelling strategic and financial rationale:
Revenue and profit The Combined Group will have the opportunity to maximise revenue and profit growth by
growth harnessing the best elements of each of their respective client relationship management tools
and skills that have been developed in both businesses to acquire and retain customers as well as
driving higher player yield
Ladbrokes Coral's significant retail presence and multi-channel know-how can assist GVC in
driving further online growth in both GVC and Ladbrokes Coral brands
Significant breadth and The Combined Group will, based on current wagers and revenues of GVC and Ladbrokes Coral,
scale be one of the largest listed sportsbook operators in the world by wagers and the largest listed
online-led betting and gaming operator by revenue
It will have top three market positions in three of Europe’s largest online gaming markets – the
UK, Germany and Italy - plus a significant business in Australia and exposure to the USA and
other growth markets, giving it the size and resources to address the dynamics of the rapidly
changing global gaming industry
Multichannel With expertise and scale across all distribution channels (online, retail and mobile) and ownership
distribution combined of its market-leading technology, the Combined Group will have the ability to increase further its
with market-leading customer base and continue to build leading positions in existing and new markets
technology
Leading brands The Combined Group will have some of the strongest retail and online industry brands, including
Ladbrokes, Coral, Gala, bwin, Party Poker and Sportingbet. It will be able to respond to evolving
consumer product preferences based on data collected from its extensive existing customer
base, and will be well-placed to capitalise on the opportunity for further customer wins
Deep pool of industry Both GVC and Ladbrokes Coral have a strong track record in selecting talented people from
talent businesses that have been combined with (as demonstrated in GVC's acquisitions of bwin.party
and Sportingbet and in the Ladbrokes Coral merger) to exploit the full potential of both
businesses
The Acquisition will allow the Combined Group to bring together some of the industry’s leading
talent across all key aspects of the gaming business, including product verticals, distribution
platforms, technology and marketing
Industry consolidation The Combined Group will continue to be well-positioned as one of the principal consolidators in
the gaming sector, with a proven management team experienced in integrating acquired
businesses
Taking the initiative The Acquisition allows GVC and Ladbrokes Coral shareholders to benefit from the business
now combination in the near term, with a flexible consideration structure which takes into account a
range of outcomes under the Triennial Review and at a time when financing conditions are
favourable
Opportunities for cost At least £100m of cost and revenue synergies have been identified which support the significant
and revenue synergies shareholder value creation opportunity of the Acquisition (see section 3.5. for further detail)
Page 13 of 753. Key credit highlights
3.1. Largest multi-channel gaming operator globally with leading positions
in key markets
3.1.1. Presence across key global markets
The Combined Group will, based on current wagers and revenues of GVC and Ladbrokes Coral, be one of the
largest listed sportsbook operators in the world by wagers and the largest listed online-led betting and gaming
operator by revenue.
Figure 3: The largest online-led operator in the world by €bn revenue
3.6
2.6
1.9
1.8
0.9 0.9
0.6 0.5 0.4 0.3
(1)
Source: Latest annual report revenue figures.
Note: Peer revenue based on last reported financial year. Exchange rates used as of 31 December 2017. Excludes Asian markets.
(1) Includes €895m of GVC FY 2016 NGR and £2,351m of Ladbrokes FY 2016 Revenue.
The combination brings together one of the world’s most geographically diverse online gaming operators with one
of the most established and trusted retail-led brands in the industry. Management believe that the Combined
Group will be truly global with best-in-class capabilities across all core channels (retail, online and mobile) and a
presence in most of the world’s key markets.
Figure 4: Top 10 global gaming markets by €bn gross win (ex-Asia)
35
105
30
25
20
20 17 16
14
15
11 10
10
9
5
3 2
0
US Italy Australia UK Germany Canada France Spain Netherlands Sweden
GVC presence Ladbrokes Coral presence
Source: H2 Gambling Capital.
Page 14 of 753.1.2. Global leadership in online
GVC operates entirely online and has positions in many of the world’s most significant online gaming markets. GVC
has a global business, operating out of 18 offices across four continents. GVC’s broad global offering will be
complemented by the strong brand positioning of Ladbrokes Coral’s digital businesses in established European
markets such as the UK, Italy, Ireland and Belgium.
Following Completion, the Combined Group will have top three market positions in three of Europe’s largest online
gaming markets – the UK, Germany and Italy - plus a significant business in Australia and exposure to the USA and
other growth markets.
Figure 5: Top 10 global online gaming markets by €bn gross win (ex-Asia)
7.0
6.1
6.0
5.0
4.0
2.7
3.0
2.2 2.0
2.0 1.4 1.2 1.0 0.9 0.9 0.7
1.0
–
UK US Australia Germany France Italy Canada Ireland Sweden Finland
GVC presence Ladbrokes Coral presence
Source: H2 Gambling Capital.
3.1.3. European leadership in retail
The Combined Group’s unrivalled worldwide online presence will be complemented by Ladbrokes Coral’s top 3
retail market share positions in many of the Europe’s most established retail gaming markets, including the UK,
Italy, Spain, Belgium and Ireland.
Figure 6: Top 10 European land-based gaming markets by gross win €bn
2.5 2.3
2.0 1.8
1.5
1.1
1.0
0.5 0.4
0.5 0.3 0.3 0.2 0.1 0.1
0.0
France UK Italy Ireland Greece Spain Sweden Belgium Croatia Poland
Ladbrokes Coral Top 3 retail
Source: H2 Gambling Capital.
Note: Land-based betting excludes casinos.
Page 15 of 753.1.4. Multi-channel offering
The Acquisition will therefore combine leading online and retail-led businesses to create the largest online-led
multi-channel business in the world. The Combined Group will have an attractive blend of high margin, high cash
conversion online offerings balanced with established and well-recognised retail brands.
Figure 7: Combined Group’s multi-channel exposure
GVC Ladbrokes Coral Combined Group
2% 1%
28%
2016 2016
46%
Revenu Revenue
52%
70%
100%
Online Retail Online Retail Other Online Retail Other
Source: GVC 2016 annual report. Ladbrokes Coral 2016 annual report.
The Combined Group intends to leverage this geographic diversity and continue to develop and enhance its multi-
channel offering following completion.
The Combined Group will have customers in 35 countries and will consolidate its position within many of those
markets. Its enhanced scale will also allow it to better adapt to the dynamics of a rapidly evolving global industry.
Combining the groups will also allow the businesses to better leverage their brands, across various channels, in
markets where there is currently low, or no, penetration but significant growth potential.
Page 16 of 753.2. Over 90% of revenue from regulated and / or taxed markets
The Combined Group will generate a significant majority of its revenues in jurisdictions that are regulated
and/or taxed.
GVC is currently licensed in 16 jurisdictions and, adjusting for the disposal of its Turkish business in 2017, generated
approximately 75% of H1 2017 revenue in markets that are regulated and/or taxed. Ladbrokes Coral is currently
licensed in 12 jurisdictions and its geographic exposure is almost entirely into regulated markets, with 99.8% of
2016 revenues being derived from such markets.
Figure 8: Combined Group’s regulated and/or taxed revenue exposure
GVC(1) Ladbrokes Coral Combined Group
0.2% 6%
25%
75%
99.8% 94%
Regulated/taxed Unregulated Regulated/taxed Unregulated Regulated/taxed Unregulated
Source: GVC RNS 2 November 2017. Ladbrokes Coral 2016 annual report.
(1) Pro forma for sale of Turkish business.
The Combined Group will therefore generate over 90% of its revenues in markets that are regulated and/or taxed.
The most significant geographic markets of the Combined Group will be the UK, Germany, Italy, Ireland and Greece,
all of which are regulated and/or taxed.
The Directors believe that regulation of gaming is positive for operators, despite typically resulting in taxation, for a
number of reasons:
Certainty: The regulation of gaming within a jurisdiction provides certainty for operators. For operators in
unregulated markets there is a risk that gaming will either be prohibited entirely, or regulated in a way that
severely impacts their operations and/or profitability;
Marketing: Historically, regulation has resulted in the opening up of domestic markets and has set out clear
parameters for the advertising of gaming products; and
Barriers to entry: Taxation can be beneficial, particularly for the larger incumbents, as it creates a barrier to entry
and often results in the closure of smaller operators, thereby reducing competition.
Page 17 of 75Figure 9: Impact of introduction of gaming regulation on online gross win (€m)
UK Belgium France
6,000 € Gambling 400 € Belgian French
Act 2014 Gaming Gambling
Act 2011 1,200 € Act 2010
350 €
5,000 €
Gambling 300 € 1,000 €
Act 2005
4,000 €
250 € 800 €
3,000 € 200 €
600 €
150 €
2,000 € 400 €
100 €
1,000 € 200 €
50 €
0€ 0€ 0€
2003
2005
2007
2009
2011
2013
2015
2003
2005
2007
2009
2011
2013
2015
2003
2005
2007
2009
2011
2013
2015
Source: Company information.
Page 18 of 753.3. Strong and complementary brand portfolio with cross-sell
growth opportunity
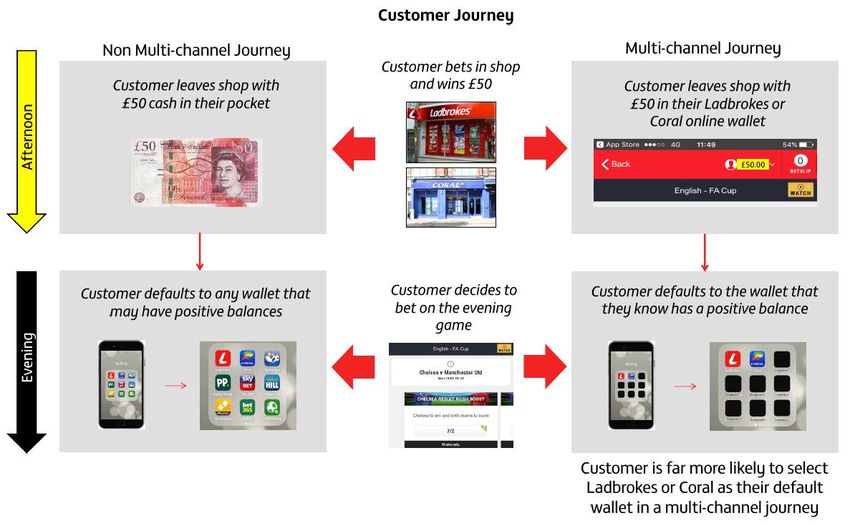
The Combined Group’s portfolio of market-leading and complementary brands (including Ladbrokes, Coral and
Gala, as well as international brands such as Sportingbet, bwin and partypoker) provides an opportunity to
reinforce revenue and profit growth by harnessing the best practices, tools and skills developed by the respective
businesses.
Management expects that the combination of GVC and Ladbrokes Coral’s brand portfolios will generate an
improved ability to cross-sell within and across the Combined Group's brands. In addition to driving the top line, the
blending of portfolios is expected to result in material cost efficiencies through improved customer acquisition and
retention. For example, Ladbrokes Coral's significant retail presence, multi-channel expertise and CRM tools will
assist GVC to improve marketing and customer management to drive further growth. Similarly, GVC’s proven
expertise in delivering improved operational performance of online brands can be applied to Ladbrokes Coral’s
existing online businesses.
Management believes that the combination of GVC and Ladbrokes Coral’s brand portfolios will result in limited
geographic overlap, as demonstrated in Figure 10 below.
Figure 10: Key geographies for leading GVC and Ladbrokes Coral brands
Retail Online – Sports Online – Games
UK
Italy
Ireland
Belgium
Spain
Germany
Eastern Europe
Greece
Brazil
Australia
Canada
GVC key market
Ladbrokes Coral key market
GVC and Ladbrokes Coral
Source: Company information.
The Acquisition therefore brings together two strong brand portfolios with complementary strengths across
geographies, verticals and channels. The enhanced brand portfolio will also provide optionality to the Combined
Group when pursuing further organic international expansion. As it expands into new international markets,
including those that may regulate sports-betting in the future (such as the US), the scale and diversity of the
Page 19 of 75Combined Group's portfolio of brands, including Ladbrokes Coral's retail presence, will ensure it is better able to
deliver on those opportunities.
3.4. Enhanced scale underpinned by best-in-class technology
The integration of the Combined Group’s product offering onto GVC’s market-leading technology platform will
enable it to proactively adapt and quickly differentiate itself in a competitive industry.
The GVC platform is fully integrated, highly scalable and able to adapt quickly to new product developments. GVC
management has a proven track record of successfully integrating the products of acquired businesses onto its
platform and helping to accelerate growth. The scalability of the platform allows for significant further growth at
little additional cost, whilst also removing reliance on external providers for operating the Ladbrokes Coral brands.
Figure 11: GVC technology platform key highlights
POWERFUL
Proprietary market–unique Complete
Highly platform PRODUCT
AVAILABLE
SET
Massively Omni
SCALABLE CHANNEL
Easily Capable Multi Fully
EXTENDABLE 1000+ IT STAFF BRAND & B2B REGULATED
Source: GVC Capital Markets Day, 25 May 2017.
The GVC team has worked to continually improve the platform since it was acquired through the bwin.party
transaction in 2016. Availability has been steadily improved from 99.69% in 2015 to 99.95% in 2017, disaster
recovery is now 14x faster than in 2014 and the average response time of the platform infrastructure has been
improved by 50% on average. Most pertinently for the Acquisition, the speed with which new providers, brands and
partners can be integrated onto the platform has been significantly increased.
Page 20 of 75Figure 12: GVC technology platform improvements since acquisition from bwin.party
Previously Now
To integrate a new
Game 20 to 24 2 to 3
Weeks Weeks
Provider
To setup a new
Label 8 to 9 1 to 2
Weeks Weeks
(Business)
To adapt to a new 16 to 20 2 to 4
Regulation Weeks Weeks
To on-board a new 32 to 40 8 to 12
B2B Partner Weeks Weeks
Source: GVC Capital Markets Day, May 2017.
Adopting GVC’s proprietary platform across a multi-product, multi-brand offering will eliminate duplication of
technology costs and create operational efficiency, whilst also improving the cash generation and defensive
positioning of the Combined Group. The GVC Directors believe that the use of a proprietary platform (and the
associated reduction in fixed external costs) across the Combined Group will reduce operating leverage and
therefore help to shield it from any adverse movements in end-markets.
When combined with scale, an efficient proprietary technology platform may also allow the Combined Group to
offer an improved customer experience by creating new products and brands across online, retail and mobile on the
same platform and enhance the opportunities for cross-selling between brands and verticals.
Page 21 of 753.5. Acquisition to generate material run-rate synergies
GVC expects to generate recurring annual pre-tax cost synergies of at least £100 million by 2021 through the
Acquisition. The phasing of expected cost synergies is set out below.
Figure 13: Synergy phasing for the Combined Group
120 £100m
100
80
£56m
60
40 £33m
20 £7m £44m
£26m £23m
0
Year 1 Year 2 Year 3 FY 2021
Annual recurring cost savings Cumulative
Source: Company estimates.
Both GVC and Ladbrokes Coral management have a track record of successful integration between businesses and
exceeding original synergies targets, most notably GVC’s acquisition of bwin.party and Ladbrokes’ acquisition of
Gala Coral. The cost synergy programme is expected to continue beyond 2021.
The expected savings are well spread across Technology (44%), Corporate & Administration (30%), Marketing (14%)
and Other (12%) and so are not dependent on the delivery of a single, or small number of, synergy initiatives.
In addition, the Acquisition is expected to provide opportunity for revenue synergies through cross-selling and the
sharing of best practices, systems and marketing strategies. The Acquisition is also expected to yield capital
expenditure synergies. Any revenue or capital expenditure synergies arising out of the Acquisition have not been
quantified at this stage.
Non-recurring restructuring costs of at least £100m are expected to be incurred in delivering the identified cost
synergies in the four years post Completion.
Page 22 of 753.5.1. Proven acquisition track record
Target
Date 19 March 2013 1 February 2016 1 November 2016
Deal size €83.9m(1) £1.1bn £1.2bn
Expected vs. Delivered EBITDA of €38.3m in year 1 On track to deliver run rate synergy (£ in millions)
150
realised vs. expected €28.7m target of €125m by the end of 2017
synergies Removed €50m of cost and returned to (on 2015 EBITDA of only €109m)
profitability in3.6. Highly profitable business with robust cash generation
The combination results in a company with €3.8bn in revenues and a strong EBITDA margin of c.18% for the twelve
months ended June 2017. The Combined Group’s highly scalable technology and low capex requirements result in
strong cash flows and an EBITDA cash conversion ratio of c.76%.
The Combined Group will have the opportunity to maximise revenue and profit growth by harnessing the best
elements of each of their respective businesses to acquire and retain customers and drive higher player yield.
Combined Revenue (unadjusted) Combined EBITDA(1)
(€ in millions) (€ in millions)
CAGR FY 2016 to 17.9% 18.4%
LTM Jun-17
CAGR FY 2016 to
3,754 3,811 LTM Jun-17
+3.1% 672 702
210
34
+9.3%
2,881 2,687 466 433
873 914 206 235
FY 2016 LTM Jun-17 FY 2016 LTM Jun-17
Combined CAPEX(2) Combined EBITDA – CAPEX
(€ in millions) (€ in millions)
4.8% 4.4% 73.3% 76.1%
CAGR FY 2016 to
LTM Jun-17
CAGR FY 2016 to
LTM Jun-17
493 +17.6% 534
24
179 -11.9% 168
323 309
10
143 124
170 201
36 34
FY 2016 LTM Jun-17 FY 2016 LTM Jun-17
GVC Ladbrokes Coral % of revenue % of EBITDA Constant currency impact
Source: GVC 2016 report, 2017 interim report. Ladbrokes Coral 2016 report, 2017 interim report.
Note: Average exchange rate for 2016 of £1:€1.22. LTM Jun-2017 exchange rate of £1:€1.14.
(1) EBITDA calculated as GVC Clean EBITDA plus Ladbrokes Coral EBITDA. It is not adjusted for synergies, exclusion of Turkey or any adjustments from the
acquisition.
(2) Capex includes capitalised software development and other intangibles and property, plant and equipment purchases.
Page 24 of 753.7. Experienced management team with a track record of
successful acquisitions
Both businesses have a track record of selecting, nurturing and retaining some of the most talented individuals in
the industry. This is best demonstrated by recent acquisitions, such as GVC's acquisition of bwin.party and
Ladbrokes’ acquisition of Gala Coral, in which the best talent from each organisation was retained to drive the
business forward.
The acquisition of Ladbrokes Coral will further deepen and broaden the talent pool at GVC, presenting the
Combined Group with one of the most experienced management teams in the industry. It is expected that
collaboration between the GVC and Ladbrokes Coral teams, across channels, will open up new market and product
opportunities.
The Combined Group will be led by Chief Executive Officer Kenneth Alexander, who has delivered total shareholder
return of over 3400% since taking the helm at GVC in 2007. Mr. Alexander will continue to work closely with Lee
Feldman who will become non-executive Chairman of the Combined Group. Mr. Feldman joined GVC in 2004 and
was instrumental in the appointment of Mr. Alexander in 2007 and has extensive experience in building successful
businesses. They will be supported by Paul Bowtell who will take on the role of Chief Financial Officer of the
Combined Group. Mr. Bowtell was previously Chief Financial Officer of Gala Coral Group and has successfully
coordinated the integration of that business with Ladbrokes Group.
Name and role Year joined Experience
Lee Feldman 2004
Non-executive (GVC)
Chairman
Kenneth Alexander 2007
Chief Executive (GVC)
Officer
Paul Bowtell 2011
Chief Financial Officer (Gala Coral)
Andy Hornby 2011
Joint Chief Operating (Gala Coral)
Officer
Shay Segev 2016
Joint Chief Operating (GVC)
Officer
Lindsay Beardsell 2017
General Counsel (Ladbrokes Coral)
Robert Hoskin 2016
Company Secretary (GVC)
Source: Company information.
Page 25 of 75The senior executive management team of the Combined Group will also include as joint Chief Operating Officers
Andy Hornby, with responsibility for all retail business in the UK and Europe and all digital marketing, and Shay
Segev, with responsibility for technology, product, customer service, and leadership of operational and technology
integrations post-completion. Both individuals have enjoyed significant success in building and integrating leading
businesses in the sector.
Lindsay Beardsell, the existing Ladbrokes Coral General Counsel, will become General Counsel of the Combined
Group and Robert Hoskin, the existing GVC Company Secretary, will become Company Secretary of the Combined
Group. Non-executive directors are expected to be drawn from the current GVC Board.
GVC management has achieved consistently strong results over a number of years through a combination of
organic growth and the successful acquisitions of bwin.party, Sportingbet and betboo. In each case, the acquired
businesses showed stronger revenue growth after their acquisition by GVC and enabled substantial cost savings to
be made through platform consolidation and implementation of best practices. The success of these acquisitions is
reflected in the GVC share price which has risen by more than 700% since 2007.
Ladbrokes Coral management similarly has a track record of successful integration. The expected synergies arising
through the combination of Ladbrokes and Gala Coral were more than doubled from £65 million to £150 million
following the successful delivery of the integration plan. Ladbrokes Coral’s Chief Financial Officer, Paul Bowtell,
and Chief Operating Officer, Andy Hornby, both of whom will join the Combined Group, have been central to this
successful integration process.
Page 26 of 754. Industry overview
4.1. Regulatory landscape
4.1.1. Online gaming regulation
This section describes the regulatory environment for online gaming affecting the GVC Group and the Ladbrokes
Coral Group as at 9 February 2018.
The fundamental overall risk that all online gaming companies face is that, irrespective of the fact that they hold a
licence to provide their services at the point of supply, there are many disparities in the way that their services are
regulated in the jurisdictions in which their customers are based (i.e. from where the services are accessed). Few
jurisdictions recognise foreign licences and many prescribe a local licensing regime. In some cases relevant laws
carry criminal penalties for breaches of local gaming laws. That said, in a number of cases local laws in the
jurisdiction of the customer, i.e. “at the point of consumption”, do not explicitly address online gaming.
In addition, gambling remains a politically controversial issue and widely varying views are held by governments
and regulators around the world as to the merits of permitting consumers to exercise freedom of choice in
accessing online gaming services. Some of the views held are driven by issues of morality, but in the majority of
jurisdictions they are primarily fiscal. There is continued uncertainty as to whether jurisdictions can effectively
criminalise the actions of customers participating in gambling via a remote gaming site, (and/or whether it is
politically expedient to do so) or the actions of an operator based outside the local jurisdiction in supplying those
services from abroad.
The legal justification for the operation of the online gaming industry has, for many years, been founded on the
assertion that, if online gaming is legal in the country from which the supply is made, then the laws in the country
of receipt would have to specifically prohibit the activity of the customer (remotely participating in online gaming)
or support services (with a presence in the jurisdiction) in order to render the operator’s online gaming activities
illegal in the country where the customer is located or support services are sourced and entitle that country to
assert jurisdiction. This follows the VAT treatment applied to other B2C supply of service transactions outside the
gaming industry.
The GVC Group, along with other online gaming companies including the Ladbrokes Coral Group, generally relies
on this argument by supplying services only from jurisdictions in which it holds a valid gaming licence and from
where it is legal to operate. It couples this with refraining from having an established physical presence in
jurisdictions where its activities are expressly prohibited by local law unless the GVC Group has been advised that
enforcement risk is minimal.
4.1.2. Retail gaming regulation
The regulation of retail betting and gaming presents possible risks to the Ladbrokes Coral Group and following the
Effective Date, the Combined Group, both from existing regulation and regulation which may be introduced or
changed in the future.
The betting and gaming industry includes activities such as bookmaking, on-course and off-course betting, gaming,
gaming machines, local and national lotteries, casinos, bingo and football pools. The Ladbrokes Coral Group, and
following the Effective Date, the Combined Group operates in the betting and gaming industry in the UK, Belgium,
Ireland, Spain and Italy.
Page 27 of 754.2. Recent trends in online gaming
4.2.1. Drivers of industry growth
The online gaming industry was launched in the mid-1990s and has gained momentum over subsequent years. A
number of key factors have driven recent market growth:
Increased internet speed: The rollout and increased penetration of high speed internet, along with the
increasing popularity of e-commerce, has been a key driver for growth in the sector. This has allowed online
operators to deliver more sophisticated and appealing games to a greater number of customers
Figure 14: UK average internet speed
Avg. Internet Speed (in Mbps)
16.9
14.9
11.6
9.9
7.9
2013 2014 2015 2016 2017
2013–2017 CAGR
Source: Akamai State of the Internet Reports (2013-17).
Growth in mobile: The strong growth in smartphone penetration and the evolution of mobile connectivity
through ever faster networks have allowed online gaming providers to deliver tailored product offerings
through multiple mobile platforms. As a result, there has been significant revenue growth through these
channels. Mobile phone penetration in Europe stood at 84% in mid-2017 and is projected to reach 86% by 2020
Page 28 of 75Figure 15: Unique mobile phone subscribers – Europe Figure 16: Global M-Payments transactions volume, 2013–
2013–2020E 2019E
Unique subscribers in Europe (in millions) M-Payments total revenue (in US$ billions)
469 1,080
466 930
463
459 780
456
620
451
447 450
444
2013 2014 2015 2016 2017 2018E 2019E 2020E 2015 2016 2017 2018 2019
2013–2020E CAGR 2015–2019E CAGR
Source: Mobile Economy Europe 2017 by GSMA intelligence, pg. 9. Source: TrendForce, 2016.
Increased regulation: Governments have increased online gaming regulations with the aim of protecting
consumers, promoting choice and raising taxes. The increasing legal clarity around online gaming has attracted
new entrants
Increased marketing: Advertising of products by gaming operators in such regulated online markets has
increased in recent years, which has contributed to the growing popularity of the market. The gaming industry
in the UK has spent an estimated £1.4bn on TV and other advertisement since 2012
Increased internet usage: Each of the factors above have also resulted in broader acceptance of digital
channels as a safe and secure means to consume gaming services in Europe. This is evidenced by the fact that
digital channels have continued to represent an increasing proportion of global gaming revenues
Page 29 of 75Figure 17: Internet users in Western Europe
(No. of internet users in millions)
336.1 339.2 341.6
327.4 332.3
313.8 321.1
306.0
297.2
288.3
278.6 82.6 83.4
267.8 79.6 80.8 81.8
258.0 78.4
242.3 75.7 77.1
72.1 74.0
70.3
67.9 53.3 53.7 54.0
65.7 51.4 52.2 52.8
62.6 49.6 50.6
46.8 48.5
43.8 45.3 39.4 40.0 40.4 40.8
42.2 38.0 38.8
40.5 35.8 36.9
33.8 34.5
28.7 32.3
27.4 66.8 66.8
26.1 64.5 65.3 66.0 66.5
61.0 62.4 63.6
56.5 57.2 59.2
48.8 54.6
33.7 35.3 36.6 37.6 38.2 38.8 39.2
28.4 29.1 30.5 32.1
24.1 26.4 27.7
41.7 43.3 45.0 47.3 48.8 50.5 52.0 53.6 54.9 55.8 56.4 56.9 57.4
40.2
2008 2009 2010 2011 2012 2013 2014 2015 2016 2017 2018 2019 2020 2021
UK Spain Germany Italy France Other
2008–2016 CAGR 2016–2021E CAGR
Source: eMarketer online database.
4.2.2. Growth of online gaming
Online channel is the key driver of overall growth in the gaming industry, growing historically in Europe at a
12.3% compound annual growth rate between 2012 and 2016 from an annual gross win of €12.1 billion in 2012
to €19.3 billion in 2016. It is projected to grow at a compound annual growth rate of 6.7% from 2018 to 2022.
Over the same time, the retail channel is projected to grow at only a 0.5% annual growth rate
Within the online gaming segment, mobile gaming is projected to provide the greatest impetus, growing at a
compound annual growth rate of 13.6% between 2018 and 2022
Figure 18: Projected growth in betting and gaming market by channels in Europe
(Gross win, € in billions)
120 ’18E–’22E CAGR
13.9%
100
1.6%
80
60
40 0.5%
20
0
2003 2006 2009 2012 2015 2018 2021
Retail Desktop Mobile
Source: H2 Gambling Capital Global All Product Summary Report, February 2018.
Page 30 of 75Figure 19: Projected growth in global online betting and gaming market by geography
Gross win (€ in billions)
56.3
53.1
50.3
47.1
44.0
40.5
37.2
33.9
30.7
27.3
25.0
21.5 22.6
19.0
17.1
2008 2009 2010 2011 2012 2013 2014 2015 2016 2017 2018E 2019E 2020E 2021E 2022E
Africa Asia / ME Europe LATAM & Caribbean N. America Oceania
2008–2016 CAGR 2017–2022E CAGR
Source: H2 Gambling Capital Global All Product Summary Report, February 2018.
Global online gaming generated NGR of €37.2 billion in 2016, of which 52% was contributed by Europe (€19.3
billion)
The LATAM and Caribbean markets grew the fastest between 2008 and 2016, at a compound annual growth
rate of 18%.This was followed by the African market, which grew at 17.8%. The trend is expected to continue,
albeit at a slower rate, with LATAM projected to grow by 9.7% and Africa by 9.1% between 2018 and 2022.
Europe will continue to be the biggest market at €30.5 billion in 2022, growing at a compound annual growth
rate of 8.2% in the same period
Figure 20: Projected growth in global online betting and gaming market by product
Gross win (€ in billions)
’17E–’22E CAGR
56.3
53.1
50.3
44.0
47.1 10.7%
37.2
40.5 4.5%
30.7
33.9 1.8%
25.0 27.3
19.0
21.5 22.6 7.4%
17.1
6.2%
2008 2009 2010 2011 2012 2013 2014 2015 2016 2017 2018 2019 2020 2021 2022
Betting Casino Poker Bingo Lotteries
2008–2016 2017–2022E CAGR
Page 31 of 75Source: H2 Gambling Capital Global All Product Summary Report, February 2018.
The five key products within the online gaming segment are sports betting, casino, poker, bingo and lotteries.
Online sports betting: Sports betting is the largest vertical in the online gaming sector and was estimated
globally to be worth €18.5 billion in gross win in 2016, an increase of 11% on the prior year. H2GC forecasts that
this growth is set to continue, with the market projected to be worth an estimated €27.2 billion by 2022, a 5 year
compound annual growth rate of 6.2%. This growth will be aided by ever wider ranges of markets to bet on and
advances in technology, alongside smartphone and tablet adoption, which enables players to bet more easily
during the course of sporting events. The introduction of in-play betting, and the growth in the popularity of
mobile and touch devices have been strong drivers of growth in sports betting in recent years
Online casino: The global online casino market was estimated to be worth approximately €9.7 billion of gross
win in 2016, up 9% versus 2015. It is forecast to reach €15.1 billion by 2022, implying a 5 year compound annual
growth rate of 7.4%. Online casinos replicate the real-life casino experience with players playing against ‘the
house’ across online versions of classic casino table games, such as roulette and blackjack, as well as slot and
video games. According to the rules of these games, the operator has a statistical advantage, or ‘edge’, over the
player, which varies depending on the game
Online poker: Despite strong growth since 2001, the online poker market has been impacted by new regulatory
frameworks in a number of markets. In 2006, the United States government passed the Unlawful Internet
Gambling Enforcement Act, which had a significant impact on the structure of the global poker market. As a
result, the majority of operators withdrew from the US. Other countries, such as Italy, France and Spain, also
introduced regulations requiring that players within their markets are ‘ring-fenced’, limiting global player
liquidity. However, in spite of this, poker remains the fourth largest vertical in the online gaming market and
was estimated globally to be worth approximately €2.4 billion of gross win in 2016, unchanged versus 2015. It is
forecast to reach €2.7 billion by 2022, implying a 5 year compound annual growth rate of 1.8%. In recent
developments, a number of countries, including France, Italy and Spain, are planning to share liquidity between
their respective markets
Online bingo: Online bingo is the fifth largest vertical in the online gaming industry, estimated to be worth
approximately €1.7 billion of gross win globally in 2016, up 8% versus 2015. H2GC estimates that it will reach
approximately €2.2 billion by 2022, implying a compound annual growth rate of 4.5% between 2017 and 2022.
The online bingo vertical is categorised as ‘soft gaming’, and is a highly fragmented and competitive market
with a large number of operators. Across various formats of online bingo, players buy online tickets that have
randomly generated numbers on them (the amount of different numbers is fixed and dependent on the format
of the game). Numbers are then randomly ‘called’ by the operator, and the first players to match the numbers
called with the numbers on their online ticket to form a row on that ticket, win prizes. The number of players is
important to an online bingo operator’s success, as the more players that ‘buy in’, the bigger the potential prizes
available, which in turn attracts more customers. As with traditional bingo halls, online bingo rooms offer a
sense of community by providing various chatrooms for players to engage and communicate with one another.
In addition to revenues generated from the purchase of bingo tickets, online bingo operators also generate
significant revenue from side games such as online slots and jackpot slots, which are played in between and
during bingo games
Online lotteries: Online lotteries represented the third biggest product type by gross win in 2016, generating
€5.0 billion. This represented an annual compound growth rate of 13.6% between 2008 and 2016 making it the
fastest growing product group. This trend is expected to continue in the future with online lotteries projected to
grow at a compound annual growth rate of 10.7% between 2017 and 2022
4.2.3. Online gaming in key European countries
Page 32 of 75Figure 21: Projected growth in UK online betting and gaming market by product
Gross win (€ in billions)
’18E–’22E CAGR
10
7.2%
8 (0.4%)
6
10.0%
4
2
0 6.4%
2003 2006 2009 2012 2015 2018 2021
Betting Casino Poker Bingo
Source: H2 Gambling Capital Global All Product Summary Report, February 2018.
The UK is the largest online gaming market in Europe, generating gross win of €5.2 billion in 2016, which is
projected to increase to €8.6 billion by 2022, recording a five year CAGR of 8.3%. Contrary to the global product
revenue share, online casino is the largest product group in the UK, generating €2.8 billion in 2016 and projected to
grow at a 10% CAGR from 2018 to 2022. Conversely, online poker is the smallest product and is expected to shrink
at a CAGR of (0.4%) from 2018 to 2022 as the increased regulatory burden squeezing revenue generation.
Figure 22: Projected growth in German online betting and gaming market by product
Gross win (€ in millions)
’18E–’22E CAGR
2.5
2.0 3.2%
(1.7%)
1.5
2.5%
1.0
0.5
4.6%
0.0
2003 2006 2009 2012 2015 2018 2021
Betting Casino Poker Bingo
Source: H2 Gambling Capital Global All Product Summary Report, February 2018.
Germany recorded online gaming gross win of €1.5 billion in 2016, with online betting contributing 63% of the total
gross win. The overall online gaming market is projected to grow by a modest 3.5% CAGR from 2018 to 2022, with
online betting growing the fastest at 4.6%, followed by online bingo at 3.2%. In line with the trend seen in UK, the
online poker industry is expected to shrink at a 1.7% CAGR from 2018 to 2022.
Page 33 of 75You can also read