Coral Reef Resilience - A Guide to Assessing For decision support - UN Environment Document Repository Home
←
→
Page content transcription
If your browser does not render page correctly, please read the page content below
UN environment 2017

  A Guide to Assessing
Coral Reef Resilience
                                             For decision support

                                       N

                                      4 km

    Relative resilience potential:
       high     med-high    med-low    low
A Guide to Assessing
 Coral Reef Resilience
                                                                          For decision support

                                                                    N

                                                                   4 km

                                 Relative resilience potential:
                                    high     med-high    med-low    low

Jeffrey Maynard 1,2, Paul Marshall 3,4, Britt Parker 5, Elizabeth Mcleod 6, Gabby Ahmadia 7, Ruben van Hooidonk 8,9,
                     Serge Planes 2, Gareth J Williams 10, Laurie Raymundo 11, Roger Beeden 12, Jerker Tamelander 13

      1 — SymbioSeas (www.symbioseas.org) and the Marine Applied Research Center, Wilmington NC, 28411, USA; 2 — Laboratoire d’Excellence «CORAIL»
       USR 3278 CNRS – EPHE, CRIOBE, Papetoai, Moorea, Polynésie Française; 3 — Reef Ecologic (www.reefecologic.org), Townsville QLD 4810, Australia;
              4 — Centre for Biodiversity and Conservation Science, University of Queensland; 5 — The Baldwin Group on contract with the NOAA Coral Reef
             Conservation Program, 1315 East-West Highway, Silver Spring, MD 20910; 6 — The Nature Conservancy, 7707 Vail Valley Dr., Austin, TX 78749;
      7 — Oceans, World Wildlife Fund, 1250 24th St., Washington, D.C. 20037, USA; 8 — NOAA Atlantic Oceanographic and Meteorological Laboratory, Ocean
    Chemistry and Ecosystems Division, 4301 Rickenbacker Causeway, Miami, FL 33149, USA; 9 — Cooperative Institute for Marine and Atmospheric Studies,
                          Rosenstiel School of Marine and Atmospheric Science, University of Miami, 4600 Rickenbacker Causeway, Miami, FL 33149, USA;
         10 — School of Ocean Sciences, Bangor University, LL59 5AB, UK; 11 — University of Guam Marine Laboratory, UOG Station, Mangilao, GU 96913, USA;
                           12 — Great Barrier Reef Marine Park Authority, Townsville QLD 4810 Australia; 13 — United Nations Environment, Bangkok, Thailand
© United Nations Environment Programme, 2017
Published by UN Environment, Nairobi, Kenya

This publication should be cited as:
Maynard, J.A., Marshall, P.A., Parker, B., Mcleod, E., Ahmadia, G., van Hooidonk, R., Planes, S., Williams, G.J., Raymundo, L.,
Beeden, R., Tamelander, J. (2017). A Guide to Assessing Coral Reef Resilience for Decision Support. Nairobi, Kenya:
UN Environment.

Cataloguing-in-Publication entry:

A Guide to Assessing Coral Reef Resilience for Decision Support
ISBN No:              978-92-807-3650-2
Job No:       	DEP/2104/BA

Production:	Dieter Tracey (dieter@sciencegraphics.com.au)

Acknowledgements:
The content of this guide builds upon many published papers and reports, as well as on discussions between the
authors and a large number of coral reef scientists and managers. We acknowledge all of those that have contributed to
developing and applying the concept of assessing reef resilience to support management and conservation decision-
making. We thank these reviewers for helping improve the Guide: Angelique Brathwaite, Alessandrea Vanzella-Khouri,
Georgina Bustamante, Steve Fletcher, Hazel Thornton, Nicolas Pascal and Chloe Harvey.

Reproduction:
This publication may be reproduced in whole or in part and in any form for educational or non-profit services without special
permission from the copyright holder, provided acknowledgement of the source is made. UN Environment would appreciate
receiving a copy of any publication that uses this publication as a source. No use of this publication may be made for resale
or any other commercial purpose without prior permission in writing from UN Environment. Applications for such permission,
with a statement of the purpose and extent of the reproduction, should be addressed to the Director, Communication Division,
UN Environment, P. O. Box 30552, Nairobi 00100, Kenya.

Disclaimer:
The contents in this publication are solely the opinions of the authors and do not constitute a statement of policy, decision
or position on behalf of UN Environment, NOAA or the US Government. The designations employed and the presentation of
material in this publication do not imply the expression of any opinion whatsoever on the part of UN Environment concerning
the legal status of any country, territory or city or its authorities, or concerning the delimitation of its frontiers and boundaries.
Mention of a commercial company or product in this document does not imply endorsement by UN Environment. Trademark
names and symbols are used in an editorial fashion with no intention on infringement on trademark or copyright laws.

Photograph credits:
Jerker Tamelander (front cover, page 8 #2 top-left, page 14, page 18, page 24); Roger Beeden (first inset on front cover,
page 2 top-left, page 6, page 8 #2 bottom-right, page 8 #3, page 20 right); Great Barrier Reef Marine Park Authority
(third and fourth insets on front cover, page 8 #2 bottom-left, page 8 #9 far left and mid-left, page 13, page 15 top two);
XL Catlin Seaview Survey (page ii); Australian Institute of Marine Science (page 2 top-middle, page 16); Paul Marshall
(page 2 top-right and bottom, page 7, page 8 #1, page 9, page 33); Chris Roelfsema (page 4, back cover); Jeffrey Maynard
(page 5, page 22); Conchasdiver | Dreamstime (page 8 #2 top-right); Lisa Carne | Marine Photobank (page 8 #2 far left);
Malik Naumann | Marine Photobank (page 8 #6 mid-left, page 15 far left); Alex Wu | Marine Photobank (page 8 #6
mid-right, page 15 bottom mid-right); Junior Libby | PDP (page 8 #6 far right); NASA Scientific Visualization Studio
(page 8 #8, page 31); Stephen Lewis (page 8 #9 mid-right); Association of Marine Park Tourism Operators (page 8
#9 far-right); Corinn Strickland (page 10); Ed Roberts (page 11); Rafael Ben Ari | Dreamstime (page 12); Steve Spring
| Marine Photobank (page 15 bottom mid-left); Ayana Elizabeth Johnson (page 15 bottom far right); National Oceanic
and Atmospheric Administration (page 20 left); WWF Indonesia (page 23, page 34); Matthew D Potenski | Marine
Photobank (page 32); totajla | fotolia (page 36); Coral Restoration Foundation (page 39).
Contents
Introduction .  .  .  .  .  .  .  .  .  .  .  .  .  .  .  .  .  .  .  .  .  .  .  .  .  .  .  .  .  .  .  .  .  .  .  .  .  .  .  .  .  .  .  .  .  .  .  .  .  .  .  .  .  .  .  .  .  .  .  .  .  .  .  . 1
               About this Guide . . . . . . . . . . . . . . . . . . . . . . . . . . . . . . . . . . . . . . . . . . . . . . . . . . . . . . . . . . . . . . . . . . . . . . . . . . 2
               The context for resilience assessments: Coral reefs in times of change . . . . . . . . . . . . . . . . . . . . . . . . . . . 2
               Vulnerability and resilience . . . . . . . . . . . . . . . . . . . . . . . . . . . . . . . . . . . . . . . . . . . . . . . . . . . . . . . . . . . . . . . . . 3
               What is a resilience assessment and why go through the process? . . . . . . . . . . . . . . . . . . . . . . . . . . . . . . . 5

Conducting a resilience assessment .  .  .  .  .  .  .  .  .  .  .  .  .  .  .  .  .  .  .  .  .  .  .  .  .  .  .  .  .  .  .  .  .  .  .  .  .  . 7
       1       Decide whether to do a resilience assessment, identify pathways of influence, and develop a plan . . . . . . . 9
       2	Select resilience indicators and anthropogenic stressors  . . . . . . . . . . . . . . . . . . . . . . . . . . . . . . . . . . . . . . . . . 14
       3	Collect or compile data for resilience indicators . . . . . . . . . . . . . . . . . . . . . . . . . . . . . . . . . . . . . . . . . . . . . . . . . 17
       4       Analyze data  . . . . . . . . . . . . . . . . . . . . . . . . . . . . . . . . . . . . . . . . . . . . . . . . . . . . . . . . . . . . . . . . . . . . . . . . . . . . . . . 20
       5	Identify key drivers of differences in resilience scores . . . . . . . . . . . . . . . . . . . . . . . . . . . . . . . . . . . . . . . . . . . . 25
       6       Assess anthropogenic stress . . . . . . . . . . . . . . . . . . . . . . . . . . . . . . . . . . . . . . . . . . . . . . . . . . . . . . . . . . . . . . . . . 27
       7	Review climate exposure information . . . . . . . . . . . . . . . . . . . . . . . . . . . . . . . . . . . . . . . . . . . . . . . . . . . . . . . . . . 29
       8	Review connectivity information . . . . . . . . . . . . . . . . . . . . . . . . . . . . . . . . . . . . . . . . . . . . . . . . . . . . . . . . . . . . . . . 31
       9       Formulate management recommendations . . . . . . . . . . . . . . . . . . . . . . . . . . . . . . . . . . . . . . . . . . . . . . . . . . . . . 33
       10	Provide data and share results . . . . . . . . . . . . . . . . . . . . . . . . . . . . . . . . . . . . . . . . . . . . . . . . . . . . . . . . . . . . . . . . 40
               Conducting resilience assessments regularly  . . . . . . . . . . . . . . . . . . . . . . . . . . . . . . . . . . . . . . . . . . . . . . . . 41

References .  .  .  .  .  .  .  .  .  .  .  .  .  .  .  .  .  .  .  .  .  .  .  .  .  .  .  .  .  .  .  .  .  .  .  .  .  .  .  .  .  .  .  .  .  .  .  .  .  .  .  .  .  .  .  .  .  .  .  .  .  .  .  . 42

Additional resources .  .  .  .  .  .  .  .  .  .  .  .  .  .  .  .  .  .  .  .  .  .  .  .  .  .  .  .  .  .  .  .  .  .  .  .  .  .  .  .  .  .  .  .  .  .  .  .  .  .  .  .  . 43
               Data sources mentioned in this Guide . . . . . . . . . . . . . . . . . . . . . . . . . . . . . . . . . . . . . . . . . . . . . . . . . . . . . . . 43
               CNMI resilience assessment technical report and appendices . . . . . . . . . . . . . . . . . . . . . . . . . . . . . . . . . . 43
               MS-Excel tutorial on Analyzing data for a resilience assessment (process Step 4). . . . . . . . . . . . . . . . . . 43
               TNC Reef Resilience Toolkit and Network . . . . . . . . . . . . . . . . . . . . . . . . . . . . . . . . . . . . . . . . . . . . . . . . . . . . 44

                                                                                                                                                                                                        i
A Guide to Assessing Coral Reef Resilience for Decision Support

Coral reefs are losing their resilience. These photos are of a reef near American Samoa in the south Pacific on December of
2014 (left) and then two months later (right). The photo on right is representative of the global-scale coral bleaching event
that took place between 2014 and 2016. Photos: XL Catlin Seaview Survey.

  ii
Introduction

                                                                                                                         Introduction
→→ Coral reefs are naturally resilient
→→ Reefs are losing their resilience because of pressure from human activities
   combined with increasing climate impacts
→→ Resilience can readily be assessed
→→ Supporting resilience needs to be a management priority
→→ Local actions can influence the future resilience of reefs
Coral reef resilience is the capacity of a reef to resist or recover from degradation and maintain provision of
ecosystem goods and services (Mumby et al., 2007).

This resilience helps reefs to resist and recover after major disturbances such as severe tropical storms and mass
bleaching events. Coral reefs are being exposed to these potentially devastating events with greater frequency,
making resilience an increasingly important property.
Yet, through the cumulative impacts of human use and the activities associated with human settlements, coral
reefs are losing their resilience. We are seeing the signs of this all around the world. Examples include regional
declines in coral cover in the Caribbean (Jackson et al. 2014). and widespread conversion of fringing reefs to
algal-covered rubble beds in many areas in the Pacific and Indian Oceans.

Maintaining and restoring resilience is now a major focus of most coral reef managers around the world.

A focus on resilience gives us options – and hope – in the face of new and often daunting challenges.
Underpinning this is the fact that local actions can positively influence the future of coral reefs, despite powerful
external forces like climate change. As examples, coral recovery from disturbances in Bermuda and the Bahamas has
been greater in recent decades than in other parts of the Caribbean. Differences in recovery rates in the Caribbean
have been partially attributed to establishing and enforcing fishing regulations, especially on key herbivores such as
parrotfish (Jackson et al. 2014). Overall though, the application of resilience theory to management planning and the
day-to-day business of coral reef management has been challenging. One of the key stumbling blocks has been the
lack of a robust and easily implementable method for assessing coral reef resilience in a way that can inform marine
spatial planning and help to prioritize the implementation of management strategies.
Fortunately, our ability to assess relative resilience of coral reefs has advanced dramatically in recent years,
and we are now at a point where a feasible and useful process can be recommended for use in environmental
planning and management.

This guide is first and foremost intended for the individuals in charge of commissioning, planning, leading or
coordinating a resilience assessment. It also provides a resource for ‘reef managers’ of all kinds, including
decision-makers, environmental planners and managers in coral reef areas, with influence over pressures
affecting coral reefs.

Outreach coordinators and educators working in coral reef areas may also benefit from the Guide, and they can
participate in parts of the resilience assessment process, but the Guide focuses on the needs of decision-makers
and the scientists who support them.
The guidance presented here represents the culmination of over a decade of experience and builds on ideas first
presented by West and Salm (2003), Obura and Grimsditch (2009), and McClanahan and coauthors (2012). This
Guide puts into managers’ hands the means to assess, map and monitor coral reef resilience, and the means
to identify and prioritize actions that support resilience in the face of climate change. Previously, resilience to
climate change was rarely formally accounted for in marine spatial and conservation planning processes. We
hope this Guide will help change that!

                                                                                                                     1
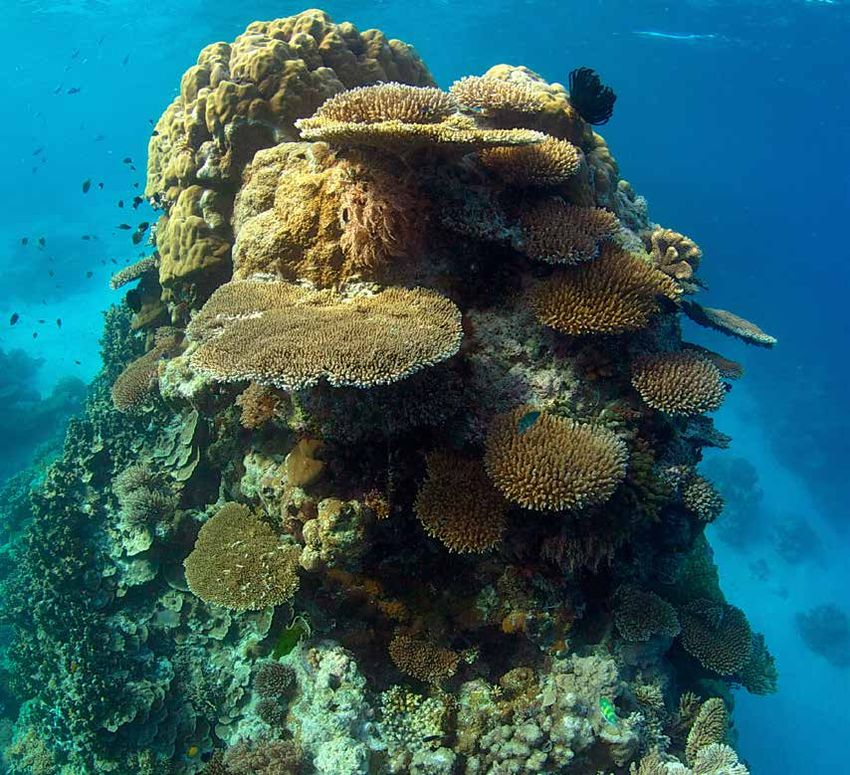
A Guide to Assessing Coral Reef Resilience for Decision Support

About this Guide
The introductory section familiarizes you with resilience and vulnerability concepts and reviews the various
frameworks that are necessary to move from resilience theory to practical application. We help you define the
decision-making contexts that can benefit from resilience assessments, and to clarify the objectives, scope and
intended outcomes for your resilience assessment. A 10-step Guide is then presented for anyone who wishes
to use the resilience assessment process to inform planning or management decisions. The guidance draws
on practical experience in applying resilience concepts to coral reef management (see references to case study
examples), and highlights both technical and process considerations for successful delivery of a resilience
assessment project. We begin by reviewing the context for resilience assessments, followed by the considerations
that can help you decide if resilience assessments are right for you.

The context for resilience assessments: Coral reefs in times of change
Coral reefs have persisted in various forms for hundreds of millions of years. Even today we can observe their
amazing ability to resist and recover after devastating events such as hurricanes, crown-of-thorns seastar
outbreaks and mass coral bleaching. Dramatic recovery of coral cover in places like .like Chagos Archipelago
(Sheppard et al. 2013), Palau (Golbuu et al. 2007), and western Australia (Depczynski et al. 2013) are vivid
illustrations of the importance of resilience when coral reefs are exposed to major disturbances.

Cyclone damage                        Crown-of-thorns seastar outbreaks     Coral bleaching

  2
Coral reefs are the marine ecosystem most vulnerable to climate change, and we are currently witnessing
alarming and persistent declines in their health and abundance. Local pressures associated with human

                                                                                                                         Introduction
settlements and human uses are reducing the natural resilience of coral reefs. These impacts compromise the
ability of coral reefs to recover after disturbances, such as coral bleaching events, which are becoming more
frequent and severe as a result of climate change.

The scale and inexorable progression of climate change can lead to a sense of hopelessness and futility for anyone
engaged in coral reef management. Yet, regional and local actions make a difference. This is exemplified by the
relatively rapid recovery of corals from bleaching in the Chagos Archipelago of the Indian ocean where there are few
human impacts and the ecological processes (e.g., herbivory and coral recruitment) are intact (Graham et al. 2013).

While some of the greatest threats are beyond the direct influence of managers, conservationists and
community stewards, reversing the loss of resilience is not.

Vulnerability and resilience
→→ Vulnerability of a coral reef is a function of exposure and resilience
→→ ‘Exposure’ refers to pressures external to the system, such as effects of climate change
→→ Resilience is a product of sensitivity and adaptive capacity
→→ Local pressures increase sensitivity of coral reefs to climate change
→→ Information on exposure is often publicly available in global datasets
→→ Information on local pressures should be collated or collected as part of the
   resilience assessment
→→ Combining exposure and resilience
   information helps target actions
                                                                Exposure                    Sensitivity
In the IPCC’s widely-used vulnerability assessment
framework, vulnerability is the product of exposure,
sensitivity and adaptive capacity. Exposure and
                                                                                                 Resilience
sensitivity combine to provide an estimate of potential
impact. Adaptive capacity moderates potential
impact to provide a measure of system vulnerability                           Potential                Adaptive
(Turner et al. 2003, Figure 1). Sensitivity and adaptive                      Impacts                  Capacity
capacity are inherent properties of the system that
determine how it responds to exposure. This enables
us to define resilience as the combination of sensitivity
and adaptive capacity in the context of vulnerability
(Figure 1, Marshall and Marshall, 2007). Set out this
way, assessing vulnerability can be seen as requiring                                Vulnerability
information about two key aspects of coral reef
dynamics: exposure and resilience.
                                                                                                              Input
                                                                                                              Output
Exposure captures current or potential external
pressures. Resilience describes the actual or likely
response of the system upon exposure to that                 Figure 1. Vulnerability assessment framework used
                                                             by the IPCC; vulnerability is a function of exposure to
stress or pressure. A resilient system is more likely
                                                             disturbances (especially those that originate outside the
to maintain key functions and sustain provision of           system, such as climate-related stresses) and resilience
ecosystem goods and services when exposed to                 describes how the system (social-ecological) responds
external pressures.                                          (Turner et al. 2003).

                                                                                                                    3
A Guide to Assessing Coral Reef Resilience for Decision Support

This conceptualization of resilience helps us focus on what we can do to reduce vulnerability (reduce sensitivity
or increase adaptive capacity), while acknowledging the importance of factors largely beyond our control
(exposure to climate-related threats).

On-the-ground actions to support resilience are the key to reducing vulnerability to climate change and giving
coral reefs the best chance of coping with the major challenges ahead.

In the context of management of coral reefs, ‘exposure’ is best used to capture pressures that originate
outside the system, such as climate change-related stresses and extreme events. These are outside the
direct control of individual environmental management agencies. Pressures that can be controlled or
influenced through direct management interventions, such as water quality and overfishing, should be
considered as aspects of sensitivity. Characterizing local pressures provides an important window into the
sensitivity of our coral reef system to external pressures, and provides the basis for identifying the ‘levers’
available to us for building resilience of the system. By measuring both ecological resilience indicators
and local stress indicators we are able to assess resilience and identify local actions that can make
a difference to the condition and trend of coral reefs in the face of un-manageable external pressures
like climate change.

Information on exposure to external pressures associated with climate change is, fortunately, readily available to
coral reef managers. For example, data on exposure to temperatures that trigger coral bleaching are available as
high-resolution (4-km) projections of future bleaching event frequency (van Hooidonk et al., 2016). In this Guide,
we discuss how to combine these projections with resilience assessment results to produce a vulnerability
assessment. We also discuss the importance of ecological connectivity to resilience.

Climate exposure and connectivity information can be combined with resilience assessment results to
further inform efforts to identify, prioritize and target actions that can support site and system resilience.

In summary, resilience assessments allow decision makers to anticipate change and to focus efforts on
improving the ability of the system to cope with those changes and unpredictable surprises. In the next section
we outline the approach to and benefits from a resilience assessment.

  4
What is a resilience assessment and why go through the process?

                                                                                                                          Introduction
Resilience assessments involve measuring or assessing the attributes (‘resilience indicators’) that contribute to
making a coral reef resilient, and also collecting measures of the stress related to human activities that can reduce
reef resilience. Resilience assessments make it possible to map relative resilience in your area of interest, and to
track changes in resilience through time.

By looking at the source of resilience at different locations, and the causes of differences in resilience, managers
and stakeholders can evaluate the potential for management or stewardship actions to improve resilience in
different areas.

Repeating resilience assessments through time enables us to measure and monitor change in resilience potential
and management progress, in order to allow us to adapt management.

By going through the resilience assessment process, you can:
   1.   Examine spatial variation in resilience indicators, resilience scores, and anthropogenic stress.
   2.   Identify which indicators most account for differences in resilience among sites.
   3.   Identify sites that have coral communities likely to be more resilient to climate change and other
        human stressors
   4.   Examine the extent to which reefs with high or low resilience are represented within the various use
        zones of an existing MPA or MPA network.
   5.   Identify and prioritize management actions or strategies that will reduce stress at the greatest number
        of sites, at high resilience sites, and/or at sites that are conservation priorities for other reasons, such as
        climate refugia or sites with high biodiversity or cultural value.
   6.   Monitor trends in resilience indicators and resilience through time.

Resilience assessments can provide information for environmental planning and a range of management
decisions, including which areas to prioritize for long-term conservation, and where to target efforts to improve
water quality or reduce fishing pressure, among others. Additionally, resilience is increasingly being used as a
framing concept, or overarching goal, for coral reef management, making assessing resilience centrally important
to many management efforts.

                                                                                                                      5
6
Conducting a resilience assessment

                                                                                                                      Step-by-step guide
A resilience assessment includes 10 sequential steps (see Figure 2).

Thoughtful design, clear pathways to decision-making, regular engagement with planning and management
agencies as well as local stakeholders, and clear and accessible data and reporting products are the
ingredients of a successful resilience assessment.

All resilience assessments comprise these 10 steps. The methods used and degree of investment in each step
can be tailored to suit local capacity and resource constraints. Steps 2-10 follow on from the critical first step,
which is deciding whether to do a resilience assessment. Deciding involves identifying pathways of influence and
characterizing benefits, and then planning your assessment and making the case to others, including management
agencies and stakeholders expected to use findings and recommendations.

Importantly, resilience assessments start by identifying the types of management actions the assessment can
influence (Step 1).

The steps that follow build towards steps 9 and 10 when you will formulate management recommendations and
develop and share final versions of data and reporting products.

Adaptive management of coral reefs in this era of climate change means that the resilience assessment
process is iterative and cyclical.

Reporting on a resilience assessment should involve identifying research gaps and which parts of the process
can be strengthened (i.e., increasing confidence in data used in the assessment through better or different data
collection methods). Filling of research gaps, uncovering new information (e.g., high-resolution connectivity data
or new climate model projections) or identifying new decision-making processes or opportunities (e.g., revision
of existing MPAs) are all reasons to conduct another resilience assessment. The resilience assessment process
is summarized within Figure 2 on p 8. The circle from Step 1 back to Step 1 reflects the possibility you may
conclude ‘Not now’ when evaluating whether a resilience assessment is right for you. We recommend that you
keep open the option to re-visit that decision later (e.g., when new data becomes available indicating changes in
exposure to impacts, or a new opportunity to influence a management decision arises).

                                                                                                                 7
Not now
1. Decide whether to do a resilience assessment, identify pathways of influence, and plan
• What decision(s) can the assessment inform?
• What management processes or agencies are end users of the assessment findings?
• What resources and capacity will you need?
• Need to plan for: clear pathways to decision uptake, meaningful and regular manager partner and
stakeholder engagement, clear and accessible data and reporting products
2. Select resilience indicators and anthropogenic stressors
Resilience indicators: Anthropogenic stressors:
1. *Resistant coral species 8. Herbivore diversity 1. Nutrients (pollution)
2. *Coral diversity 9. Habitat/structural complexity 2. Sedimentation
3. *Herbivore biomass 10. Mature colonies 3. Physical human impacts
4. *Coral disease 11. Light (stress) 4. Fishing pressure
5. *Macroalgae cover 12. Coral size-class distribution
6. *Recruitment 13. Substrate suitability
7. Temperature variability
At least 6 indicators; include all relevant stressors. Ideally, selected indicators will be of roughly
equal importance and then equally weighted in assessment.
3. Collect or compile data for resilience indicators
• Indicators are measured quantitatively
• Survey sites using standard methods at all sites
• Access remote sensing and reef monitoring data as required
• Compile existing data if available from the last 3 years and sites undisturbed
4. Analyze data
Eight steps: (1) normalize data to 0-1 scale, (2) make scale uni-directional (high score =
high resilience), (3) optional – weight indicators, (4) average indicator scores for each site,
(5) normalize average scores, (6) rank sites from high to low resilience, (7) categorize sites
(low to high) based on resilience scores, (8) categorize individual indicator scores from low
to high for each site.
All Islands 0.4 Saipan
5. Identify key drivers of differences in resilience scores n=78 TV
1.0 0.2
0.2
• Highly variable indicators have greater influence on resilience score differences
Normalized value
0.8
HB MA
• Optional — multivariate analyses can be used to identify indicators strongly associated
0.6
CAP2
CAP2
CD BR
0.4
0 CR TV 0
with high and low resilience. 0.2
MA
BR
Shallow
Deep CD
0
-0.2
-0.2
e
er
se
t
e
r
s
y
en
ve
sit
as
or
nc
CR
ov
ea
Co
itm
Sc
go
m
ta
lC
is
Bio
sis
Ru
e
ae
ru
lD
ra
nc
ec
Re
alg
Co
ra
e
ie
or
lR
Co
g
sil
ro
biv
hin
ra
6. Assess anthropogenic stress
ac
Re
Co
er
ac
M
H
Ble
-0.4
-0.2 0 0.2 0.4 0.6 -0.4 -0.2 0 0.2
• Stressors
Centralcan be measured quantitatively or assessedSulawesi,
Philippines qualitatively in the field or using
Indonesia Eastern Papua New Guinea CAP1 CAP1
monitoring data
Tinian Rota
• Proxies can be useful; e.g., distance to pollutant sources for water quality
n=25
• High scores = high stress
8° S
0.2 N
13° N
0.2
0°
MA HB
7. Review climate exposure information
BR TV
CAP2
CAP2
0 HB 0 BR TV
MA
CR
CD
• High-resolution (4-km) climate model projections of bleaching frequency are now publicly CD CR
-0.2
accessible and can vary greatly over local scales.
10° S
-0.2
11° N
• Resilience and exposure data can readily be combined to produce a vulnerability assessment
• Priority sites will be those that are relative climate refugia (i.e., projected to experience annual -0.2 0 0.2 0.4 0.6 -0.2 0 0.2 0.4
severe bleaching >10 years later than other sites in your area) CAP1 CAP1
5° S
Relative resilience potential: high med-low
100 km 200 km 100 km MA = Macroalgae Cover CR = Coral Recruitment TV = Te
122° E 124° E 8.118° E
Review 122° E
connectivity information 149° E 151° E med-high 153°lowE BR = Bleaching Resistance CD = Coral Diversity HB = H
Florida Reef Tract, USA Northern Great Barrier Reef Fiji
• Connectivity information can be used to interpret assessment results and help identify
priority targets for management actions
• Priority sites will be those that are relatively greater sources and not weak sinks
10° N
17° S
9. Formulate management recommendations
26° N
• Meet with manager partners and stakeholders
12° N
18° S
• Recommendations may relate to Marine Protected Area zoning or targeted reduction of stress
through other sectoral actions
100 km
25° N
• Priority sites have higher relative resilience, or lower relative vulnerability, are greater relative sources
of fish and coral larvae and not weak sinks, and are exposed to a manageable anthropogenic stress
19° S
14° N
50 km 50 km Laehou
19.873° N, 155.922° W 19.873° N, 155.923° W
82° W 81° W 142° W data144°
10. Provide and W share results 178° E 179° E 180° 179° W
SHALLOW SCORE: HIGH
SHALLOW DEEP
1 – Shallow, 1 – Deep
Cuba Northern French Polynesia North Kona is
• Ongoing effort during assessment process the origin of the site
name, which means ‘new
• Products tailored to target audience and able to support all intended uses
point’ and refers to a point of
23° N
N
land formed with the 1859
Mauna Loa lava flow.
• Broad communication can increase compliance and promote stewardship 4 km
Relative Resilience
Relative resilience potential:
• Should identify research gaps and parts of assessment with room for improvement
Resilience Coral Coral Bleaching Macroalgae Herbivore
Depth Rank Coral Cover Rugosity
Score Diversity Recruitment Resistance Cover Biomass
high med-high med-low low Shallow
Deep
1/20
1/20
1.00
1.00
0.65
0.77
0.79
0.69
1.00
1.00
1.00
0.84
1.00
1.00
0.14
0.25
0.90
0.82
High (>avg+1 SD) Med-High (>avg and1 Decide whether to do a resilience assessment, identify
Step-by-step guide
pathways of influence, and develop a plan
→→ The decision step involves identifying pathways of influence, characterizing the
benefits the assessment may bring, drafting an assessment plan, and making the
case to others
→→ Identify the management or policy decisions a resilience assessment can inform,
and the entities that can act on recommendations from the assessment
→→ Design your assessment plan by defining the spatial area of interest, planning
how you will conduct each step in the process and estimating the resources and
capacity required
→→ Your plan will include regular consultation with end-users and stakeholders to
ensure a clear path for uptake of the results in decision-making processes.
1. Identifying pathways of influence and characterizing benefits – You first have to determine whether and how
coral reefs and reef-dependent industries and community members will benefit both from assessment findings
and the eventual management outcomes. On p 33 we identify some ways resilience assessments findings
are relevant to management decisions. Could management of coral reefs in your area benefit from any of that
information; i.e., knowing which sites are likely to be more resilient to climate change? Answering this question will
require identifying what decision processes the assessment may influence as well as the management authorities
or stakeholders that can act on assessment findings. Are there obvious upcoming opportunities for resilience
assessment results to inform decision-making, such as establishment, revision or review of a MPA network? Is
a marine spatial planning process planned that can include reef resilience as a consideration? What institutions
have a mandate to take actions that can reduce pressure on coral reefs? Perhaps there is a management plan
that already includes addressing water quality and/or fishing pressure – in this case resilience to climate change
information can be used to target planned actions to reduce these stressors. Has a recent coral bleaching event
or other disturbance caused coral reefs to receive an increase in attention by the media or policymakers, and a
greater demand for action?
9A Guide to Assessing Coral Reef Resilience for Decision Support Attention following bleaching events or other disturbances can arouse interest in resilience assessments. This is an action-oriented process that has managers and stakeholders proactively collaborating to address climate change, and can help overcome feelings of helplessness. Having put thought to how findings of a resilience assessment can be used to strengthen reef management and the way reefs and people could benefit, you will be ready to draft an assessment plan that can deliver those benefits. 2. Drafting an assessment plan – Like any project or management activity, resilience assessments should be designed to address clear objectives, have a well-defined scope and a clear vision for desired outcomes. Having determined what management decisions COULD be informed by a resilience assessment, you now need to design the assessment so that it DOES inform those decisions. You will need to determine the optimal timing for starting the assessment, define the spatial area of the assessment, determine whether and how data will be collected or compiled, and identify the types and nature of desired data and reporting products. In defining the spatial area, take a moment to consider whether resilience to climate change is likely to vary among reefs within this area. Homogeneity among all of the recommended resilience indicators is highly unlikely if your area of interest is larger than a few km. However, if you have reason to believe resilience indicators do not vary in your area of interest, consider that parts of the resilience assessment process may still be relevant to management planning in your area. You may decide to only conduct steps 7-10, whereby management recommendations are formulated based on reviews of climate change exposure information (see Box 3, p 30 on publicly accessible high-resolution (4-km) coral bleaching projections) and/or connectivity information. 10
Step-by-step guide
You will need to consider all of the remaining 9 steps in the resilience assessment process; these steps can
serve as a template for the design of your resilience assessment. How will you conduct each step? What
resources, expertise and capacity are available for the assessment and what resources, expertise and capacity
will you need for each step? In thinking about the Steps, consider whether you should conduct Steps 7 and
8 prior to Step 2; i.e., understanding climate exposure and connectivity patterns may lead to insights that
determine whether you do a resilience assessment and, if you proceed, how you determine where to sample, and
how intensively. This suggestion is especially relevant to those working in large reef systems, such as the Great
Barrier Reef in Australia.

Capacity requirements include diving and snorkeling, managing and analyzing quantitative data and
qualitative observations, spatial data storage and visualization, graphic design, and written and verbal
communication skills.

Regular engagement with management agencies and other stakeholders is another design consideration. Who
will be involved and when and how will they collaborate, provide input on assessment outputs, and influence
outcomes?

All entities that could act on recommendations that result from a resilience assessment are stakeholders as are
all those expected to comply with any resultant management actions. This means local and regional management
authorities, conservation organizations, industries that use or benefit from reefs and the services that reefs provide,
and all other reef users are potential stakeholders.

All stakeholders expected to act on recommendations or comply with resultant actions should be engaged
early and regularly through the resilience assessment process.

                                                                                                                 11
A Guide to Assessing Coral Reef Resilience for Decision Support Stakeholders can help design the resilience assessment by assisting in the selection of indicators or survey sites. Then, a collaborative approach to discussing and selecting assessment methods can help ensure that stakeholders understand and have interest in data collection. From that point, stakeholders can help interpret results, identify and prioritize from among management actions, and provide input to how results are communicated and disseminated. Your resilience assessment can be tailored to your resource constraints and capacity. However, there are a number of resources designed to support reef managers in conducting resilience assessments. The Nature Conservancy’s Reef Resilience Network and Toolkit provide access to online tools, case studies of resilience assessments, and guidance for implementation. Online webinars and discussion forums can help you find answers to questions and collaborate with or be mentored by global experts that have conducted resilience assessments (see Additional Resources section for more detail). Remember that the key is for the assessment to inform the management decisions you have identified. You need to ensure your plan creates a pathway to uptake of the results and the making of those intended decisions. If conducting the assessment with locally available resources and capacity does not enable you to utilize the identified influence pathways, you can explore partnerships with other relevant organizations and/or apply for grant funding. 12
3. Making the case to others — You should clearly document both the expected benefits of a resilience

                                                                                                                    Step-by-step guide
assessment and how your design or plan ensures the assessment can deliver those intended benefits. You will
then be ready to ‘make the case’ for conducting a resilience assessment to superiors, funders and end-users. This
may take place through regular meetings or a workshop specifically for this purpose.

The most important part of making the case to others involves clearly explaining how the resilience assessment
process can inform management decisions and that the process will be responsive to end user needs.

We recommend that you use specific examples of the management actions and policies a resilience assessment
will inform as this will help generate the momentum to get started. By being responsive to feedback from intended
end users of resilience assessment findings you also increase their ownership of assessment findings and the
likelihood that recommendations will be turned into management or policy actions.

Assuming you decide to conduct the resilience assessment process, the next step is to select the resilience
indicators and anthropogenic stressors you will assess.

                                                                                                              13
A Guide to Assessing Coral Reef Resilience for Decision Support 2 Select resilience indicators and anthropogenic stressors →→ Resilience indicators provide an indication of the likelihood the site can resist and recover from disturbances, especially coral bleaching →→ 13 indicators and 4 stressors are recommended for use in resilience assessments →→ At least 6 of the 13 indicators and all relevant stressors should be included →→ The 6 essential indicators are: Resistant coral species, Coral diversity, Herbivore biomass, Coral disease, Macroalgae cover, Recruitment →→ Additional indicators can be selected if deemed to be as important to resistance and recovery as the 6 considered essential Your resilience assessment will involve measuring or assessing ecological factors that contribute to resistance and recovery (e.g., bleaching-resistant coral species and coral recruitment) and anthropogenic stressors that reduce resilience. Ecological factors that contribute to resistance and recovery are called resilience indicators. Recommended resilience indicators and anthropogenic stressors Reef scientists and managers have collaborated to identify and prioritize resilience indicators and anthropogenic stressors (McClanahan et al. 2012). This effort identified indicators for which there is strong evidence of a link to the capacity of corals or a coral community to resist impacts or recover from disturbances. Thirty indicators were rated with respect to perceived importance, strength of scientific evidence and feasibility of assessment/ measurement. Complementary research by Graham et al. (2015) added evidence to the importance of structural complexity (and depth) in understanding recovery after bleaching events in the Seychelles. Based on these studies and experiences from past resilience assessments, we recommend 13 resilience indicators and 4 anthropogenic stressors for consideration in your resilience assessment. 14
Recommended resilience indicators and anthropogenic stressors are ranked in our list from highest to lowest

                                                                                                                    Step-by-step guide
perceived importance to resilience (following McClanahan et al. 2012). The first six (*) are considered essential
and will be important to include in nearly all resilience assessments. See Table 1 for descriptions of these
indicators and stressors along with common units.

Resilience indicators:
  1.   *Resistant coral species                     Herbivore biomass

  2.   *Coral diversity
  3.   *Herbivore biomass
  4.   *Coral disease
  5.   *Macroalgae cover
  6.   *Recruitment
  7.   Temperature variability
  8.   Herbivore diversity
  9.   Habitat/structural complexity
  10. Mature colonies
                                                    Coral recruitment
  11. Light (stress)
  12. Coral size-class distribution
  13. Substrate suitability

Anthropogenic stressors:
  1.   Nutrients (pollution)
  2.   Sedimentation
  3.   Physical human impacts
  4.   Fishing pressure

Nutrients                      Sedimentation                Physical impacts             Fishing pressure

                                                                                                               15
A Guide to Assessing Coral Reef Resilience for Decision Support Selecting indicators As many of the anthropogenic stressors should be measured or assessed as makes sense given the local context (i.e., given which of the four stressors affect reef resilience in your area). While determining which stressors need to be assessed is likely to be straightforward, selecting ecological resilience indicators is more challenging (see case study examples from assessing resilience in the U.S. Virgin Islands, Northern Mariana Islands and Mozambique). Therefore, we offer the following guidance. Six priority ecological resilience indicators should be included in any resilience assessment (those with an asterisk in the list on p 15). These have been found to be the most important predictors of resilience, and also the most useful for discerning differences in resilience among sites. Temperature variability can also be very important. As temperature data are available at 4-km resolution for all coral reef areas from NOAA remote sensing archives, we suggest including temperature variability in assessments (Heron et al. 2016). However, this indicator may not vary significantly within your area of interest (especially if your assessment spans 20 km2 or less); in these cases you can exclude that indicator. Selecting additional indicators requires asking yourself whether any other indicators in the list are likely to be as important for resistance and resilience as the 6 considered essential. If this is the case, those indicators can be added as long as they can be reliably measured or assessed within available expertise and resources. At this point, it is important to understand that including as many indicators as possible is not the goal. The total number of indicators included in an assessment will affect the power that each indicator has to determine differences among sites in resilience; i.e., the importance of each individual indicator is diluted with each additional indicator included. Note that you can include more indicators, and can include indicators that you feel are important but much less so than other indicators you are including and can then weight the indicators based on their relative importance. Weighting approaches are reviewed in Box 1 on p 24. You are likely to find the assessment process easier if you select only indicators you deem to be of roughly equal importance – i.e., strength of links to resistance and recovery in your area – and then equally weight them. 16
3 Collect or compile data for resilience indicators

                                                                                                                          Step-by-step guide
→→ Planned use of the results drives the spatial extent of the assessment
→→ Sampling intensity needs to capture spatial variation in indicators
→→ You may use existing data less than 3 years old provided you do not mix data
   from both before and after a major disturbance
→→ Consistent, or at least comparable, methods should be used for each indicator
   and stressor at all survey sites
→→ Resilience indicators and stressors are considered separately in the assessment
→→ Quantitative data are collected or compiled for resilience indicators
→→ Quantitative or qualitative data are collected or compiled for anthropogenic stressors

The desired spatial extent of the assessment is the key first consideration in determining your data collection/
compilation strategy.

The desired spatial extent of the assessment should be driven by your planned use(s) of the resilience assessment
results. Spatial extent and sampling intensity may both be greater if planning a new MPA or MPA network than
if, for example, you want to determine the relative resilience of sites within a small area adjacent to a proposed
coastal development (see case study examples from Indonesia and Palau). In either case, sites should be surveyed
across the entire area over which you want to conduct the assessment. A sufficient number of sites should be
surveyed to capture spatial variation over the sampling area in the resilience indicators you choose to include.
More sites will need to be surveyed where benthic and fish communities are more variable. Fewer sites can be
surveyed in areas that have lower benthic and fish community variability. The resilience assessment approach
described here can be used at both small and large spatial scales. Where assessments are conducted over large
areas, there may be large gaps between survey sites; there may be anthropogenic stress, climate or connectivity
information (Steps 6, 7 and 8) for these areas that can be used to formulate management recommendations
(Step 9). This highlights that for large reef areas, different parts of the area may have different combinations of
information from which you can formulate recommendations.

You may use existing data or may need to collect new data for all or some of the indicators that you select. For this
reason, your sampling strategy may be determined wholly or partially by your local regular monitoring program. You
may conduct your assessment including only those sites regularly surveyed or may supplement by adding sites to
increase spatial coverage. Examples of resilience assessment results are shown in Figure 3 on p 23 from data
collected specifically for an assessment (a) and from data compiled from a long-term monitoring program (b).

It is recommended that all data used be fairly recent (within 3 years) and be considered to be, to the best of
your knowledge, representative of the current spatial variation in the various indicators.

In determining the age of the data you allow to be included, you will need to consider whether disturbances
occurred recently. For example, if conducting an assessment in 2016 and a severe disturbance, such as a cyclone
or major bleaching event, occurred in early 2015, you should include data from 2016 and late 2015 but not from
2014 or early 2015.

It is key that the methods for collecting the data for each resilience indicator are standardized across all sites
surveyed, or at least that they are comparable. It is also essential that the methods for the resilience indicators are
quantitative rather than qualitative. Resilience is assessed using the resilience indicators only.

                                                                                                                  17
A Guide to Assessing Coral Reef Resilience for Decision Support In the analysis, ecological indicators of resilience are separated from anthropogenic stressors that reduce reef resilience. Given the separation of ecological resilience indicators from anthropogenic stressors, the stressors can be assessed either quantitatively or qualitatively. Further, several of the stressors may be assessed via useful proxies, defined by local conditions and knowledge. For example, site accessibility based on average wave height can be used in some areas as a proxy for fishing pressure (e.g., Maynard et al. 2015). Many methods exist for assessing or measuring the indicators we recommend here. Management agencies or research institutions working in your area are likely to have a standard suite of methods for monitoring coral reef benthic and fish communities. We do not recommend any specific set of methods, but present a suite of possible methods in Table 1 on p 19. The GCRMN publication Methods for Ecological Monitoring of Coral Reefs: A Resource for Managers provides detailed descriptions of popularly used survey methods for all of the recommended resilience indicators. There may also be regionally established protocols and recommended standards, such as in the Caribbean. 18
Table 1. A description of the recommended resilience indicators, along with common units, and a list of potential field methods.

                                                                                                                                                   Step-by-step guide
 Resilience
                           Description                                              Possible methods                     Common units
 indicators
                           Proportion of the reef-building coral
                           community made up by species that have
                                                                            Timed swims, quadrats, belt transects,
 Resistant coral species   demonstrated or are thought to be relatively                                                   % of community
                                                                            point-intercept transects
                           resistant to thermal coral bleaching (Marshall
                           and Baird 2000; McClanahan et al. 2004).
                           A quantitative measure that reflects how
                           many different coral species there are in
                           a dataset, while simultaneously taking
 Coral diversity           into account how evenly the species are          Indices: Shannon or Simpson's Index                Unitless
                           distributed. Common indices express the
                           probability that two species selected at
                           random from a community will be different.
                           Weight per unit area of herbivorous fish
                           and invertebrates. Can be inclusive of all
                                                                            Timed swims, belt transects, stationary
 Herbivore biomass         major herbivore functional groups (scrapers,                                                    kg/100m2, g/m²
                                                                            point counts
                           grazers, excavators, browsers) or can
                           separate these.
                           Proportion of the coral community that is
                           affected by diseases. You may choose to                                                     % (of colonies affected;
                           use a ‘total prevalence’, which combines                                                      a 'total prevalence';
 Coral disease                                                              Belt transects
                           all diseases and all corals, or a subset of                                                  i.e., all or a subset of
                           diseases or corals to assess effects from a                                                  diseases combined)
                           particular disease or on a particular coral.
                           Abundance and density of recently settled
 Recruitment                                                                Quadrats                                            #/m²
                           corals that are less than 2 years old.
                           Variability of temperatures during the           Remotely sensed, available for all coral
 Temperature variability   warm season. Higher variability has been         reefs at 4-km resolution from NOAA                 Unitless
                           associated with bleaching resistance.            remote sensing archives
                           See 'coral diversity' description; same for
                           herbivorous fish and invertebrates. Can also                                                  Unitless (diversity
                           be assessed as the number of key herbivore       Timed swims, belt transects, stationary     indices), or number
 Herbivore diversity
                           functional groups present at a minimum           point counts                               present at a minimum
                           abundance (e.g., scrapers, grazers,                                                              abundance
                           browsers and excavators).
                           Three-dimensionality of the substrate and
 Habitat/structural        crack and crevice depth and diversity.
                                                                            Chain over substrate                                  m
 complexity                Ratio of reef surface contour distance to
                           linear distance.
                           Three-dimensionality of the substrate and
 Habitat/structural        crack and crevice depth and diversity.
                                                                            Chain over substrate                                  m
 complexity                Ratio of reef surface contour distance to a
                           standard linear distance (often 3 m).
                           Proportion of the benthic community made         Timed swims, belt transects, stationary
 Mature colonies                                                                                                          % of community
                           up by long-lived corals (i.e., >10 years old).   point counts
                           Amount of light per square meter reaching
 Light (stress)            the substrate during typical oceanographic       Requires instrumentation                         watts/cm2
                           conditions during the warm season.
                           Evenness of corals within a range of size
 Coral size-class                                                           Timed swims, quadrats, belt transects,
                           classes that includes recruits and mature                                                           Unitless
 distribution                                                               point-intercept transects
                           colonies.
                           Ratio expressing available substrate for coral
                                                                            Timed swims, quadrats, belt transects,
 Substrate suitability     recruits as being suitable and unsuitable for                                                       Unitless
                                                                            point-intercept transects
                           coral settlement.

                                                                                                                                          19
A Guide to Assessing Coral Reef Resilience for Decision Support
4 Analyze data
The resilience assessment analysis examines differences in resilience potential (estimated by your resilience
indicators) by comparing all sites included in the assessment.
Resilience is assessed relative to other sites included in the assessment.
Managers or collaborating scientists may want to analyze relative resilience to compare resilience among sites
considered for protection, specific stress reduction measures or to monitor changes in resilience through time.
The ‘relative resilience score’ can be calculated to give us this information. The process for calculating relative
resilience scores is provided in the 8 steps below.
Calculate a Relative Resilience Score
Calculating the relative resilience scores involves 8 steps.
1 – All scores for resilience indicators are normalized to a scale of 0-1.
2 – All scales are made uni-directional, where a high score means high
resilience.
3 – (Optional) If weighting indicators, scores are multiplied by a weighting or
‘scaling’ factor.
4 – Scores are averaged to produce a raw resilience score.
5 – Average scores are normalized to a scale of 0-1.
6 – Sites are ranked from highest to lowest score.
7 – Sites are categorized into relative ‘low’ to ‘high’ classes.
8 – Scores for indicators are categorized into relative ‘low’ to ‘high’ classes.
An MS Excel-based tutorial is available with data tables that show each of these steps (see “Additional
resources on p 43).
1 — Since resilience indicators are assessed using different units (e.g., g/m2, %, #/m2, etc.) and scales (i.e., they
have different maximum values), the values for all indicators must be converted into a standard scale using a
process called normalizing. To normalize the data, the values for each indicator are divided by the maximum value
for the indicator.
Example: If the maximum bleaching resistance value
is 64%, then a site with 64% receives a 1 (because 64
divided by 64 is 1) and a site with 60% receives a 0.94
(60 divided by 64); all sites with zeros would receive a
zero (zero divided by any number is zero).
2 — For most of the resilience indicators (e.g., resistant
coral species, coral diversity, herbivore biomass), a
high value indicates greater resilience. However, a high
value for some of the resilience indicators suggests
reduced resilience (e.g., presence of macroalgae and
coral disease). We want to ensure that our scale is
uni-directional and that a high score always means
higher relative resilience (what we are aiming for Macroalgae cover Coral disease
20from a management perspective). To address this, the scores for macroalgae and coral disease (if included in the
Step-by-step guide
assessment) are subtracted from 1.
3 — You then must decide whether the indicators will be equally weighted; i.e., whether they are of equal or near-
equal importance to resistance and recovery processes. If so, you would move to Step 4 and do nothing at Step
3. If you are weighting the indicators, the normalized uni-directional scores are multiplied by a weighting factor
(mathematically, this is a ‘scaling factor’). Box 1 on p 24 discusses weighting rationale, approaches, and pitfalls.
4 —The normalized, uni-directional (and weighted, if you chose to) scores for the indicators for each survey site are
averaged to produce the raw resilience score for each site.
5 — The raw resilience scores are normalized by dividing by the maximum score. The end result is a score for each
site that is on a standard 0-1 scale. The final resilience score or value is 1 for the site(s) with the highest relative
resilience and for all others a decimal value (e.g., 0.73) between 0 and 1. This expresses the ‘assessed resilience’
of all sites relative to the site with the highest resilience. The higher the score, the higher the relative resilience.
6 — Sites are then ranked from highest to lowest score (see Table 2).
7 — Sites can be categorized into relative classes for resilience, such as low, medium-low, medium-high, and high,
following calculating the average and standard deviation of the final normalized resilience scores. These classes
can be set as follows where avg = average and sd = standard deviation:
• low (avg-1sd and avg and avg+1sd)
In recent case studies, these four classes were used in combination with the colors red (low), orange (medium-
low), yellow (medium-high) and green (high), respectively, to aid in visualizing and interpreting the resilience
assessment results in tables and maps (see Table 2).
8 — The normalized scores for the individual resilience indicators can be categorized into relative classes. Such
classification, in combination with colors (as described above), as shown in tables (Table 2 on p 22) and maps
(Figure 3 on p 23) can help with comparing assessment results among sites; i.e., answering questions, such
as: which resilience indicators does this high resilience site have medium-high or high scores for? An example
table and map of results from the resilience assessment in the Commonwealth of the Northern Mariana Islands
are shown as Table 2 and Figure 3. You may find that a resilience indicator hardly varies among the survey sites
and all, or almost all, indicators have similar scores or are categorized into the same relative class. Relatively
homogeneous indicators have little to no bearing on the assessment results. This is because indicators with low
variance do little to distinguish sites from one another (see more details in the next section). You should retain
this indicator in your assessment and present those results since the indicator is thought to be important (i.e., you
decided that in the indicator selection process). Collaborating managers and scientists and stakeholders may be
interested in those results.
An MS Excel-based tutorial is available with data tables that show each of the 8 steps, excepting step 3 as
indicators are equally weighted in the tutorial example (See “Additional resources on p 43).
21You can also read