Microtopography is a fundamental organizing structure of vegetation and soil chemistry in black ash wetlands
←
→
Page content transcription
If your browser does not render page correctly, please read the page content below
Biogeosciences, 17, 901–915, 2020
https://doi.org/10.5194/bg-17-901-2020
© Author(s) 2020. This work is distributed under
the Creative Commons Attribution 4.0 License.

Microtopography is a fundamental organizing structure of
vegetation and soil chemistry in black ash wetlands
Jacob S. Diamond1,2 , Daniel L. McLaughlin3 , Robert A. Slesak4 , and Atticus Stovall5
1 GéHCO,  Université de Tours, Tours, France
2 RiverLy,INRAE, Lyon, France
3 Department of Forest Resources and Environmental Conservation, Virginia Tech, Blacksburg, Virginia 24060, USA
4 Minnesota Forest Resources Council, St. Paul, Minnesota 55108, USA
5 NASA Goddard Space Flight Center, Greenbelt, Maryland 20771, USA

Correspondence: Jacob S. Diamond (jacdia@vt.edu)

Received: 2 August 2019 – Discussion started: 16 September 2019
Revised: 16 January 2020 – Accepted: 23 January 2020 – Published: 21 February 2020

Abstract. All wetland ecosystems are controlled by water           that concentrate biomass, soil nutrients, and productivity on
table and soil saturation dynamics, so any local-scale devia-      microsite highs, especially in otherwise wet conditions. We
tion in soil elevation and thus water table position represents    therefore conclude that microtopography is a fundamental
variability in this primary control. Wetland microtopography       organizing structure in black ash wetlands.
is the structured variability in soil elevation and is typically
categorized into a binary classification of local high points
(hummocks) and local low points (hollows). Although the
influence of microtopography on vegetation composition and         1   Introduction
biogeochemical processes in wetlands has received attention
around the globe, its role in forested wetlands is still less      Microtopography is a key component of wetland ecology, in-
understood. We studied relationships among microtopogra-           fluencing a host of fundamental wetland processes. This re-
phy and understory vegetation communities, tree biomass,           sults from the primacy of shallow water table and soil sat-
and soil chemistry in 10 black ash (Fraxinus nigra Marshall)       uration dynamics in driving wetland vegetation composition
wetlands in northern Minnesota, USA. To do so, we com-             and growth and biogeochemical processes (Rodríguez-Iturbe
bined a 1 cm resolution surface elevation model generated          et al., 2007); any variability in soil elevation therefore repre-
from terrestrial laser scanning (TLS) with colocated water         sents coincident variability in this hydrologic control (Wallis
table, vegetation, and soil measurements. We observed that         and Raulings, 2011). For example, perhaps incredibly, exper-
microtopography was an important structural element across         iments have demonstrated that even soil surface variability
sites, where hummocks were loci of greater species richness;       of 2 cm can dramatically increase wetland vegetation germi-
greater midstory and canopy basal area; and higher soil con-       nation, overall biomass, and species richness relative to flat
centrations of chloride, phosphorus, and base cations. In con-     soil surfaces (Vivian-Smith, 1997). This microtopographic
trast, hollows were associated with higher soil nitrate and        effect on vegetation community structure is also borne out
sulfate concentrations. We also found that the effect of mi-       in real wetlands (though with elevation variation on the or-
crotopography on vegetation and soils was greater at wetter        der of 10–50 cm), ranging from freshwater sedge meadows
sites than at drier sites, suggesting that the distance-to-mean    (Werner and Zedler, 2002; Peach and Zedler, 2006) to salt
water table is a primary determinant of wetland biogeochem-        marshes (Windham, 1999; Fogel et al., 2004). Further, in
istry. These findings highlight clear controls of microtopog-      many wetlands, primary productivity tends to increase with
raphy on vegetation and soil distributions while also support-     distance from the water table (Belyea and Clymo, 2001) and
ing the notion that microtopography arises from feedbacks          high points are often loci of greater primary productivity
                                                                   compared to low points (Strack et al., 2006; Sullivan et al.,

Published by Copernicus Publications on behalf of the European Geosciences Union.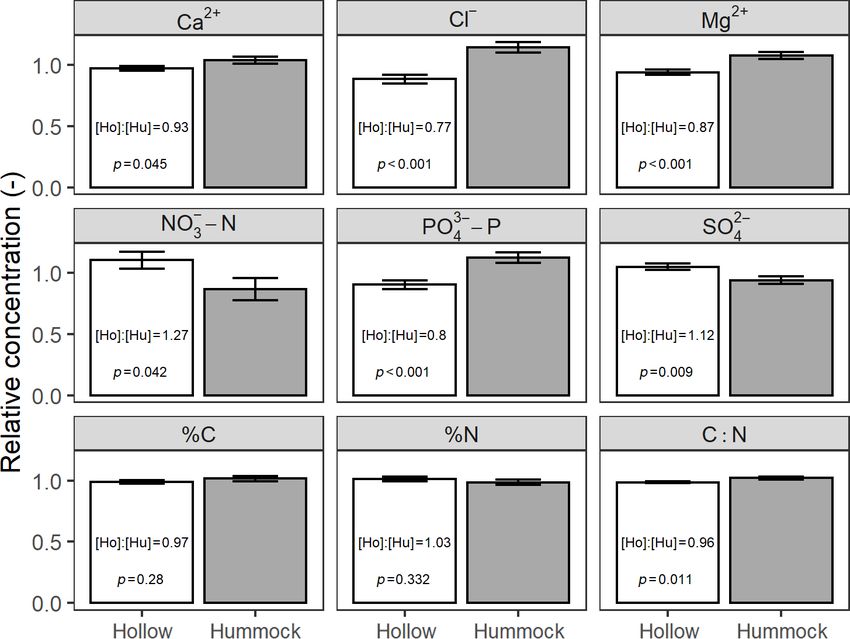
902                                           J. S. Diamond et al.: Microtopography is a fundamental organizing structure

2008), driving the rationale behind wetland drainage for in-       This localized nutrient concentration purportedly leads to in-
creased forestry yields (Laine et al., 1995; Mäkiranta et al.,     creased primary productivity, which leads to more nutrient
2010). Microtopography also augments the spatial extent of         evapoconcentration and so on (Ross et al., 2006). In other
soil redox gradients (Frei et al., 2012), which largely control    words, hummocks may harvest nutrients from hollows, con-
wetland biogeochemical processing (DeLaune and Reddy,              centrating them there. One clear prediction from this hypoth-
2008). However, by far, most studies on wetland microtopog-        esis is greater nutrient – and conservative water tracer – con-
raphy have focused on herbaceous wetlands or northern bog          centrations in hummock soil relative to hollow soil. To the
systems dominated by Sphagnum spp. mosses, leaving open            best of our knowledge, this mechanism remains untested in
questions regarding the commonality of microtopographic            forested wetlands with hummock–hollow terrain.
influence on wetland processes in forested systems.                    In this work, we assessed microtopographic influences on
   The relationship between wetland processes and microto-         vegetation and soil chemistry in black ash (Fraxinus nigra
pography is thought to be reciprocal, where vegetation and         Marshall) swamps in northern Minnesota, USA. Black ash
biogeochemical interactions can in turn support expansion          wetlands are common features throughout the northeastern
of microtopographic features (Eppinga et al., 2009). That is,      US and southeastern Canada that range in soil type (e.g.,
wetland microtopography can result from feedbacks among            from mineral to peat) and hydrology (e.g., from intermit-
hydrology, vegetation, and soil processes that induce soil ele-    tent to ephemeral). Despite the range in habitat, most late-
vation divergence into two modes: (1) a high-elevation mode        successional black ash wetlands are characterized by nearly
(hummocks) and (2) a low-elevation mode (hollows) (Rietk-          pure black ash stands (i.e., over 90 % canopy cover) with very
erk et al., 2004; Eppinga et al., 2008; Heffernan et al., 2013).   little regeneration of other tree species (Palik et al., 2012).
In previous work, we observed clear microtopographic pat-          Importantly, the monotypic nature of black ash systems cou-
terns that we propose arise from these types of ecohydrolog-       pled to existential threats from the invasive emerald ash borer
ical feedbacks (Diamond et al., 2019). If these microtopo-         (Agrilus planipennis) has led to black ash being listed as crit-
graphic patterns are in fact a result of proposed ecohydrolog-     ically endangered (Jerome et al., 2017), making the study of
ical feedbacks, we therefore expect there to be concordant         their ecology a timely matter. In a complementary study (Di-
microtopographic differences in vegetation and soils.              amond et al., 2019) of black ash wetlands, we observed an ev-
   The primary hypothesized feedback that results in               ident hummock–hollow structure that was more pronounced
the observed hummock–hollow microtopography is the                 at wetter sites. Here, we further investigate the ecological im-
productivity–elevation feedback. Preferential colonization         portance of black ash microtopography and ask the following
by plants on slightly elevated sites leads to local buildup of     question: to what extent do the integrated controls of water
organic matter, via primary productivity and sediment ac-          table regimes and microtopography determine spatial varia-
cretion around roots, and further increased elevation (Gun-        tion in vegetation and soil properties?
narsson and Rydin, 1998; Pouliot et al., 2011). Increased              Specifically, we tested the overall hypothesis that elevation
elevation reduces anaerobic stress to plants, leading to fur-      relative to the water table is the primary control on under-
ther increases in vegetative productivity. This productivity–      story composition, tree biomass, and soil chemistry, with the
elevation positive feedback is ultimately constrained and sta-     following specific predictions:
bilized by increased decomposition rates of accumulated or-
ganic matter as hummocks become more aerobic (Belyea and             1. Understory richness and diversity will be (a) greater at
Clymo, 2001; Watts et al., 2010). The resulting microtopog-             drier sites compared to wetter sites, (b) greater on hum-
raphy often displays a clear structure, with observations of            mocks than hollows, and (c) positively correlated with
marked spatial patterns in open bog (Eppinga et al., 2009)              elevation relative to the water table.
and marsh systems (Casey et al., 2016) and potentially in            2. Mid- and canopy-level basal area will be (a) greater at
swamp systems as well (Diamond et al., 2019). If these feed-            drier sites compared to wetter sites, (b) greater on hum-
backs are operating in wetlands, the expectation is greater             mocks than hollows, and (c) positively correlated with
vegetation biomass and productivity on hummocks rather                  elevation relative to the water table.
than hollows.
   An additional feedback mechanism that can reinforce and           3. Soil nutrient and conservative tracer (chloride) concen-
maintain wetland microtopography is preferential hummock                trations will be (a) less variable on drier sites than wet-
evapoconcentration of nutrients. Greater productivity and               ter sites, (b) greater on hummocks than hollows, and
thus greater evapotranspiration rates on hummocks com-                  (c) positively correlated with elevation relative to the
pared to hollows drive a net flow of water and dissolved nu-            water table.
trients toward hummocks (Rietkerk et al., 2004; Wetzel et al.,
2005; Eppinga et al., 2008, 2009). Nutrients are consequently
rapidly cycled through vascular-plant uptake and plant lit-
ter mineralization on the more aerobic hummocks (Malmer
et al., 2003), leading to local nutrient concentration effects.

Biogeosciences, 17, 901–915, 2020                                                        www.biogeosciences.net/17/901/2020/
J. S. Diamond et al.: Microtopography is a fundamental organizing structure                                                     903

2     Methods                                                        typically had the deepest O horizons (> 100 cm) and were
                                                                     associated with Typic Haplosaprists or Typic Haplohemists
2.1    Site descriptions                                             (Soil Survey Staff, 2019). Although depression and transition
                                                                     sites had thicker O horizons than lowland sites, depression
We tested our hypothesis in 10 black ash wetlands of vary-           site organic soils were typically muckier and more decom-
ing size (0.07–0.12 ha) and hydrogeomorphic landscape po-            posed than more peat-like transition site soils. We previously
sition in northern Minnesota, USA (Fig. 1). The study re-            characterized hydrology at these sites (Diamond et al., 2019)
gion is characterized by a glacial moraine landscape (400–           and found that lowland sites were considerably drier on av-
430 m a.s.l.) that is flat to gently rolling, with the black ash     erage than depression or transition sites (note hydroperiods
wetlands found in lower landscape positions that commonly            in Fig. 1) and exhibited much more water table variability.
grade into aspen- or pine-dominated upland forests. Climate          Depression sites were typically wetter than transition sites
is continental with mean annual precipitation of 700 mm              and were more frequently inundated. Depression and transi-
and a mean growing season (May–October) temperature of               tion sites also exhibited significantly more microtopographic
14.3 ◦ C (WRCC, 2019). Annual precipitation is approxi-              structures than lowland sites, with over twice as much eleva-
mately two-thirds rain and one-third snowfall, and poten-            tion variability on average (Diamond et al., 2019).
tial evapotranspiration is 600–650 mm yr−1 (Sebestyen et al.,
2011).                                                               2.2     Field measurements
   Black ash stands are commonly highly uneven-aged (Erd-
mann et al., 1987), with canopy tree ages ranging from 130 to        We conducted field sampling campaigns to characterize the
232 years, and stand development under a gap-scale distur-           vegetation and soil chemistry of our study systems. We then
bance regime (D’Amato et al., 2018). Black ash is also typ-          coupled these data to previously collected water table and
ically slow growing, achieving heights of only 10–15 m and           elevation data (Diamond et al., 2019) to address our hypoth-
diameters at breast height of only 25–30 cm after 100 years          esis and predictions. Water table data (15 min measurement
(Erdmann et al., 1987).                                              intervals) were collected at each of our 10 sites from 2016
   In previous work (Diamond et al., 2019) and as part of            to 2018, where negative values represent belowground water
a larger project (D’Amato et al., 2018), we categorized and          levels and positive values represent aboveground levels (see
grouped each wetland site by its hydrogeomorphic charac-             Diamond et al., 2019, for details). Elevation data were col-
teristics as follows: (1) depression sites (D; n = 4) character-     lected in 2017 using high-resolution terrestrial laser scanning
ized by a convex, pool-type geometry with geographical iso-          (TLS) measurements within three, randomly placed 300 m2
lation from other surface water bodies; (2) lowland sites (L;        circular plots at each site (plots were placed at most 50 m
n = 3) characterized by flat, gently sloping topography; and         from each other to ensure overlap of TLS scans). These data
(3) transition sites (T; n = 3) characterized as flat, linear fea-   were then used to create 1 cm digital elevation models and
tures between uplands and black spruce (Picea mariana Mill.          to delineate hummock versus hollow features (see method
Britton) bogs. Additional detail on site characteristics is pro-     details in Diamond et al., 2019, and Stovall et al., 2019).
vided in Diamond et al. (2019), but we provide a brief sum-          With these data, we were able to calculate a relative eleva-
mary of their characteristics here. The studied wetlands var-        tion above the mean water table for each vegetation or soil
ied in soil type, organic layer depth, hydrology, and vegeta-        sampling point and to categorize each sampling point as a
tion but were all characterized by having a black ash canopy         hummock or hollow.
dominance of at least 75 %. At the lowland sites, other over-
story species were negligible, but at the depression and tran-       2.2.1    Understory composition
sition sites there were minor cohorts of northern white-cedar
(Thuja occidentalis L.), green ash (Fraxinus pennsylvanica           We characterized understory vegetation at each site to test
Marshall), red maple (Acer rubrum L.), yellow birch (Be-             the prediction that understory richness and diversity will be
tula alleghaniensis Britt.), balsam poplar (Populus balsam-          greater on higher-elevation features. To do so, we used a
ifera L.), and black spruce (Picea mariana Mill. Britton). We        quasi-random-walk sampling scheme within the 300 m2 plots
believe that our sites are late-successional or climax com-          (three per site) previously used for TLS elevation measure-
munities and have not been harvested for at least a century.         ments. We term the sampling design quasi-random because
Soils are primarily organic Histosols characterized by deep          we constrained the random sampling locations by quad-
mucky peats underlain by silty clay mineral horizons, with           rant, allowing us to sample each quadrant of a circular plot
depression and transition sites having deeper organic layers         approximately equally (13 points per plot; Fig. S1 in the
than lowland sites (Soil Survey Staff, 2019). Depression sites       Supplement). At each sampling point, we used a 0.25 m2
were commonly associated with Terric Haplosaprists with              square quadrat to classify vascular and moss individuals
O horizons 30–150 cm deep; lowland sites were associated             at the species level, visually estimated their percent foliar
with poorly drained mineral histic Inceptisols with thin O           cover (1 %, 2 %, and nearest 5 %), and recorded stem count
horizons (< 10 cm) underlain by clayey till; transition sites        (if possible) for vascular species. We chose a 0.25 m2 size

www.biogeosciences.net/17/901/2020/                                                           Biogeosciences, 17, 901–915, 2020
904 J. S. Diamond et al.: Microtopography is a fundamental organizing structure
Figure 1. Map of the 10 studied black ash wetlands in northern Minnesota, USA, with sites colored by average annual hydroperiod (i.e.,
number of surface-inundation days per year from May to November) for 2015–2018. © Google Maps 2019.
quadrat as it corresponded to the smallest hummock areas the water table and employed plot-scale point clouds of for-
that we observed in the field and thus was on the scale est structure from the aforementioned TLS campaign (see
of elevation variation at each site. Vegetation surveys oc- Stovall et al., 2019). We estimated overstory DBH (i.e.,
curred during July 2017, coinciding with peak vegetation > 2.5 cm) from these TLS point clouds with the SimpleTree
presence. Vascular-plant identifications were made accord- algorithm implemented in Computree (Hackenberg et al.,
ing to Eggers and Reed (1988), and nonvascular-plant (liv- 2015). The SimpleTree algorithm models trees as cylinders
erworts and mosses) identifications were made according to by segmenting trees using an iterative nearest-neighbor ap-
Janssens (2014). Species that we were unable to identify in proach that moves vertically from an initial seed point along
the field were assigned a genus or standard unknown code the stem while expanding in area with increasing crown size.
and collected in a bag for later identification. The best least-squares cylinder at approximately 1.3 m above
ground provided estimates of DBH. Following DBH analy-
2.2.2 Tree biomass sis, we matched each processed tree with an elevation value
from our original TLS analysis (Stovall et al., 2019). We
were only able to apply the SimpleTree algorithm at six of
We used two different data sources to assess the prediction
our sites and only on a fraction of our scanned areas at those
that midstory and canopy basal area will be greater on higher-
sites (approximately 300 m2 at each of the six sites), due to
elevation features. The first data source comprised standard
resolution issues and understory noise.
stand metrics and was used for our site-level comparisons.
These stand data were collected as part of a larger study by
the USDA Northern Research Station in Grand Rapids, Min- 2.2.3 Soil chemistry
nesota, and included species, basal area, and density for both
midstory (2.5 ≤ diameter at breast height (DBH) ≤ 10 cm) To assess the prediction that soil chemistry heterogeneity will
and canopy (> 10 cm DBH) for each site. covary with elevation variability, we cored soil at a subsam-
The second data source was used to relate specific trees ple of the 390 sampling points in the previously described
and their basal area to a specific base elevation relative to quasi-random-walk sampling design. We determined the sub-
Biogeosciences, 17, 901–915, 2020 www.biogeosciences.net/17/901/2020/J. S. Diamond et al.: Microtopography is a fundamental organizing structure 905
sampling points prior to site arrival with the intention of sam- Legendre, 2009). This analysis generates an indicator value
pling all points at a minimum of one plot (13 points) per site. index (IV) for each species within each category (e.g., site or
We sampled one plot at sites D2, D3, D4, and T3 but two microsite) based on two metrics: specificity (i.e., the proba-
plots at the remaining sites for a total of 208 sampling points bility that a sample point belongs to a particular group, given
out of our original 390. We first removed the top layer of that the species was found there) and sensitivity (i.e., the
moss and litter and then used a 15 cm beveled and serrated probability that the species is found in sample points be-
soil knife to extract our soil samples (approximately 5 cm in longing to a particular group). To remove the influence of
diameter at the soil surface) to a depth of 10 cm. rare species on the indicator analysis, we limited the candi-
Following standard methods (DeLaune and Reddy, 2008; date species to those that were present in more than 10 %
U.S. EPA, 2008), we air-dried soil samples over 2 weeks; of their identified microsite or site category. Using this re-
removed visible roots (typically greater than 2 mm in diame- duced sample, we identified species or species combinations
ter); and hand-ground, mixed, and sieved soils to pass a 2 mm that had a specificity of at least 0.80 and a sensitivity of at
mesh to create a representative sample of the 10 cm soil in- least 0.20, based on observations of clear delineations in the
crement. Total carbon and nitrogen concentrations were de- indicator species output and on guidance in package materi-
termined with dry combustion on 0.25 g subsamples with a als (Cáceres, 2013). We also conducted Welch’s two-sample
CN elemental analyzer (vario MAX; elementar Analysen- t test on richness between hummocks and hollows for each
systeme GmbH, Langenselbold, Germany). For anions and site and calculated hummock–hollow Bray–Curtis commu-
cations, we used a modified water extraction method (Jones nity dissimilarity indices, which fall between 0 and 1, where
3−
and Willett, 2006). Nitrate (NO− 3 ) and phosphate (PO4 ) 1 indicates complete dissimilarity and 0 indicates identical
were analyzed colorimetrically with a segmented flow ana- communities. The t test allowed us to test our prediction that
lyzer (SEAL AA3; SEAL Analytical, Mequon, WI, USA) hummocks were more diverse than hollows within a site,
using equipment methods G-200-97 and G-175-96, respec- and the dissimilarity index allowed us to further determine
tively. Chloride (Cl− ), sulfate (SO2− 2+
4 ), calcium (Ca ), and how different the vegetation communities were. Last, we an-
2+
magnesium (Mg ) were analyzed with ion chromatography alyzed within-site relationships between point-scale under-
(Standard Methods 4110, Dionex ICS-3000; Thermo Fisher story richness and point-scale elevation relative to the mean
Scientific, Waltham, MA, USA). water table using a generalized linear mixed-effect model
(GLMM). We conducted GLMM analysis with the lme4 R
2.3 Data analysis package (Bates et al., 2015) using suggested methods for
Poisson distributions from Bolker et al. (2009) and chose the
Across our different environmental variables, we took the best model based on the Akaike information criterion (AIC)
following general approach: (1) test for site-scale differences and Bayesian information criterion (BIC).
focusing on site water table metrics (e.g., mean, median, and
variance) as predicting variables, (2) test for microsite-scale 2.3.2 Tree biomass
(hummock vs. hollow) categorical differences, and (3) test
for point-scale influences of elevation relative to the water We tested our prediction that site-scale hydrology influences
table. tree biomass by regressing site-scale (midstory and canopy)
basal area with site-scale water table metrics. To determine
2.3.1 Understory composition categorical differences in tree biomass between hummocks
and hollows, we used individual tree DBH data (from the
To test our prediction that site hydrology is a strong con- TLS data) and compared the cumulative basal area between
trol on understory composition, we regressed mean (n = 3 hummocks and hollows. We then estimated the fraction of
plots) site-level richness and diversity with site-level hydrol- tree basal area at each site that occupied hummocks relative
ogy metrics using simple linear regression. To assess categor- to hollows. Finally, we analyzed within-site relationships be-
ical differences in understory vegetation composition among tween point-scale DBH (from the TLS data) and tree base el-
both sites and microsites (i.e., hummock vs. hollow), we evations relative to the mean water table using a linear mixed-
used a multivariate permutational analysis of variance (PER- effect model (using the lme4 R package; Bates et al., 2015).
MANOVA) on understory vegetation in ordination space.
For ordination, we used nonmetric multidimensional scal- 2.3.3 Soil chemistry
ing (NMDS) with the vegan package (Oksanen et al., 2018)
in the R statistical software (R Core Team, 2018). Prior to To test the prediction that there would be less variation in
ordination, we removed rare species (< 1 % presence over- soil chemistry at drier sites compared to wetter sites, we
all) from the understory community matrix (McCune and conducted standard ANOVA and post hoc Tukey’s honestly
Grace, 2002). We also evaluated species fidelity and asso- significant difference t test on soil extraction chemistry. We
ciation with particular sites and microsites (hummocks ver- first examined differences in each analyte among hydroge-
sus hollows) using the indicspecies R package (Cáceres and omorphic categories (via Levene’s test on group variance),
www.biogeosciences.net/17/901/2020/ Biogeosciences, 17, 901–915, 2020906 J. S. Diamond et al.: Microtopography is a fundamental organizing structure
and then tested differences among individual sites. To assess
microsite influence on soil extraction chemistry, we exam-
ined differences between hummocks and hollows, averaged
across sites. Across-site comparison of hummocks and hol-
lows (as opposed to within-site comparison) increased the
power of our inference because, due to our random sampling,
some sites did not have equal measurements of hummocks
and hollows. Prior to averaging across sites, we normalized
soil extraction concentrations to the site-level average con-
centration for each analyte to compare relative differences
between hummocks and hollows across sites, even when ab-
solute concentrations differed among sites. Normalized con-
centrations were compared between hummocks and hollows
across sites using Welch’s two-sample t test; we also calcu- Figure 2. Plot-level richness or diversity, aggregated by site, as a
lated ratios of hollow-to-hummock concentrations to assess function of the site-level median water table relative to the ground
differences, regardless of among-site variability in absolute surface (negative values indicate belowground). Letters and sym-
concentrations. Finally, we regressed point-scale soil analyte bols refer to hydrogeomorphic site types: D refers to depression
concentrations versus local elevation relative to the water ta- sites, L refers to lowland sites, and T refers to transition sites. Ver-
ble using best-fit linear mixed-effect modeling (via the lme4 tical bars on points indicate bootstrapped 95 % credible intervals
R package; Bates et al., 2015). calculated from the three plot measurements per site. The linear re-
gression model results presented are also shown. Hydrology sum-
maries are provided in Table S2.
3 Results
Funaria hygrometrica Hedw., Rhizomnium magnifolium
3.1 Understory composition (Horik.) T. Kop., and Thuidium delicatulum (Hedw.)
Schimp.) were the most distinguishing species found on
Across all sites (30 plots), we observed 95 distinct understory hummocks across sites (Table 1). The best hummock indi-
species: 9 moss species, 85 vascular species, and 1 liverwort cator species was Climacium dendroides (Hedw.) F. Weber
species. The most common vascular species were sedges of & D. Mohr, with it having an 87 % chance of indicating that
the Carex genus, grasses of the Glyceria genus, Impatiens a sampling point is on a hummock (specificity) and a 59 %
capensis Meerb., Aster lateriflorus (L.) Britton, and Caltha chance that it will be present at a point, given that the point
palustris (L.). The most common mosses were Calliergon is a hummock (sensitivity). Similarly, for hollows, a moss
cordifolium (Hedw.) Kindb., Thuidium delicatulum (Hedw.) species (Calliergon cordifolium (Hedw.) Kindb.) was the best
Schimp., and Rhizomnium magnifolium (Horik.) T. Kop. indicator species, although common duckweed (Lemna mi-
We observed a clear influence of site-scale hydrology on nor L.) had a nearly perfect (99 %) chance of indicating that
site-scale community composition, with the mean and me- a sampling point was a hollow. When we removed the crite-
dian daily water table being the best predictors. The median rion for across-site species presence (> 10 %), we observed
daily water table was a linear predictor of both understory approximately an order of magnitude more candidate indica-
richness (F2,28 = 10.6; p = 0.003) and diversity (F2,28 = tor species for hummocks than for hollows, with most species
13.6; p < 0.001; Fig. 2). The mean water table, to a lesser having very high specificity (Table S1 in the Supplement).
extent, also explained similar amounts of site-level variance We also observed distinct differences in understory rich-
in richness (R 2 = 0.25) or diversity (R 2 = 0.29). Lowland ness between hummock and hollow microsites. Hummocks
sites and transition sites tended to clump together in this re- were nearly always locations of greater combined moss
lationship, but depression sites exhibited far more intra- and and vascular-plant species richness (Fig. 3). This pattern
across-site variability in richness and hydrology. was identical when separating mosses from vascular plants
NMDS demonstrated clear ordinal separation of the un- (Fig. S3). We found the greatest hummock–hollow differ-
derstory community matrix between hummocks and hol- ences in understory species richness in depression sites
lows across sites (PERMANOVA; F1,18 = 4.07; p = 0.002) (mean water table = 0.01 m), with less difference in transi-
and between hummocks and hollows within sites (PER- tion sites (mean water table = −0.04 m) and lowland sites
MANOVA; F1,18 = 4.76; p = 0.001; Fig. S2). Hummocks (mean water table = −0.32 m; see Table S2 for site hydrol-
and hollows were more similar for lowland sites, particu- ogy summaries). Bray–Curtis dissimilarities for both mosses
larly L1 and L3, compared to depression and transition sites and understory vascular plants were greatest for depression
(Fig. S2). and transition sites (BC values in Figs. 3 and S3).
Indicator species analysis revealed that four moss species
(Climacium dendroides (Hedw.) F. Weber & D. Mohr,
Biogeosciences, 17, 901–915, 2020 www.biogeosciences.net/17/901/2020/J. S. Diamond et al.: Microtopography is a fundamental organizing structure 907
Table 1. Indicator species analysis for hummocks and hollows across sites. Species indicator values (IV) range from 0 to 1 and are the product
of specificity and sensitivity conditional probabilities. Specificity is the conditional probability that the sampling point belongs to a particular
microsite, given the fact that a particular species was found there, and sensitivity is the conditional probability of finding a particular species
in a sampling point, given that the sampling point belongs to a particular microsite.
Microsite Species Specificity Sensitivity IV
Hummock Climacium dendroides (Hedw.) F. Weber & D. Mohr 0.87 0.59 0.51
Funaria hygrometrica Hedw. and Rhizomnium magnifolium (Horik.) T. Kop. 0.85 0.27 0.23
Rhizomnium magnifolium (Horik.) T. Kop. and Thuidium delicatulum (Hedw.) Schimp 0.90 0.24 0.21
Hollow Calliergon cordifolium (Hedw.) Kindb. 0.79 0.61 0.48
Lemna minor L. 0.99 0.27 0.27
Carex tuckermanii Boott 0.58 0.29 0.17
Glyceria striata (Lam.) Hitchc. 0.77 0.21 0.16
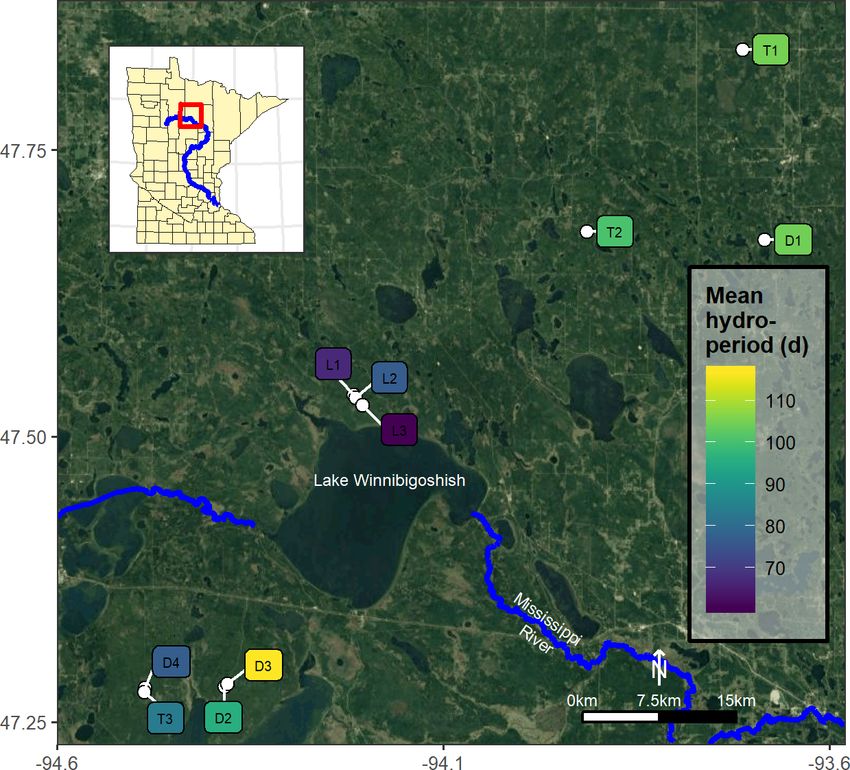
Figure 3. Combined understory vascular and moss richness hummock and hollow comparison. Text values indicate community dissimilarity
indices and Welch’s two-sample t test results. BC text values indicate Bray–Curtis dissimilarity, with a 0–1 range, spanning identical (0) to
completely dissimilar (1) vegetation communities.
At the point scale, the best-fit GLMM for richness ver- rapid increases in richness with increased elevation at dry
sus elevation relative to the mean water table was one with sites. Overall, we observed that moss richness increased ap-
site-level random effects for both intercept and slope, as proximately 22 % less than vascular-plant richness with in-
well as a dummy variable for moss (contrasted with vascu- creasing elevation. To visualize more clearly the results from
lar understory vegetation; Table 2). Although random site ef- this point-scale analysis, we plotted GLMM-predicted rich-
fects modulated the richness–elevation relationship, all site ness values as a function of relative elevation above the wa-
slopes were significantly greater than 0 (see site-specific fits ter table without considering site effects (Fig. 4). Both moss
in Fig. S4), implying a positive association between richness and vascular plants exhibited only one or two species when
and elevation across sites. Importantly, drier lowland sites at sampling points near or below the mean water table, but
had lower overall slopes (i.e., more negative random slope species counts increased rapidly beginning near the mean
effects) compared to wetter sites (Fig. S4a), indicating less water table, notably for vascular plants.
www.biogeosciences.net/17/901/2020/ Biogeosciences, 17, 901–915, 2020908 J. S. Diamond et al.: Microtopography is a fundamental organizing structure
Table 2. GLMM results for species richness versus relative eleva- Table 3. Cumulative sum of basal area by hummock and hollow
tion. across sites.
Effect Term Estimate SE Z score P (Z > |z|) Site Hummock basal area Hollow basal area
Fixed Intercept 1.07 0.09 11.62
0.0001 (m2 per 300 m2 ) (m2 per 300 m2 )
z 2.04 0.31 6.66
0.0001
Moss −0.45 0.04 −10.17
0.0001 D1 2.33 0.36
D3 2.60 0.27
Random SD intercept 0.26
D4 2.04 0.11
SD z 0.74
Cor (z intercept) −0.69 L1 0.16 2.01
L2 no data 1.76
Note: Random effects are presented here as the standard deviation (SD) of all site
effects on intercept and slope, with correlation (Cor) between random intercept and
T1 2.71 0.17
slopes. Figure S3 has individual site effects.
to drier lowland sites, where trees do not prefer hummocks
to hollows, at least not in our subsampled areas.
Point-scale linear mixed-effect models of DBH versus rel-
ative elevation did not reveal any significant (p > 0.05) rela-
tionship (fixed effect = 2.2 ± 2.8 cm m−1 ; t = 0.77; and see
Fig. S6). We note here, however, that the matching proce-
dures to tie digital elevation models from TLS to tree base
height elevations likely have high uncertainty.
3.3 Soil chemistry
There were clear differences in soil chemistry among site
hydrogeomorphic groups and among individual sites for all
analytes (ANOVA; F2184–202 = 5.1–143.8; p < 0.01; Fig. 5).
Depression sites had the lowest soil base cation concentra-
Figure 4. Predicted understory species richness as a function of ele- tions (Ca2+ and Mg2+ ), followed by lowland and then tran-
vation above the mean water table based on the GLMM without ran- sition sites. Depression sites and transition sites had consid-
dom site effects included, split by moss and vascular species com-
erably less NO− 3 –N than lowland sites but somewhat more
ponents. Shaded ribbons indicate 95 % confidence intervals about
the estimate. PO3−4 –P and clearly higher C : N. However, there was more
variability among sites than among hydrogeomorphic site
groupings. There was some indication that drier lowland sites
3.2 Tree biomass exhibited less variability in soil chemistry than wetter transi-
tion and depression sites, but this trend was not consistent
There was no significant linear relationship (p < 0.05) be- across analytes (Table S3). For example, we observed signif-
2−
tween basal area and hydrologic metrics for either the canopy icantly greater variance in %C, NO− 3 –N, and SO4 in drier
or midstory level, at the site scale. We observed that T1 was lowland sites than in wetter sites (Table S3).
a major outlier in the midstory basal area–elevation rela- We also found differences (Welch’s two-sample t test;
tionship, but its omission did not result in a significant fit p < 0.05) in soil chemistry between hummocks and hollows
(p = 0.137). for seven out of nine analytes (Fig. 6). Except for NO− 3–
Using our TLS-derived DBH data at a subset of sites N, %N, and SO2− 4 , hummocks had higher analyte concen-
(n = 6), we further assessed differences between hummocks trations than hollows. Across-site hummock–hollow differ-
and hollows. Total basal area was disproportionately (by an ences in mean concentrations ranged from −27 % for NO− 3–
order of magnitude) associated with hummocks at the wettest N to +23 % for Cl− . Although some sites varied in their rel-
sites (D1, D3, D4, and T1), but the relative lack of hum- ative differences between hummock and hollow analyte con-
mocks at the drier sites (L1 and L2) inverted this relation- centrations (Table S4), broad patterns were still discernible
ship (Table 3). Further, across all size classes, we found that wherein hummocks were generally loci of higher Ca2+ , Cl− ,
trees in the wettest sites (depression and transition) occu- Mg2+ , PO3− 4 –P, C, and C : N (though only by 4 %) relative to
pied hummocks 83 %–94 % of the time (Fig. S5). We also hollows.
observed a size-dependent association with hummocks, es- We found strong linear relationships between concentra-
pecially for sites D1, D3, and T1, where larger trees (i.e., tion and relative elevation above the water table at the sam-
trees with DBH > 20 cm) were 2–3 × more likely to exist on ple point scale for six out of nine soil chemistry analytes
hummocks compared to hollows (Fig. S5). This is in contrast (Figs. S7, S8). Results from this point-scale linear fitting
Biogeosciences, 17, 901–915, 2020 www.biogeosciences.net/17/901/2020/J. S. Diamond et al.: Microtopography is a fundamental organizing structure 909 Figure 5. Average soil extraction concentrations for every site and solute analyzed. Shapes correspond with site hydrogeomorphic type; vertical bars indicate bootstrapped 95 % confidence intervals about the mean for each site, and horizontal bars indicate means within groups. Significantly different groups at p = 0.05 are labeled with letters. Note: %C, %N, and C : N are unitless (–) and are determined from combustion, not soil extraction. Figure 6. Across-site comparison between hummocks and hollows of relative concentrations of soil analytes. Relative concentration for any particular sample is normalized to its site-average concentration. Text in each panel refers to the across-site ratio of hollow-to-hummock relative concentrations and the Welch’s two-sample t test of hollow and hummock means. align with categorical results from hummock and hollow ear relationships with elevation (Fig. S7). The linear mixed- analysis (Fig. S8). Some analytes varied much more among effect models were fit with a restricted maximum likelihood sites in the concentration–elevation relationship than others, estimation with uncorrelated random intercepts and slopes; leading to large variability in some best-fit lines (e.g., Ca2+ , standardized residuals were normally distributed about 0. NO3− –N), but most analyte concentrations had clear lin- Random site effects modulated the overall concentration– www.biogeosciences.net/17/901/2020/ Biogeosciences, 17, 901–915, 2020
910                                           J. S. Diamond et al.: Microtopography is a fundamental organizing structure

elevation relationship, implying large variability in responses    and L3) had considerably less understory community varia-
(direction and magnitude) among sites (Table S5). We did           tion between microsites than the wetter depression or tran-
not observe clear patterns in random effects relating to sites     sition sites, supporting the notion that distinct and function-
or site hydrogeomorphic groupings (Fig. S7), indicating no         ally important microsite states arise in response to wet con-
obvious control of hydrology or setting on the strength of         ditions. Assessment of species fidelity to specific microsites
these relationships. However, relationships for PO3−  4 –P and     provided further support that hummocks and hollows are dis-
Cl− were similar in wetter depression and transition sites in      crete ecosystem states (cf. Watts et al., 2010). We suggest
contrast to drier lowland sites, which did not have as steeply     that the presence of microtopography increases overall site
positive linear relationships with elevation.                      richness, a finding supported by similar studies of richness
                                                                   and microsite variability (Beatty, 1984; Vivian-Smith, 1997;
                                                                   Bruland and Richardson, 2005). Therefore, microtopography
4     Discussion                                                   greatly expands potential hydrologic and associated habitat
                                                                   niches. It would be informative to take a larger-scale perspec-
Using integrated measures of fine-scale topography, water          tive by assessing the importance of each microsite to overall
table regimes, and vegetation and soil attributes, our work        landscape level biodiversity and through comparison of hum-
highlights the primary control of elevation and microsite po-      mock species compositions to those of surrounding upland
sition in black ash wetlands. Findings demonstrate these con-      forests.
trols on vegetation distributions, tree biomass, and soil chem-       In addition to different community structure between
istry at both site and within-site scales, driven by distance to   hummocks and hollows, we found strong evidence for our
the water table and thus decreased anaerobic stress at drier       prediction that hummocks support a higher number and
sites and on elevated hummocks at wetter sites. We suggest         greater diversity of understory vegetation species than hol-
that these results support feedback models of hummock–             lows (Fig. 3). In our systems, hummocks were loci for ap-
hollow development, where increased vegetative productiv-          proximately 60 % of total sampled species per site, with
ity at higher microsites leads to increased microsite elevation    larger richness differences between hummocks and hollows
with reciprocal controls on vegetation composition and soil        in wetter sites. This finding aligns with field observations of
chemistry at site and microsite scales.                            visually distinct breaks between the relatively bare organic
                                                                   surface of hollows and the verdant structure of hummocks.
4.1    Controls on understory composition                          We suggest that greater understory richness on hummocks
                                                                   may imply greater understory gross primary production vis-
Site-scale hydrologic behavior of black ash wetlands is a ma-      à-vis the richness–productivity relationship (Olde Venterink
jor determinant of site-scale understory richness and diver-       et al., 2003; van Ruijven and Berendse, 2005), lending cre-
sity. We found that even a simple hydrologic metric like me-       dence to a productivity–elevation feedback. Adding further
dian water table could explain 30 % of intersite understory        support, modeling demonstrated clear increases in richness
richness variability (Fig. 2). For example, our wettest site       with elevation, where the slope of this relationship was great-
had half of the species richness of our driest site and was        est at the wettest sites (Figs. 4 and S4). Perhaps these are
two-thirds as diverse. Numerous other studies have observed        not surprising results given that distance to the water ta-
the influence of hydrologic regime on site-scale species rich-     ble may be the most important control on wetland com-
ness (e.g., van der Valk et al., 1994; Nielsen and Chick, 1997;    munity structure (Bubier et al., 2006; Økland et al., 2008;
Nielsen et al., 2013), but most have been based on experi-         Malhotra et al., 2016). Our results add black ash swamps
mental studies of expected hydrologic change or carried out        to a number of wetland ecosystems with similar understory
in riparian systems dominated by flood pulses. This study          microtopography–richness structures, including salt marshes
demonstrates that black ash wetlands, which are abundant           (Stribling et al., 2006), alluvial swamps (Bledsoe and Shear,
ecosystems in the Great Lakes region (e.g., they cover ap-         2000), tidal freshwater swamps (Duberstein and Conner,
proximately 5 % of forested land in Minnesota, Michigan,           2009; Courtwright and Findlay, 2011), tropical swamps (Ko-
and Wisconsin; USDA Forest Service, 2016), may exhibit             ponen et al., 2004), boreal swamps (Økland et al., 2008), and
similar hydrology–richness responses as other studied wet-         northern sedge meadows (Peach and Zedler, 2006). The con-
land systems and further solidifies hydrology as the primary       cordance of similar observations across systems substantiates
determinant of understory species distributions in wetlands.       hypotheses that hummocks play a critical role in supporting
   Despite clear site-scale hydrologic controls on understory      wetland plant diversity.
richness, we also observed a dominant microsite-scale in-             Lastly, we note that, while hollows have fewer species
fluence on community composition. Both NMDS analysis               on average than hummocks, they are not devoid of under-
and Bray–Curtis dissimilatory indices indicated not only that      story productivity. At some sites, we observed large swaths of
hummocks and hollows separated along community struc-              Carex spp. in the hollow understory, whose thick stems and
ture but also that the degree of this separation was highly site   spanning rhizomes would have contributed to high primary
dependent. For example, drier lowland sites (especially L1

Biogeosciences, 17, 901–915, 2020                                                        www.biogeosciences.net/17/901/2020/
J. S. Diamond et al.: Microtopography is a fundamental organizing structure 911
productivity. Follow-up studies could focus on this aspect of shallower (e.g., within 10 cm of the surface), net ammonifica-
hummock–hollow differences in these and other systems. tion dominates (Hefting et al., 2004). Specific to our predic-
tion, we found some support that within-site variation in an-
4.2 Controls on tree biomass alytes (specifically for Cl− , PO3− 2+
4 –P, C : N, %N, and Mg )
was greater at wetter sites, suggestive of more variable redox
Although not a significant direct association, we found some conditions and biogeochemical processing.
indirect evidence that links site-scale hydrology to tree basal We found some support that hummocks can act as evap-
area. The driest sites (lowland sites) had the greatest basal oconcentrators of mobile soil chemical pools. The strongest
area (Table S2), supporting observations from floodplain evidence for this comes from the relatively high level of the
wetlands where sites that received less inundation were more conservative tracer, chloride, in hummocks relative to hol-
productive and had greater basal area than intermediately or lows (23 % greater on average; Fig. 6). Chloride is commonly
regularly inundated sites (Megonigal et al., 1997). However, used across scales and systems as a hydrologic tracer to eval-
other drivers may also influence these differences, including uate hydrologic storage and transport processes (Kirchner
variability in disturbance regime or pedological characteris- et al., 2000; Kirchner et al., 2010), and its concentration in
tics that were outside the scope of this study. terrestrial waters is widely attributed to evaporation effects
Our findings also highlight local hydrologic influences (e.g., Thorslund et al., 2018). In northern bogs, encroachment
and demonstrate that trees at wetter sites almost exclusively or presence of woody vascular plants can dramatically in-
occupy raised hummocks; almost the entirety of live basal crease evapotranspiration losses (Takagi et al., 1999; Frankl
area corresponded directly to elevated hummock structures and Schmeidl, 2000), aligning with results here and sug-
in the wettest black ash systems (Fig. S5). A recent study gesting that presence of black ash trees and their associated
of canopy competition in black ash wetlands acknowledged understory hummock species may be significant drivers of
this importance of microsite variation in explaining lack of evapotranspiration on hummocks.
predicted competition and subsequent tree size distributions The significantly greater amounts of soil phosphorus on
among black ash trees (Looney et al., 2016). In contrast to hummocks also indicate directional concentration from hol-
our findings at the site level, we did not find support for our lows to hummocks. Eppinga et al. (2008) were the first to
prediction that basal area would correlate with tree base ele- empirically test and provide evidence for hummock evap-
vation within sites. However, this may not be surprising for oconcentration of limiting nutrients, which had previously
three primary reasons: (1) black ash trees are extremely slow been suggested as a mechanism inducing greater phospho-
growing, and there can be very little discernible variability rus on tree islands in the Everglades, Florida (Wetzel et al.,
in DBH across trees of different age classes (D’Amato et al., 2005; Ross et al., 2006). In addition to evapoconcentration,
2018; Looney et al., 2018); (2) hummock heights (and thus mechanisms of increased nutrient availability in hummocks
tree base elevation), while centered around some site mean, relative to hollows may be also attributed to accumulation
exhibit variation within a site, leading to a range of eleva- of debris and litter (Resler and Stine, 2009) and/or higher
tions supporting trees with similar DBH; and (3) tree base turnover and cycling rates (Wetzel et al., 2005). Both the
elevations were difficult to ascertain using our TLS match- mass of absorptive fine roots (Li et al., 2020) and mycor-
ing method, leading to high uncertainty in elevation measure- rhizal activity are greater in hummocks than hollows, which
ments. Perhaps in wetter black ash systems, trees that estab- may be important for P acquisition from ferric-bound parti-
lish and survive eventually reach similar sizes based on re- cles (Cantelmo Jr. and Ehrenfeld, 1999). Overall, our finding
source constraints or growth patterns, but it is more common of greater phosphorus on hummocks aligns with numerous
that they establish and survive on hummocks at the wettest studies where hummocks are consistently found to be zones
sites. of greater phosphorus concentrations than hollows (Jones et
al., 1996; Wetzel et al., 2005; Eppinga et al., 2008).
4.3 Controls on soil chemistry Hummocks were also enriched in base cations compared
to hollows. We postulate that this base cation enrichment ef-
We observed clear and significant differences in soil chem- fect may be a result of preferential uptake and rapid nutri-
istry among sites that could broadly be attributed to site-scale ent recycling by black ash trees located on hummocks. Black
hydrology and site hydrogeomorphic category. For example, ash trees are known to exhibit considerably higher Ca2+ and
the drier lowland sites had an order of magnitude greater Mg2+ in live tissues than neighboring species at the same site
NO− 3 –N soil concentrations than wetter depression or tran- or in other nearby ecosystems (Reiners and Reiners, 1970),
sition sites (Fig. 5) despite having nearly equal soil total N indicating preferential uptake of these nutrients relative to
(CV = 0.1). We suggest that the water table regimes of our other species.
sites correspond directly with expected water table and soil- In contrast, we observed that hummocks were sites of
specific shifts in N processing. In general, where water ta- lower nitrate concentrations, which contrasts with find-
bles are deeper below the ground surface (e.g., by 30 cm ings from other microtopographic studies (e.g., Bruland
or more), net nitrification dominates; where water tables are and Richardson, 2005). However, Courtwright and Find-
www.biogeosciences.net/17/901/2020/ Biogeosciences, 17, 901–915, 2020912 J. S. Diamond et al.: Microtopography is a fundamental organizing structure
lay (2011) also observed hollow nitrate enrichment, which mocks and hollows for further elucidation of evapoconcen-
they attributed to biologically mediated effects such as en- tration differences. Inferences along these lines would also
hanced uptake on hummocks and coupled nitrification– be bolstered by leaf tissue measurements on hummocks and
denitrification. However, the unexpected NO− 3 –N enrich- hollows to test for limiting nutrients. We also suggest inves-
ment on hollows in this study may simply be due to sampling tigating, at the microsite level, additional species of nitrogen
after leaf fall, which may have transferred NO− 3 –N to hol- (e.g., ammonium), sulfur (e.g., sulfide), and other important
lows, or perhaps because soils were recently aerobic, allow- redox compounds (e.g., iron) and biogeochemical processes
ing for nitrification to proceed in hollows. Additionally, sam- (e.g., denitrification) that may explain observed trends in soil
ple drying procedures may have led to relatively greater ox- chemistry.
idation of ammonium in hollow samples compared to hum-
mock samples.
Results for SO42− were also in contrast to what we ex- 5 Conclusions
pected, as we had surmised that oxidized SO2− 4 would be
greater in aerobic hummocks than in more anaerobic hol- This work provides support for ecosystem engineering by
lows. Our results also contrast with observations in saltwa- vegetation in forested wetlands, where vegetation capital-
ter systems, where vegetated zones are areas of increased izes on and amplifies small changes in surface elevation.
SO2−4 due to root-zone oxygenation of reduced toxic sulfides The result of this engineering is hummock–hollow microto-
(Hsieh and Yang, 1997; Madureira et al., 1997; Ferreira et pography, where hummocks and hollows are distinct, self-
al., 2007), and also contrast with coupled sulfur hydrology– organized ecosystem states. Here we used the case study of
microtopography modeling exercises for freshwater systems black ash wetlands to illustrate this possibility. Importantly,
(Frei et al., 2012). Similar to nitrate, some of this discordance we found that black ash hummocks are characterized by in-
may be attributed to soil drying procedures, which could have creased understory species richness, tree biomass, and nutri-
allowed time for oxidation of previously reduced sulfur com- ent availability, all of which are likely due to reduced hy-
pounds in hollow samples. drologic stress. We conclude the following: (1) vegetation
We found some evidence for our hypothesis that rela- preferentially occupies and reinforces hummock structure
tive elevation, as opposed to simply microsite position, was and (2) hummock and hollow microtopography yields pre-
a major control on soil chemical pools in black ash wet- dictable patterns of vegetation and soil chemistry. Therefore,
lands (Figs. S7 and S8). Unsurprisingly, all analyte–elevation we infer that microtopography is a fundamental organizing
trends directly corresponded with categorical hummock– structure of many black ash wetlands, particularly those that
hollow trends, both in direction and in strength. We also undergo wetter conditions and have shallow water tables.
observed some indication that Cl− and PO3− 4 –P exhibited
more similar and more positive relationships with elevation
in wetter sites compared to drier sites, potentially indicat- Code and data availability. All data and code for analysis are
ing enhanced evapoconcentration at wetter sites. Whereas available from the authors on request.
most other studies examining relative-elevation effects on
soil chemistry use sample depth to water table as their eleva-
tion measurement (e.g., Bubier et al., 2006; Stribling et al., Supplement. The supplement related to this article is available on-
2006), our study took a combined approach where we moni- line at: https://doi.org/10.5194/bg-17-901-2020-supplement.
tored water table regimes at one location but measured rela-
tive surface elevation in high resolution at all points. Hence,
two major underlying assumptions in our approach are that Author contributions. JSD, DLM, and RAS designed the study, and
the water table is flat across our study area and that capillary JSD carried it out. JSD conducted all analyses with input from all
coauthors. JSD prepared the paper with contributions from all coau-
fringe and/or hydraulic redistribution effects are negligible
thors.
in comparison to water table fluctuations. Without field ob-
servations we cannot verify this assumption but believe it is
reasonable considering the relatively small site areas and flat
Competing interests. The authors declare that they have no conflict
terrain. We concede that this approach may be inappropriate of interest.
for other systems with less organic soils or more undulating
terrain but note that it appeared to provide reasonable and
practical results in our case. Acknowledgements. This project was funded by the Minnesota En-
Our work provides a strong foundation for viewing mi- vironmental and Natural Resources Trust Fund, the USDA Forest
crotopography as a primary determinant of soil chemistry Service Northern Research Station, and the Minnesota Forest Re-
distributions in black ash wetlands. Future studies could ex- sources Council. Additional funding was provided by the Virginia
plore differences in evapotranspiration rates between hum- Tech Department of Forest Resources and Environmental Conserva-
tion, the Virginia Tech Institute for Critical Technology and Applied
Biogeosciences, 17, 901–915, 2020 www.biogeosciences.net/17/901/2020/You can also read